금속 3D 프린팅 수치해석

FLOW-3D World Users Conference 2023

Home

FLOW-3D WELD
FLOW-3D WELD
New unified user interface, New process templates, Improved Reflection model,...
What's New in FLOW-3D CAST 2025R1
better quality, efficiency and precision in complex non-ferrous castings, Improved valve model
What's New in FLOW-3D HYDRO 2025R1
New discrete element method (DEM) model
What's New in FLOW-3D 2025R1
New discrete element method (DEM) model
What's New in FLOW-3D CAST 2025R1
What's New in FLOW-3D POST 2025R1
Pathtracing improvements, History data calculator, EXODUS file format improvements
FLOW-3D AM
FLOW-3D AM
Improved reflection model, Improved heat source integration, Particle-particle interactions...

2026 한국해양과학기술협의회 공동학술대회 참가

2026 한국해양과학기술협의회 공동학술대회에 에스티아이씨앤디 부스로 참가했습니다.

📅 일시  2026년 5월 27일(수) ~ 5월 29일(금)

📍  장소  부산항국제전시컨벤션센터

많은 관심에 감사드립니다.


FLOW-3D European Users Conference가 2026년 6월 15일부터 17일까지 사흘간 독일 뒤셀도르프의 Steigenberger Icon Parkhotel 에서 개최되었습니다.
많은 관심 감사드립니다.


FLOW-3D HYDRO Workshops

FLOW-3D HYDRO Workshops
Register for a FLOW-3D HYDRO workshop

Civil & Environmental Consultants, Inc.

Knoxville, TN

Host a FLOW-3D HYDRO Local Workshop 


CUSTOMER 추천 평가

FLOW-3D는 오늘날 복잡한 자유 표면 및 제한된 흐름 문제를 분석하는 데 사용할 수 있는 가장 강력한 도구 중 하나입니다. 사용하기 쉬운 모델링 인터페이스를 제공하며 지난 15년 이상 제가 작업한 수력 발전, 환경, 수자원 및 처리 관련 프로젝트의 설계에 필수적인 도구였습니다. Flow Science의 기술 지원 팀과 개발자는 함께 작업하기 쉽고, 조언을 제공하고, 코드의 잠재적 개선 사항에 대한 사용자의 의견을 듣고, 발생하는 문제를 신속하게 해결하고자 합니다. Flow Science의 전체 팀은 함께 일하기에 훌륭했고 모든 엔지니어에게 훌륭한 자원입니다.

FLOW-3D is one of the most powerful tools available to analyze complex free surface and confined flow problems out there today. It provides an easy-to-use modeling interface and has been an integral tool in the design of hydroelectric, environmental, water resource and treatment related projects I’ve worked on over the last 15+ years. Flow Science’s technical support team and developers are easy to work with and are eager to provide advice, hear input from its users on potential enhancements to the code as well as quickly resolving issues that arise. The entire team at Flow Science have been great to work with and are a great resource to all engineers.
FLOW-3D CAST는 우리의 품질 프로그램에 엄청난 자산이었습니다. 6가지 주조 시뮬레이션 소프트웨어를 평가한 후 Howell Foundry는 FLOW-3D CAST를 구매하기로 결정했습니다. 이 결정의 일부 요인에는 설정 다양성, 비용 및 가장 중요한 시뮬레이션의 현실 정확도가 포함됩니다. 업데이트된 결과 뷰어와 결합된 FLOW-3D CAST 의 강력한 시뮬레이션 기능은 가장 복잡한 작업에서 특히 첫 번째 타설에서 고품질 주조를 보장하는 데 도움이 되었습니다.

FLOW-3D CAST has been a tremendous asset to our quality program. After having evaluated six different casting simulation software, Howell Foundry made the decision to purchase FLOW-3D CAST. Some of the factors in this decision include its setup versatility, cost, and most importantly its accuracy of the simulation to reality. FLOW-3D CAST’s powerful simulation ability coupled with its updated results viewer has been especially helpful on our most complex jobs to make sure we have a quality casting on the first pour.
우리는 FLOW-3D를 사용하여 지난 20년 동안 많은 소모성 발사체 시스템에 대한 추진제 슬로시 및 풀스루 시뮬레이션을 개발했습니다. 보다 최근에는 Flow Science 지원 직원이 차량 기동으로 인한 ullage collapse effects를 포착하기 위해 극저온 추진제 탱크 시뮬레이션에 열 전달을 추가하는 데 중요한 역할을 했습니다.

We have used FLOW-3D to develop propellant slosh and pull-through simulations for a number of expendable launch vehicle systems over the last 20 years. More recently, the Flow Science support staff has been instrumental in helping us add heat transfer to cryogenic propellant tank simulations in order to capture ullage collapse effects due to vehicle maneuvers.
저는 연구 및 산업 응용 분야에서 유체 흐름 문제를 해결하는 데 15년 이상 FLOW-3D를 사용해 왔습니다 . 우리는 강 및 해안 구조물, 수처리 장치, 댐, 여수로, 깊은 터널 및 CSO 전환 구조물의 설계에 이 소프트웨어를 광범위하게 사용합니다. FLOW-3D는 수치 솔버 기술, 클라우드 컴퓨팅, 전처리 및 후처리 도구의 최신 기술을 통합하여 고객에게 상당한 시간과 비용을 절감합니다. FLOW-3D 영업 및 기술 지원 팀은 훌륭합니다!

I have used FLOW-3D for over 15 years solving fluid flow problems in research and industrial applications. We use the software extensively in the design of river and coastal structures, water treatment units, dams, spillways, deep tunnels, and CSO diversion structures. FLOW-3D integrates state of the art in numerical solver techniques, cloud computing, pre- and post-processing tools resulting in substantial time and cost savings to our clients. FLOW-3D sales and technical support teams are excellent!
FLOW-3D 는 다른 소프트웨어로 시각화하거나 정량화하기 어려운 복잡한 유압 문제에 대한 통찰력을 제공하는 정교한 도구입니다. 정교함에도 불구하고 소프트웨어는 매우 사용자 친화적이며 Flow Science는 훌륭한 문서와 기술 지원을 제공합니다. FLOW-3D 모델 에서 얻은 결과는고객과 사내 비모델러 모두에게 깊은 인상을 남겼습니다.
 
FLOW-3D is a sophisticated tool that provides insight into complex hydraulic problems that would be difficult to visualize or quantify with other software. Despite the sophistication, the software is very user friendly, and Flow Science provide great documentation and technical support. The results we have obtained from our FLOW-3D models have impressed both our clients and non-modelers in-house.
4C-Technologies에서 우리는 거의 35년 동안 다양한 소프트웨어 흐름 시뮬레이션 솔루션을 사용하는 선구자였습니다. 다양한 금속 합금으로 주조된 HPDC 부품에서 부품 설계 및 도구/러너 설계를 최적화합니다. 2008년부터 우리는 FLOW-3D를 사용하여 지금까지 최고의 정확도를 제공하는 것으로 나타났습니다. 또한 FLOW-3D 팀 의 지원은 탁월합니다.

At 4C-Technologies we have been pioneers in using various software flow simulation solutions for nearly 35 years. We optimize part designs and tool/runner designs on casted HPDC parts in various metal alloys. Since 2008 we have solely been using FLOW-3D as it turned out to give by far the best accuracy. Furthermore, the support from the FLOW-3D team is outstanding.
20년 이상 FLOW-3D 와 함께 CFD 분석을 사용하면서 우리의 신뢰 수준은 이제 일반 연구 목적 및 최종 설계 응용 프로그램에 CFD 모델링을 사용하는 데 확신을 가질 정도로 높아졌습니다. 이 소프트웨어는 개념적 세부 사항과 구성을 신속하게 변경할 수 있는 유연성을 제공하여 설계를 단계적으로 진행할 수 있도록 합니다.

From using CFD analysis with FLOW-3D for over twenty years, our level of trust has increased to the point that we are now confident in using CFD modeling for general study purposes and final design applications. The software gives us flexibility to quickly change conceptual details and configurations allowing the design to advance in stages.
우리는 FLOW-3D AM을 사용하여 기초 과학의 경계를 발전시켜 왔습니다 . FLOW-3D AM은 다중 합금 3D 프린팅 중 복잡한 현상을 지배하는 물리학에 대한 우리의 가설을 테스트하는 훌륭한 도구였습니다. FLOW-3D AM은 우리가 열 프로필의 진화와 관련된 물질 전달 및 복잡한 적층 구조에서 열 응력의 발달을 이해하는 데 도움이 되었습니다.

We have been using FLOW-3D AM to advance the boundaries of fundamental science. FLOW-3D AM has been a great tool to test our hypotheses about the physics governing complex phenomena during multi-alloy 3D printing. FLOW-3D AM has helped us understand the evolution of thermal profiles and the associated mass transport and development of thermal stresses in complicated additively-built structures.
FLOW-3D 는 많은 응용 프로그램이 있는 강력한 도구입니다. 우리는 FLOW-3D를 사용하여 물 전환 구조의 흐름과 수력을 효과적으로 해결했습니다. 우리는 또한 제안된 물고기 통로를 통한 물 흐름을 모델링했습니다. 우리는 정확성, 계산 속도, 특히 사용자 친화적인 GUI에 깊은 인상을 받았습니다. 그리고 우리 고객들은 모델 출력과 포스트 프로세서에 의해 생성된 애니메이션에 깊은 인상을 받았습니다. 우리는 또한 매우 반응이 좋은 지원 직원에게 감사합니다.

FLOW-3D is a powerful tool with many applications. We used FLOW-3D to effectively resolve flow through and hydraulic forces on a water diversion structure. We also modeled water flow through a proposed fish passage. We have been impressed with the accuracy, computational speed, and especially the user friendly GUI. And, our clients have been impressed with the model output, as well as, animations created by the post-processer. We are also appreciative of the highly responsive support staff.
수년에 걸쳐 FLOW-3D는 기존의 유압 모델링 도구로는 해결하기 매우 어려웠을 복잡한 유압 문제를 해결하는 데 도움을 주었습니다. 우리는 FLOW-3D 팀에게 매우 감사합니다 . 그들은 수년에 걸쳐 지속적으로 소프트웨어를 개선해 왔으며 우리의 요구에 매우 신속하게 대응해 왔습니다.

Over the years, FLOW-3D has helped us solve complex hydraulic problems that would have otherwise been very difficult to solve with conventional hydraulic modeling tools. We are very thankful to the team at FLOW-3D. They have constantly been making the software better over the years, and have been very responsive to our needs.
FLOW-3D 는 당사의 우주 공학 연구 및 개발 프로세스에서 필수적인 도구입니다. FLOW-3D는 극저온 연료 역학의 프로세스를 더 잘 이해하여 질량을 줄이고 발사기 성능을 향상시키는데 도움이 됩니다.

FLOW-3D is an essential tool in our space engineering research & development process. FLOW-3D helps us better understand processes in cryogenic fuel dynamics, leading to savings in mass and improved launcher performance.
FLOW-3D CAST는 CASTMAN, Inc의 제품 개발 및 품질 확보에 매우 큰 도움을 주었습니다. FLOW-3D를 한국에 독점 공급하는 (주)에스티아이씨앤디의 수치해석 컨설팅팀과 협업을 통해 제품 개발 시 FLOW-3D 주조 시뮬레이션을 통해 기술적인 여러 어려움이 있는 제품 개발에 모두 성공하였습니다. 이는 개발 비용, 기술적인 어려움, 개발 기간 및 가장 중요한 시뮬레이션의 정확도가 포함됩니다. FLOW-3D CAST 의 강력한 시뮬레이션 기능은 가장 복잡한 작업에서 고품질 주조를 보장하는 데 도움이 되었습니다.

News

FLOW-3D 2026 European User Conference

FLOW-3D 2026 European User Conference

FLOW-3D 2026 European User Conference 6월 16일부터 17일까지 뒤셀도르프의 Steigenberger Icon Parkhotel에서 열리는 FLOW-3D 2026 European User Conference에 고객 여러분을 초대합니다. 주요 기업 및 기관의 동료 엔지니어, 연구원, 과학자들과 연결하여 ...
FLOW-3D WELD/AM

FLOW-3D WELD/AM 웨비나 안내

용접 및 3D프린팅에 특화된 수치해석 프로그램인 FLOW-3D WELD/AM의 새로운 기능을 소개해 드릴 웨비나를 개최합니다. 이번 웨비나에서는 익숙하지만 놓치고 있었던 FLOW-3D WELD/AM의 핵심 기능과 더욱 강력해진 최신 업데이트 내용을 집중적으로 다룹니다 ...

기술자료

레이저 용접 공정: 특성 및 유한요소법(FEM) 시뮬레이션

레이저 용접 공정: 특성 및 유한요소법(FEM) 시뮬레이션 Laser welding process: Characteristics and finite element method simulations 광전자 부품 패키징 분야에서 ...

자동차 경량화를 위한 다이캐스팅용 고강도 알루미늄 합금의 개발 및 특성 평가

다이캐스팅용 고강도 알루미늄 합금 (High Strength Aluminum Alloy for Die Casting) 최근 자동차 산업은 전 세계적인 환경 규제 강화와 연비 ...

다구치 분석을 이용한 고압 다이캐스팅 주조 결함 최소화 연구

Minimizing the casting defects in high-pressure die casting using Taguchi analysis 고압 다이캐스팅(HPDC)은 복잡한 형상의 비철금속 부품을 정밀하게 제조할 수 ...

Taguchi 기반 GRA를 이용한 EN353 합금강의 마찰 용접 공정 매개변수 다목적 최적화

Multi-Objective Optimization in Friction Welding Process Parameters on EN353 Alloy Steel using Taguchi based GRA 마찰 용접은 자동차 및 제조 ...

FEM을 이용한 오스테나이트계 및 듀플렉스 스테인리스강의 TIG 용접 변형 비교 분석

Comparative analysis of TIG welding distortions between Austenitic and Duplex Stainless Steels by FEM 본 보고서는 오스테나이트계와 듀플렉스 스테인리스강의 TIG ...
Fig. 6 Photographs of indentation for various weld current(Electrode force=4 kgf, weld time=5 ms)

가속도계를 이용한 마이크로스폿용접의 인프로세스 모니터링

가속도계를 이용한 마이크로스폿용접의 인프로세스 모니터링 In-Process Monitoring of Micro Resistance Spot Weld Quality using Accelerometer 본 연구는 IT 기기 및 ...
Fig. 10. Aspect of condensation and condensate thickness for c = 0.30 and δmin = 1.34 μm

마랑고니 응축 열전달

마랑고니 응축 열전달 Marangoni Condensation Heat Transfer 본 보고서는 이성분 증기 혼합물의 응축 과정에서 발생하는 표면장력 불안정성, 즉 마랑고니 효과가 ...
Figure 12: On-Curve plot of maximum and minimum points.

Taguchi 방법을 이용한 API X70M 소재의 M.A.G 용접 공정 변수 최적화 및 인장 강도 예측

Taguchi 방법을 이용한 API X70M 소재의 M.A.G 용접 공정 변수 최적화 및 인장 강도 예측 OPTIMISATION OF PROCESS PARAMETERS FOR ...
Figure 11. Optical microscope image of steel sample produced with a casting speed of 3.2 m/min.

고탄소 및 미크로 합금 DIN EN ISO 16120-2: 2011-C66D 강의 주조 속도 향상 연구

고탄소 및 미크로 합금 DIN EN ISO 16120-2: 2011-C66D 강의 주조 속도 향상 연구 Increasing Casting Speed in High Carbon ...
Fig. 2: Variations in Mach number along the axis of Bell nozzle for cold flow.

벨 노즐의 전산 해석

벨 노즐의 전산 해석 Computational Analysis of Bell Nozzles 본 보고서는 로켓 엔진에서 널리 사용되는 벨형 노즐의 설계 및 비설계 ...
Fig. 5. Microstructure of AlSi20 alloy unmodified (a), modified with P, Ti i B (b, c) poured without cooling (b) and with water mist cooling of casting die (a, c). Phase β (Si), lamellar eutectic α+β (Al+Si)

열처리된 금형 주조 AlSi20 합금의 조직

열처리된 금형 주조 AlSi20 합금의 조직 Structure of AlSi20 Alloy in Heat Treated Die Casting 본 연구는 다지점 수분 분무 ...
Fig.1 aluminum alloy motor

알루미늄 합금 모터의 저압 주조 기술

알루미늄 합금 모터의 저압 주조 기술 The Low-pressure Casting Technology of aluminum alloy motor 본 보고서는 공압 다이아프램 펌프용 알루미늄 ...
Figure 1. Circular pipes with various entrance sections.

열교환기 내 박리 유동의 열전달

열교환기 내 박리 유동의 열전달 Heat Transfer to Separation Flow in Heat Exchangers 본 보고서는 열교환기 설계 및 성능 향상에 ...
Fig. 5.15: Microstructures of as-supplied base metal, HAZ and fusion zone indicated as C in the Fig. 5.13.

스테인리스강의 레이저 빔 용접 기술 연구

스테인리스강의 레이저 빔 용접 기술 연구 Laser Beam Welding of Stainless Steels 본 연구는 자동차 산업에서 중요하게 다뤄지는 마르텐사이트계 및 ...
Figure 2. Appearance of the samples' surfaces exposed to the molten alloy after the ejection tests

알루미늄 합금 주조와 접촉하는 미처리, 질화 및 PVD 코팅된 열간 공구강의 마모 및 솔더링 성능

알루미늄 합금 주조와 접촉하는 미처리, 질화 및 PVD 코팅된 열간 공구강의 마모 및 솔더링 성능 Wear and Soldering Performance of ...
Fig 2 Weld microstructure

5A02 알루미늄 합금 판재의 MIG 용접 공정에 관한 연구

5A02 알루미늄 합금 판재의 MIG 용접 공정에 관한 연구 Research on the process in MIG welding of 5A02 aluminum alloy ...
Fig. 4: Downstream TKE contours on the x-z vertical plane for the rectangular trash rack: (a) experimental data of Koczula (2016) and (b) CFD model data with Darcy-Forchheimer porous media approach. 𝛼 = 30°, 𝑏 =20 mm, 𝑈0 = 0.5 m/s, 𝐹𝑟1 = 0.206.

취수구의 유속 및 난류 운동 에너지 예측을 위한 Darcy-Forchheimer 모델 연구

취수구의 유속 및 난류 운동 에너지 예측을 위한 Darcy-Forchheimer 모델 연구 Velocity and Turbulent Kinetic Energy Prediction with Darcy-Forchheimer Model ...
Fig. 1. Example of typical casting tree design with ‘diablo’ type setup

백금 주조에서 공정 매개변수의 역할

백금 주조에서 공정 매개변수의 역할 The Role of Process Parameters in Platinum Casting 본 보고서는 백금 주얼리 합금의 주조 특성을 ...
Fig. 2.3: 레이저 용접 키홀 원리 (맞대기 용접 구성)

레이저 용접 및 마찰 교반 용접을 이용한 Al-B4C 금속 기질 복합재의 접합

레이저 용접 및 마찰 교반 용접을 이용한 Al-B4C 금속 기질 복합재의 접합 Joining of Al-B4C Metal Matrix Composites by Laser ...
Figure 1. Mechanical fixture for welding the aluminum sheet coupons and laser welding.

6016 알루미늄 테일러 용접 블랭크의 강도 및 성형성 조사

6016 알루미늄 테일러 용접 블랭크의 강도 및 성형성 조사 Investigation of Strength and Formability of 6016 Aluminum Tailor Welded Blanks ...
Figure 2: 첫 번째 시뮬레이션에서 달성된 주물의 기공 결과 분석

AZ91D 마그네슘 합금 고압 다이캐스팅 주조 기술의 최적화

AZ91D 마그네슘 합금 고압 다이캐스팅 주조 기술의 최적화 OPTIMIZATION OF CASTING TECHNOLOGY OF THE PRESSURE DIE CAST AZ91D MG-BASED ALLOY ...
Obr. 13: Svarovací program s jedním impulsem [2]

선택된 용접 공정 파라미터 모니터링 및 점 용접 품질 분석

선택된 용접 공정 파라미터 모니터링 및 점 용접 품질 분석 Monitoring of selected welding process parameters and spot welds quality ...
Figure 7 Microstructure of casting specimens at different pouring temperatures

ZL205A 금속 금형 주조의 미세조직 상 분석 및 공정 최적화

ZL205A 금속 금형 주조의 미세조직 상 분석 및 공정 최적화 Microstructure Phase Analysis and Process Optimization of ZL205A Metal Mold ...
Figure 1. Characterization of sample 8: (a) DLEPR polarization curve and (b) microstructure of cladding (SEM examination).

오스테나이트 스테인리스강 클래딩의 부식 저항성에 미치는 플럭스 코어드 아크 용접 공정 변수의 영향

오스테나이트 스테인리스강 클래딩의 부식 저항성에 미치는 플럭스 코어드 아크 용접 공정 변수의 영향 Effect of Flux Cored arc Welding Process ...
Figure 3 Cross section morphology of the gray iron inserts and thickness of zinc coating: (a) zinc barrel plating for 1 hour; (b) zinc barrel plating for 2 hours; (c) zinc barrel plating for 3 hours; (d) zinc rack plating for 1 hour

고압 다이캐스팅 공정을 이용한 이종 금속 주조물의 주철-알루미늄 결합

고압 다이캐스팅 공정을 이용한 이종 금속 주조물의 주철-알루미늄 결합 Bonding of Cast Iron-Aluminum In Bimetallic Castings By High Pressure Die ...
Fig. 3 — X-ray radiography film of sample no. 4 & 9.

그레이-다구치 방법을 이용한 용가재 없는 듀플렉스 스테인리스강 TIG 용접 공정 파라미터 최적화

그레이-다구치 방법을 이용한 용가재 없는 듀플렉스 스테인리스강 TIG 용접 공정 파라미터 최적화 Optimization of process parameters of TIG welding of ...
Fig. 1 Reliability Plots of RSM Predicted Versus Observed Values of (a) Brinell Hardness Number, (b) Heat Input, (c) Cooling Rate, (d) Preheat Temperature, and (e) Amount of Diffusible Hydrogen.

반응 표면 분석법을 이용한 텅스텐 불활성 가스 용접 공정 변수의 최적화

반응 표면 분석법을 이용한 텅스텐 불활성 가스 용접 공정 변수의 최적화 Optimization of the Tungsten Inert Gas Process Parameters using ...
Fig. 4 Comparison of corrosion properties between 329LD and 316L for slurry pipes in regional power plants

산업설비용 2상 스테인리스강 개발 동향 및 용접성 기술 보고서

산업설비용 2상 스테인리스강 개발 동향 및 용접성 기술 보고서 Development Trends of Duplex Stainless Steels for the Process Industries and ...
Figure C10b: Microstructure of PM Al indicating the grain measurements (x400)

5754 알루미늄 합금과 C11000 구리 간의 이종 마찰 교반 용접 특성 분석

5754 알루미늄 합금과 C11000 구리 간의 이종 마찰 교반 용접 특성 분석 CHARACTERISATION OF DISSIMILAR FRICTION STIR WELDS BETWEEN 5754 ...
Figure 3. Mold shape and flow pass change.

금속 압력 제어 시스템을 이용한 사형 프레스 주조

금속 압력 제어 시스템을 이용한 사형 프레스 주조 Sand Mold Press Casting with Metal Pressure Control System 본 보고서는 사형 ...
Figure 2 Physical model of horizontal centrifugal casting

Al-Cu 합금의 원심 주조를 위한 미세조직 및 열간 균열 민감도 시뮬레이션과 매개변수 최적화

Al-Cu 합금의 원심 주조를 위한 미세조직 및 열간 균열 민감도 시뮬레이션과 매개변수 최적화 Microstructure and hot tearing sensitivity simulation and ...
Fig. 4(a) 1.6mm 직경와이어, 싱글 용접

후판 Al 5083 합금의 GMA 용접에서 보호가스 조성 및 용접변수에 따른 용접성 평가

후판 Al 5083 합금의 GMA 용접에서 보호가스 조성 및 용접변수에 따른 용접성 평가 Effects of Shielding Gas Compositions and Welding ...
Figure 1: Schematic of friction stir welding.

알루미늄 합금 마찰 교반 용접 겹치기 이음부의 기계적 특성 최적화

알루미늄 합금 마찰 교반 용접 겹치기 이음부의 기계적 특성 최적화 Mechanical Properties Optimization of Friction Stir Welded Lap Joints in ...
Fig. 3: First mode shape amplitude at pier locations of bridge system due to varying levels of stiffness loss as a result of scour at Pier 3 (60 m point).

직접 기초 다경간 교량의 모드 형상 기반 세굴 모니터링 기법에 대한 실험적 실증

직접 기초 다경간 교량의 모드 형상 기반 세굴 모니터링 기법에 대한 실험적 실증 Experimental demonstration of a mode shape-based scour ...
Figure 2,3 Illustration of furnace operation before and after upgrading

다이캐스팅 공장의 알루미늄 용해로에 대한 엑서지 분석 및 효율 평가

다이캐스팅 공장의 알루미늄 용해로에 대한 엑서지 분석 및 효율 평가 Exergy analysis and efficiency evaluation for an aluminium melting furnace ...
Figure 2. SEM analysis of physico- chemical soldering: (a) back scattered electron image (b) X-ray mapping of Al.

다이캐스팅의 미세 균열 및 금형 침식 분석

다이캐스팅의 미세 균열 및 금형 침식 분석 Analysis of Micro Cracks and Die Erosion in Die Casting 본 보고서는 고압 ...
Figure-9, Macrograph of the weld Joint

이종 강재 용접을 위한 GMAW 공정의 매개변수 최적화

이종 강재 용접을 위한 GMAW 공정의 매개변수 최적화 Parameter Optimizations of GMAW Process for Dissimilar Steels Welding 본 연구는 철도 ...
FIGURE 9. Optical images of the microstructure of AISI 1020 high manganese alloy.

SAW로 용접된 AISI 1020 합금 이음매의 인장 강도 및 피크 온도 최적화에 미치는 용접 매개변수의 영향

SAW로 용접된 AISI 1020 합금 이음매의 인장 강도 및 피크 온도 최적화에 미치는 용접 매개변수의 영향 Influence of Welding Parameters ...
Fig. 3. Casting pores in AlSi7Mg observed by metallography

X-선 컴퓨터 단층 촬영 및 금속 조직학을 이용한 주조 기공 특성 분석

X-선 컴퓨터 단층 촬영 및 금속 조직학을 이용한 주조 기공 특성 분석 CASTING PORE CHARACTERIZATION BY X-RAY COMPUTED TOMOGRAPHY AND ...
Fig. 6 Weld profiles under different welding current at welding speed of 300mm/min (a) 40mA; (b) 50mA; (c) 60mA

진공 롤 클래딩 공정에서 AISI P20 공구강의 온도 및 응력장에 미치는 전자빔 용접 매개변수의 영향

진공 롤 클래딩 공정에서 AISI P20 공구강의 온도 및 응력장에 미치는 전자빔 용접 매개변수의 영향 Effect of Electron Beam Welding ...
Figure 5. (a) Electron backscatter diffraction (EBSD) orientation map, (b) grain boundary misorientation angles, (c) {100}, {110} and {111} pole figures of the alloy in the heat-tread condition

열처리된 다이캐스트 Al-Mg-Si 기반 알루미늄 합금의 반복 변형 거동

열처리된 다이캐스트 Al-Mg-Si 기반 알루미늄 합금의 반복 변형 거동 Cyclic Deformation Behavior of A Heat-Treated Die-Cast Al-Mg-Si-Based Aluminum Alloy 본 ...
Figure 1 Examples for the assessment of the weld quality a) cross-section 1,0 b) cross-section 0,0 c) upper bead 1,0 d) upper bead 0,0

진공 상태에서의 구리 레이저 빔 용접을 통한 공정 한계 확장

진공 상태에서의 구리 레이저 빔 용접을 통한 공정 한계 확장 Laser beam welding of copper under vacuum to extend the ...
Fig. 3 Welding testing (a) Tensile test samples; (b) Rockwell hardness instrument

상용강의 인장 강도에 미치는 그루브 형상의 영향 연구

상용강의 인장 강도에 미치는 그루브 형상의 영향 연구 Investigation into the Impact of Groove Shape on the Tensile Strength of ...
/ GMAW, 강재, 용접, 용접 논문
Figure 2. Simples schematic of joint design

저탄소강 283 G.C의 인장 강도에 미치는 용접 공정 매개변수의 영향

저탄소강 283 G.C의 인장 강도에 미치는 용접 공정 매개변수의 영향 EFFECT OF WELDING PROCESS PARAMETERS ON TENSILE OF LOW CARBON ...
Fig. 5 Crack of ADC12 die casting.

ADC12 알루미늄 합금 다이캐스팅의 냉간 균열 판정 기준

ADC12 알루미늄 합금 다이캐스팅의 냉간 균열 판정 기준 Cold Crack Criterion for ADC12 Aluminum Alloy Die Casting 본 연구는 자동차 ...
용접 비드의 경도 측정 위치(HAZ 및 FZ) 모식도

저탄소강 상의 마르텐사이트계 스테인리스강 클레이딩을 위한 펄스 FCAW: 미세조직, 경도 및 잔류 응력 분석

저탄소강 상의 마르텐사이트계 스테인리스강 클레이딩을 위한 펄스 FCAW: 미세조직, 경도 및 잔류 응력 분석 Pulsed FCAW of Martensitic Stainless Clads ...
Figure 2. Final precipitate size and morphologies predicted from multiscale simulations elucidating the differences that can be expected in high temperature precipitate homogeneous and heterogeneous nucleation and growth in Al-Cu alloys. Reproduced with permission from Ref. [8].

기계적 특성을 위한 합금 설계: 길이 스케일의 정복

기계적 특성을 위한 합금 설계: 길이 스케일의 정복 Alloy Design for Mechanical Properties: Conquering the Length Scales 본 보고서는 원자 ...
Figure 1. SEM micrographs of (a) TiH2 and (b) Al particles.

TiH2 및 Al 분말 혼합물의 비수계 겔 캐스팅을 이용한 다공성 TiAl 합금 제조 연구

TiH2 및 Al 분말 혼합물의 비수계 겔 캐스팅을 이용한 다공성 TiAl 합금 제조 연구 Study on the Fabrication of Porous ...
Figure 8. Optical microscopy images of Source D. (a) oxide bifilm in between the dendrites (b) pores.

A356 알루미늄 합금 주조의 허용 품질 한계 결정: 공급업체 품질 지수(SQI)

A356 알루미늄 합금 주조의 허용 품질 한계 결정: 공급업체 품질 지수(SQI) Determination of Acceptable Quality Limit for Casting of A356 ...
Figure 3 (a) IPF map of BM, and (b) HAGBs and IQ map in BM

FSSWed TRIP 강재 접합부의 미세조직 및 기계적 특성에 미치는 온도, 변형률 및 변형률 속도의 영향에 관한 유한요소 및 실험적 연구

FSSWed TRIP 강재 접합부의 미세조직 및 기계적 특성에 미치는 온도, 변형률 및 변형률 속도의 영향에 관한 유한요소 및 실험적 연구 ...
 

전체 기술자료로 바로가기

Investigation of Mould Leakages in a Gravity Casting

Investigation of Mould Leakages in a Gravity Casting


This article was contributed by Gabriele Taricco of CM Taricco and Stefano Mascetti of XC Engineering.

Metal leakages in the original gravity casting mould

몰드 설계는 유체 역학과 금속 응고 패턴뿐만 아니라 주형 자체에서 발생할 수 있는 문제와 응력에 대한 반응을 고려해야 하는 매우 복잡한 작업입니다. 이탈리아에 본사를 둔 주형 제작 업체인 CMTaricco 사는 최근에 새로운 주형 중 하나의 하부에서 금속 누출 문제에 직면했습니다. 주형 누출의 원인은 처음에는 분명하지 않았으며 몇 번의 공정 주기 후에만 나타났습니다. 제작 일정에 차질이 생기고 부품 주조 비용이 급격히 증가하기 때문에 문제가 중요한 것은 분명했습니다.

Investigation of an idea

공정 자체는 주입과 오버플로우 설계인 중력 주조 방식이었기 때문에 유체 역학 부분에서는 문제가 발생할 수 없었습니다. GabrieleTaricco (CMTaricco의 소유주)의 가설은 금속 누출이 주형의 열 손실의 설계 불량에서 기인하여 균일하지 않은 분포를 초래한다는 것이었습니다. 변형률과 그에 따라 주형 바닥에서 크고 원하지 않는 변형이 순환하면서 금속이 유출될 수 있는 중요한 영역의 개방까지 주기적으로 시행되었습니다. 이를 확인하고 문제에 대한 신속한 해결책을 찾기 위해 FLOW-3D시뮬레이션을 실행하여 주형이 가열될 때 발생하는 현상을 정확하게 파악했습니다.

Schematic of a critical area where metal was flowing out of the mould


A careful setup, to achieve a fast resolution of the issue

문제의 원인은 신속하게 파악할 수 있어야 했기 때문에 최신 Flow-3D기능을 모두 활용하여 정확한 설정이 필요했습니다. 특히, 채택된 meshing기법은 전통적인 설정과 거의 동일한 정확도를 유지하면서 전산 셀의 수를 크게 줄이는데 매우 도움이 되었습니다. 빠른 시뮬레이션으로 주형 세척에 사용된 첫 번째 방법은 주형 내부의 얇은 캐비티를 직교 축과 정렬하기 위해 주형을 수직 축 주위로 회전시키는 것이었습니다.

Rotating the mould around the vertical axis in order to align the inner thin cavity of the mould


두 번째 트릭은 내부 공동 (얇은 벽)에 new conformal mesh기능을 사용하는 한편 전체 도메인에 대해 기존의 더 큰 메쉬 블록을 유지하는 것 이었습니다. The conformal mesh는 open volume과 일치하고, 작은 간극을 갖는 cavity로 제한됩니다.

A global view of the mould with cores and its alignment with the mesh blocks


마지막으로, 외부 공간을 주형에 제한하기 위해(현재 구두 상자 모양이 되고, 20도 회전하며, 모델 축과 정렬상태) 일부’ 도메인제거’ 요소가 사용되었습니다.즉, FLOW-3D의 내부 솔리드 모델을 통해 직접 연결됩니다

Domain removing components (yellow) were used to limit the space externally to the mould.


나머지 설정은 소프트웨어의 권장 기본값 대부분을 이용하여 기존 체계를 따랐습니다. 이러한 기능과 FLOW-3D의 새로운 하위 도메인 분해 기능 덕분에 설계된 9 000 000 셀을 유체 하위 도메인의 경우에만 1 840 000 셀로, 고체 서브 도메인의 경우 2 430 000 셀로 줄이는 것이 가능했습니다.


The analysis

주입 시뮬레이션 후, 양호한 주입 패턴을 보장하기 위해 시뮬레이션의 초점이 열 다이 사이클링 분석으로 리디렉션 되었습니다. 이 경우 설정은 일반 데스크 톱 컴퓨터에서 10개의 생산 사이클을 재현하는 데 1시간이면 간단하고 빠릅니다(i7930 K, 상업적 가치 1500달러). 그 결과 CM의 초기 가설이 확인되었습니다. FlowSight를 사용하여 단일 이미지에서 여러 시점과 횡단면에서 온도 필드를 관찰한 결과 온도가 d라는 것이 분명했습니다. 주형의 침입은 예상되는 변형과 금속 누출을 쉽게 유발할 수 있습니다.

Simulation of the mould’s temperature during the die cyclings


Further analysis with the Fluid-Structure Interaction module


일단 문제가 확인되고 기술 요원이 향상된 금형 설계를 시작하면 CM Taricco는 다이 상의 응력 및 변형에 대한 FEM 해석을 실행하는 최종 확인을 원했습니다. 이 분석을 수행하기 위해 XC Engineering Srl은 CM이 계산을 설정하고 수행하는 것을 도왔습니다. 분석의 결과는 정확히 CM이 생각하고 있는 것을 보여주었습니다. FLOW-3D는 붓기가 거의 걸리지 않은 금형에서 발견 된 실제 변형과 동일한 위치와 크기를 극도의 정확도로 재현 할 수 있었습니다. 이것은 CM에 대한 좋은 소식이었으며, 실제 주조 조건을 기반으로 실제 금형 변형을 예측하기 위해 설계 단계에서 FSI 모듈을 사용하는 추가 권장 사항을 시행했습니다.

Deformation of the mould during the die cyclings, simulated using the Fluid Structure Interaction model. Deformations are amplified x20.


Conclusion

해석결과, CM직원은 CFD솔루션의 온도영역에 대한 모든정보를 사용하여 최적화된 새로운 주형을 설계할 수 있었습니다. 새로운 주형은 열 에너지를 보다 효율적인 방법으로 방출할 수 있었으며 주조물은 수 십번의 공정 주기 후에도 금속 누출의 영향을 받지 않았습니다.

The cast part after mould optimization. No critical leak defects are present.


Hydrodynamic Screws

Hydrodynamic Screws


This material was contributed by Dr. Matthias Haselbauer of RMD Consult GmbH / Institute of Hydromechanics at the Technische Universität Munich


소규모 수력발전소의 사용은 에너지 비용증가를 억제하기 위한 방법으로 점점 더 흥미로워 지고 있습니다. 기존의 대형 수력발전소는 규제검토를 위해 막대한 자본투자와 긴 리드타임을 필요합니다. 더 작은 발전소는 새로운 유형의 터빈을 사용할 수 있습니다. 이러한 새로운 형태의 한 예는 아르키메데스의 나사 전달원리에 따른 유체역학 스크류를 나타냅니다.

출구 우측에서 고속 스플래시를 확인할 수 있습니다. 이는 과도한 소음의 원인이 됩니다. 유체역학적 스크류의 사용과 관련된 한가지 문제는 이송 나사에 비해 회전 방향의 변화로 인한 상당한 동반 소음 방출입니다. 환경 소음 규제 때문에 소음방출은 흔히 도시 지역의 발전소 건설에 결정적인 요소입니다.


Physical Modeling

유체역학적 스크류의 사용에 따른 소음의 발생과 원인을 조사하기 위해 München Technische Universität의 유체역학 연구소에서 실험테스트가 수행되었습니다. 규모가 큰 실험실에서, 물의 상류와 하류 사이의 물리적 흐름에 대한 상관관계, 방출, 회전속도, 소음수준 및 전기전위를 실험했습니다. 그 결과 다양한 소음원이 감지되었습니다. 또한 전달 나사와 유사한 표준 유체역학 나사 이외에도 4개의 추가 나사와 hutch types이 테스트되었습니다. 최고의 기하학적 변경은 장치의 효율에 어떠한 영향을 미치지 않으면서 10dB이상의 소음 감소를 제공했습니다.


CFD Simulation

실험실 테스트 외에도 FLOW-3D로 매우 복잡한 시뮬레이션을 여러 번 수행하였습니다. 회전하는 기하학적 구조의 3차원 모델링은 FLOW-3D와 사용되는 하드웨어에 큰 수요를 가져다 주었습니다. GMO(General Moving Object) 모델을 사용하면 사용자는 메쉬를 조정하지 않고도 터빈 또는 나사 같은 복잡한 이동 또는 회전 형상을 계산할 수 있으며, 따라서 메모리 할당에 변화가 없습니다. 말단 GMO모델은 유체의 고체 상호 작용을 계산하는 데 필요했으며, FLOW-3D의 TruVOF 알고리즘은 수면의 고도를 계산하는 데 필수적이었습니다.

Using a valve at the end of the screw (right) resulted in a more uniform velocity field at the outlet.


An additional bypass of some discharge through an opening at the hutch bottom reduces the noise emission significantly.


Integrating the pressure information (left) provided information about the efficiency effects resulting with the different geometric configurations.


Validating the CFD Results

시뮬레이션에서 4 개의 나사 및 hutch types에 대한 흐름을 계산하고 비교하였습니다. 이 결과로, 실험실에서 측정한 결과를 인증할 수 있었습니다. 또한, 속도 및 압력 필드에 대한 추가적인 데이터 처리를 통해 형상최적화를 할 수 있습니다. 앞서 언급한 하이브리드 모델은 CFD시뮬레이션과 실험실 테스트의 조합을 바탕으로 유체역학적 스크류의 소음배출은 10dB이상 감소했습니다. 이러한 소음 감소는 소규모 수력 발전소, 특히 도시지역에서 새롭게 활용할 수 있습니다.


Acknowledments

Visualization and post-processing of the simulation data was done by Franziska E. Hammerl of Ingenieurbüro EDR GmbH, who used FieldView by Intelligent Light.

Centrifugal Casting

Centrifugal Casting

원심 주조에서는 금형이 고속으로 회전하고 용해된 금속은 그 안으로 주입됩니다. 용해된 금속은 금형 내부에서 바깥쪽으로 방사되어 냉각되면서 응고됩니다. 중심 가속도와 관련된 더 높은 압력이 결함을 회전축 쪽으로 미는데, FLOW-3D CAST의 non-inertial reference frame model은 속도와 결함들의 위치를 수정할 수 있는 기능을 통해, 이러한 회전조건을 설정하여 매우 정확한 시뮬레이션 결과를 얻을 수 있습니다.


Centrifugal Casting Examples

강철 임펠러 원심 주조 공정의 부분 주입 시뮬레이션. 회전 속도는 250rpm으로 설정되었습니다.

FLOW-3D CAST는 임펠러 베인을 주조할 때 초기 응고 문제를 시뮬레이션하고 보여 주는 데 사용됩니다.


Centrifugal casting simulations, courtesy Metaltek.

High Pressure Die Casting

컴퓨텍스 2018에서 소개된 강력한 PC 하드웨어 소개

고성능 컴퓨팅(HPC)

고성능 컴퓨팅(HPC)는 과학, 공학 또는 거대한 비지니스 요구 사항들을 해결하기 위해 일반적인 데스크탑 컴퓨터나 워크스테이션보다 훨씬 더 높은 성능을 발휘하도록 컴퓨팅 파워를 결합하는 것을 의미합니다.
시뮬레이션이나 분석과 같은 HPC 워크로드는 계산, 메모리 사용 및 데이터 관리가 매우 중요합니다.
클러스터나 슈퍼컴퓨터라고도 불리는 일반적인 HPC 시스템은 고속의 네트워크에 연결된 다수의 서버를 이용한 확장을 통해 여러 애플리케이션들을 병렬 실행하도록 설계됩니다.
HPC 시스템에는 관련 소프트웨어, 도구, 구성요소, 스토리지 및 서비스가 포함된 경우가 많습니다.

고성능 컴퓨팅은 일반적으로

– 100Gbps의 초고속 네트워킹
– 확장 가능한 고성능 스토리지
– 고성능 컴퓨팅 소프트웨어 스텍 (최근에는 거의 Linux가 대세로 자리 잡음)
– 에너지 효율성
– GPU 가속지원

등이 핵심 성능지표로 개발됩니다.

HPC와는 스케일 규모면에서는 차이가 많지만 단일 컴퓨팅 기반에서 뛰어난 성능을 발휘하는 고성능 PC 하드웨어를 중심으로  전세계의 최신 컴퓨터 기술을 소개하는 컴퓨덱스에서 발표된 2018년  PC 기반 하드웨어 소개의 일부 기사를 소개합니다.

컴퓨텍스 2018에서 소개된 강력한 PC 하드웨어 소개

본 기사는 PCWorld 및 itworld에서 부분 발췌된 내용입니다.

컴퓨텍스 2018에서는 게이밍이 뜨겁다.
PC의 핵심 칩들이 크게 발전하면서 성능을 크게 높였다.

스레드리퍼(Threadripper) 2 인텔의 발표 직후, AMD는 32코어 64스레드 플래그십인 스레드리퍼 2를 소개하면서 코어 전쟁에 불을 붙였다. 새 24코어 CPU도 출시되며 새 칩들은 2세대 라이젠(Ryzen)과 같은 기본 기술에 기초하여 개발되었다. 또한 AMD는 쿨러 마스터와 협력하여 32코어의 온도를 관리할 수 있는 거대한 공냉식 쿨러인 레이스 리퍼(Wraith Ripper)를 제작했다.

AMD를 전격 채용한 에이서 헬리오스(Acer Helios) 500 컴퓨텍스에서 AMD의 기술이 예상치 못한 곳에서 공개되었다. AMD를 전격 채용한 이 모델에는 6코어 12스레드 라이젠 7 2700 데스크톱 프로세서뿐만이 아니라 라데온 베가(Radeon Vega) 56 그래픽이 탑재되어 있으며, 외장 베가 GPU가 탑재된 노트북은 이번이 처음이다. 에이서는 이 노트북에 144Hz 프리싱크 디스플레이를 매치하여 베가의 성능을 최대한 발휘할 수 있도록 했다.

MSI 노트북(치터(Cheater) 모드 적용) MSI는 컴퓨텍스에서 모든 가격 대의 노트북을 선보였다. MSI가 엔비디아 GTX 1050 그래픽을 내장한 프레스티지(Prestige) PS42가 있다. 매우 인상적일 것이며 기록을 달성할 수 있을지 기대된다. 보급형의 경우 MSI GF63은 999달러란 저렴한 가격에 6코어 8세대 인텔 코어 CPU와 GTX 1050이 내장되어 있다.

독특한 에이수스 노트북 에이수스는 컴퓨텍스에서 프로젝트 프리코그 외에도 혁신적인 하드웨어를 선보였다. 또한 기본적으로 트랙패드(Trackpad)를 상황에 따라 PC용 보조 화면으로 변신시키는 “스크린패드(ScreenPad)” 기술이 포함된 젠북 프로(ZenBook Pro) 15의 새로운 버전을 공개했다.

2017년 수치해석 분야에 기대되는 최신 컴퓨터 소식

수치해석을 하는 많은 분들은 대부분 시간과의 전쟁을 치루고 있습니다.
좀 더 빨리, 좀 더 상세한 결과를 얻어야 하기 때문에, 많은 분들이 예산이 허락하는 한 성능 좋은 컴퓨터를 확보하는 것이 최대의 목표가 되고 있습니다.

한 동안 AMD가 인텔의 경쟁자로 존재하면서 두 회사는 선의의 성능 경쟁을 치열하게 전개해 왔는데, AMD가 서서히 경쟁력을 잃고 있다가 최근에 젠 CPU를 통해 다시 경쟁에 불을 지피고 있습니다.
여기에 두 회사의 최신 주력 CPU 의 내용을 기사에서 인용하여 소개합니다.


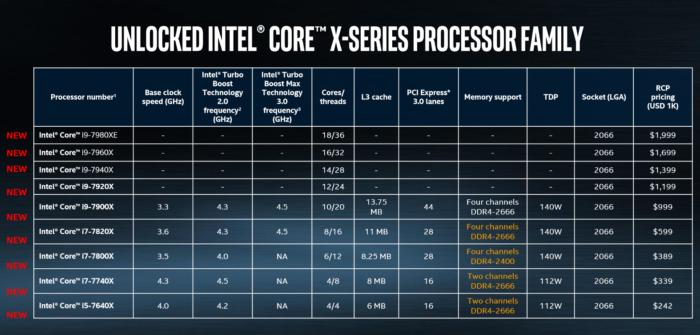
인텔, 18코어 36스레드 갖춘 코어 i9 칩 발표 “AMD 쓰레드리퍼와 전면전” (기사 출처 : itworld)

인텔이 코어 i9을 무기로 본격적인 AMD와의 전쟁에 돌입했다. 인텔은 30일 대만 컴퓨텍스에서 하이엔드 PC시장에서 AMD의 16코어 32스레드 스레드리퍼(Threadripper)와 경쟁할 18코어 36스레드의 ‘몬스터 마이크로프로세서’를 발표했다.

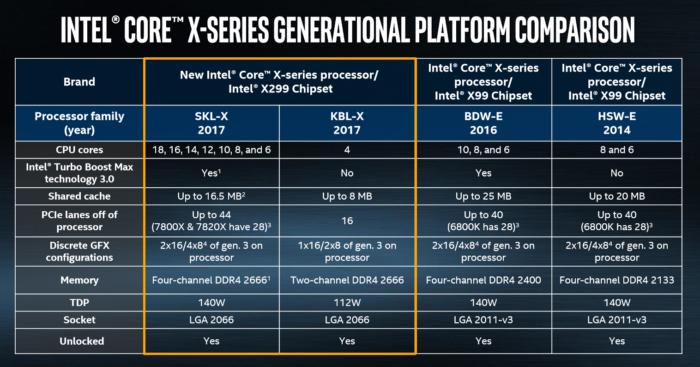
이 프로세서에는 코어 i9 익스트림 에디션 i9-7980XE라는 이름이 붙었다. 첫 번째 테라플롭(Teraflop) 데스크톱 PC프로세스로 아주 고가이다. 올해 말 출하되는 프로세서의 가격은 1,999달러이다. 한 단계 낮은 코어 i9 제품군 제품들은 가격이 조금 더 저렴하다. 10코어, 12코어, 14코어, 16코어로 구성된 코어 i9 X 시리즈 가격은 999~1,699달러 사이다. 모두 스카이레이크 기반 프로세스이며, 기존 브로드웰-E보다 높은 성능을 제공한다. 인텔에 따르면, 싱글스레드 앱은 15%, 멀티스레드는 10% 빠르다.

인텔은 ‘베이진 폴스(Basin Falls)”라는 코드 네임을 가진 코어 i9 X 시리즈가 너무 비싼 사람들을 위해 3종의 새로운 코어 i7 X 시리즈 칩(339~599달러)과 1종의 쿼드 코어 코어 i5(242달러)도 공개했다. 인텔은 몇 주 이내에 신제품 칩을 출하할 예정이라고 설명했다.

대부분의 코어 i9칩에 터보 부스트 맥스 기술 업데이트(Updated Turbo Boost Max Technology) 3.0이 탑재될 예정이다. 터보 부스트 맥스는 칩이 최고의 코어 2개를 파악하고, 필요할 때 가변적으로 속도를 높여 오버클러킹을 하는 기능이다. 옵테인 메모리도 지원한다. 인텔은 130개 이상의 옵테인 지원 메인보드가 출시될 예정이라고 설명했다.

신제품 165W, 140W, 112W 칩은 역시 새로운 소켓인 R4에 맞춰 설계되어 있다. 2,066핀 LGA 소켓과 호환되는 인텔 칩셋은 X299가 유일하다.

다시 한번, 인텔과 AMD가 제대로 한 판 붙을 전망이다. 둘 중 누가 승리할지 지켜보는 사용자들의 관심도 뜨겁다. 인텔은 코어 i9을 발표하면서 하이엔드 시장에 공격적으로 접근했다. AMD도 스레드리퍼의 10코어, 12코어, 14코어 버전과 가격을 공개할 수밖에 없는 실정이다. 인텔이 먼저 패를 공개했다. 게임은 이제부터가 시작이다.

인텔의 새 코어 i9 칩은 모든 PC관련 제품이 전시되는 종합 전시회로 발전한 컴퓨텍스에서 가장 중요한 발표 중 하나로 꼽혔다. 기대되는 소식은 아직 많이 남아있다. 홍보 담당자에 따르면, 인텔 경영진이 차세대 10nm 칩인 캐논 레이크에 대해 발표할 예정이라고 한다. 기존 케이비 레이크 칩보다 30% 높은 성능을 자랑하는 제품이다.

또, HTC 바이브 VR 헤드셋을 WiGig 기술을 이용해 무선 연결하는 기술에 대해 더 자세한 정보가 발표될 계획이다. 인텔과 HTC는 지난 1월 CES에서 파트너십 체결을 발표했다. 인텔은 또 8월부터 컴퓨트 카드(Compute Card)를 출시한다고 발표할 계획이다.

코어 i9의 속도와 피드
클록 속도가 4GHz를 넘으면서, 제조업체들이 직면한 도전 과제는 추가된 코어를 모두 사용하는 방법을 찾는 것이었다. 앞서 링크된 기사에서 설명했듯, 하나의 프로세스 코어만 집중적으로 사용하는 게임들이 여전히 많다. 인텔은 게임 플레이는 물론, 게임에 이용하지 않는 다른 코어로 트위치나 유튜브 스트리밍을 인코딩하고, 더 나아가 백그라운드에서 음악도 재생할 수 있는 새로운 세대의 ‘스트리머(Streamer)’로 눈길을 돌렸다. 인텔은 이런 동시다발 작업에 ‘메가태스킹’이라는 명칭을 붙였다. 이 회사는 이를 갈수록 증가하는 코어 수에 맞게 ‘수요’를 유지하는 아주 좋은 방법으로 판단하고 있다.

이와 관련, X시리즈 마케팅 매니저인 토니 베라는 “게이머가 콘텐츠 창작자로 변모하는 추세”라고 강조했다.

제품 가격은 자연스럽게 최고 2,000달러로 아주 비싸고, 경제력이 있거나 기업의 후원을 받는 사용자만 최신 코어 i9 제품들을 구입할 수 있을 전망이다. 다음은 제품 별 가격과 코어, 스레드 수를 정리한 내용이다.

Core i9-7980XE: 18코어/ 36스레드, 1,999달러
Core i9-7960X: 16코어/ 32스레드, 1,699달러
Core i9-7940X: 14코어/ 28스레드, 1,399달러
Core i9-7920X: 12코어/ 24스레드, 1,199달러
Core i9-7900X (3.3GHz): 10코어/ 20스레드, 999달러

인텔은 또 한정된 예산에 제약 받는 사용자를 대상으로 3종의 새로운 코어 i7 X 시리즈 칩을 판매할 계획이다.

Core i7 7820X (3.6GHZ), 8코어/ 16스레드, 599달러
Core i7-7800X (3.5GHz), 6코어/ 12스레드, 389달러
Core i7-7740X (4.3GHz), 4코어/ 8스레드, 339달러
케이비 레이크 코어에 맞춰 설계된 i7-7740X를 제외한 모든 칩이 인텔의 ‘스카이레이크-X’에 기반을 두고 있다.

새 칩에서 가장 큰 관심을 끄는 기능은 터보 부스트 맥스 기술 업데이트 3.0이다. 고든 마 웅이 인텔 브로드웰-E 리뷰에서 설명한 것처럼, 터보 부스트 맥스 기술 3.0은 (칩에 따라 차이가 있지만) 최고의 코어를 식별한다. 그리고 CPU 집약적 싱글 스레드 애플리케이션을 이 코어로 연결해 전체 성능을 향상한다.
또, 최고의 코어 2개를 식별하고, 가장 CPU 집약적인 스레드에 할당한다. 더 많은 코어를 더 효과적으로 활용하는 게임과 애플리케이션에 도움을 주는 기능이다. 그러나 이 새로운 기능을 탑재하지 않은 칩도 있다. 새 6코어, 2종의 4코어 X시리즈 칩이 여기에 포함된다.

다음은 속도와 피드를 요약 설명한 표다.

오버클럭이 포인트
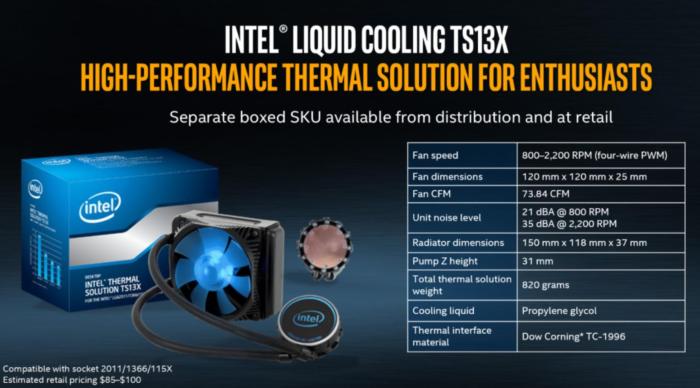
인텔은 새 X시리즈에 공냉 쿨러를 추천하지 않는다. 인텔은 165W와 140W의 새 칩이 방출할 열을 효과적으로 냉각시킬 수 있는 TS13X 쿨러를 판매할 예정이다.

TS13X는 PG(Propylene Glycol)을 이용, 열을 73.84-CFM 팬으로 보낸다. 이 팬의 소음은 21~35dBA이고, 회전 속도는 800~2,200rpm이다. 별도 판매될 TS13X의 가격은 85~100달러 사이이다.

인텔은 또 XTU(Extreme Tuning Utility)를 이용, 코어 당 오버클러킹과 전압 조절을 계속 지원할 계획이다. AVX 512 비율 오프셋, 메모리 전압 조절, PEG/DMI 오버클러킹 등 새 기능이 포함되어 있다.
또 ‘성능 튜닝 보증 서비스(Performance tuning protection plan)’를 제공할 계획이다. 이는 오버클로킹 사용자를 위한 일종의 ‘보험’이다. 칩이 고장 날 경우, 1회 교체를 해주는 보증 서비스이며, 두 번째부터는 유료로 진행된다.

데이터 전송 성능을 향상한 새 X299 칩셋
테라플롭급 연산력을 갖춘 PC의 경우, 다른 부품과의 데이터 전송 성능이 아주 중요하다. x299 칩셋은 최신 DMI 3.0을 도입해 SATA 3.0포트와 USB 포트 연결 대역폭을 2배로 증가시킨다. X299 칩셋에는 최대 8개의 SATA 3.0포트, 10개의 USB 3.0 포트가 장착되어 있다. 기존 X99 칩셋의 USB 3.0포트 수는 최대 6개였다.

브로드웰-E X99 칩셋은 8개의 PCIe 레인을 지원했었다. 그러나 X299은 최대 24개의 PCIe 3.0 레인을 지원한다. 고속 PCIe NVM3 드라이브 등 추가 PCIe를 CPU와 연결된 PCI3에 직접 연결할 수 있다. 코어가 10개 이상인 CPU의 경우, 최대 44개의 PCIe 3.0 레인을 이용할 수 있다.

X299는 속도가 빨라진 DDR4-2066을 지원한다. 그러나 어느 정도 RAM 용량을 지원하는지 확실하지 않다. 인텔은 캐시 계층(Cache Hierarchy)을 조정했다. 이를 통해 개별 프로세서 근처에 더 많은 캐시를 배치하는 방법보다 캐시 크기를 더 많이 줄일 수 있다. 인텔은 새로운 캐시의 ‘히트(Hit)’ 레이트가 더 높다고 설명한다. 칩 크기를 줄였지만 캐시 성능을 유지할 수 있었다는 의미이다.

이번 신제품 소식은 코어 i9, 코어 i7 X 시리즈 사용자 모두 크게 기뻐할 기능 및 성능 향상이다. 메인보드와 PC 제조사도 하이엔드 시장에서 수익을 증대하기 위해 코어 i9 제품들을 출시할 것으로 예상된다. 이번 주 컴퓨텍스에서 전해질 더 많은 소식에 사용자들의 관심이 쏠리고 있다. editor@itworld.co.kr


AMD 마이크로아키텍처 (기사 출처 : itworld)

AMD 라이젠 3월 2일 출시…코어 i7보다 가격도 성능도 “우세”

Mark Hachman | PCWorld

“40% 성능 향상”이라는 말은 보수적인 자체 평가였다. AMD는 첫 번째 라이젠 프로세서 3가지를 오는 3월 2일 출시할 계획이라고 밝혔다. 인텔 코어 제품군을 능가하는 성능으로 기대를 받고 있는 라이젠 프로세서는 가격도 절반 가까이 저렴하다.

22일 열린 라이젠 출시 행사에서 발표에 나선 AMD 임원들은 인텔 코어 i7을 공략하기 위한 세 가지 데스크톱용 CPU를 공개했다. 신형 라이젠 CPU는 여러 곳의 주요 메인보드 업체와 전문가용 맞춤형 PC 업체가 지원한다. 특히 AMD는 신형 라이젠 프로세서가 더 적은 비용으로 더 높은 성능을 제공한다는 점을 강조했다. 최고 성능 제품인 라이젠 7 1800X는 인텔의 1,000달러짜리 코어 i7-6900K의 절반에도 못 미치는 가격이지만, 성능은 더 뛰어나다.

인텔과 마찬가지로 AMD의 라이젠 프로세서 역시 역시 3가지 제품군으로 구성되어 있는데, 고급형 라이젠 7, 중급형 라이젠 5, 가장 저렴한 보급형 라이젠 3이 그것이다. AMD는 고성능 라이젠 7부터 먼저 출시하는데, 1800X(499달러), 1700X(399달러), 1700(329달러)의 세 가지 모델이다. 라이젠 5와 라이젠 3은 올해 하반기에 출시할 예정인데, 구체적인 출시 일정은 밝히지 않았다.

이번 행사 직전까지 공개되지 않은 라이젠 관련 정보는 가격과 정확한 출시일이었다. 애널리스트들은 AMD가 그간의 실책을 모두 개선한 것 같다고 평가했으며, 인텔은 자칫 기반이 되는 PC용 마이크로프로세서 시장의 점유율을 잃을 수 있는 위험에 처했다. 물론 인텔도 대응책은 있다. 가격 인하도 그중 하나일 가능성이 있고, 더 많은 코어를 가진 신제품이나 옵테인 기술을 적극 내세우는 것도 방법이 될 수 있다.

인텔이 지난 1월 케이비 레이크 칩 40가지를 대대적으로 출시한 것과는 달리 AMD는 서두르지 않고 있다. 이번에 출시된 라이젠 7 칩의 세부 사양을 살펴보자.

Mark Hachman

라이젠 7 1800X. 95와트 8코어 16쓰레드 프로세서로, 기본 클럭 속도는 3.6GHz, 부스트 모드에서는 4GHz로 동작한다. 499달러 1800X의 대응 제품은 8코어 인텔 코어 i7-6900K로 무려 1,089달러짜리이다. AMD에 따르면, 1800X는 시네벤치 상에서 단일 쓰레드 점수가 162로 동점을 기록했다. 하지만 코어를 모두 구동하자 1,601점으로 6900K보다 9% 높은 점수를 기록했다.

라이젠 7 1700X. 95와트 8코어 16쓰레드 프로세서로, 기본 클럭 속도는 3.4GHz, 부스트 모드에서는 3.8GHz로 동작한다. AMD에 따르면, 399달러 1700X는 시네벤치 멀티코어 벤치마크 테스트에서 1,537점을 기록해 6900K보다 4% 높은 성능을 보였다.

라이젠 7 1700. 655와트 8코어 16쓰레드 프로세서로, 기본 클럭 속도는 3GHz, 부스트 모드에서는 3.7GHz로 동작한다. AMD에 따르면, 1700은 시네벤치 멀티코어 테스트에서 1,410점으로 339달러짜리 코어 i7 7700K보다 46% 더 높은 성능을 기록했다. 핸드브레이크 비디오 인코딩 테스트에서는 1700은 61.8초를, 7700K는 71.8초를 기록했다.

Mark Hachman

AMD에 따르면 라이젠 7 1700은 신형 레이스 스파이어(Wraith Spire) 쿨러를 기본 쿨러로 제공해 소음이 32데시벨에 불과하다.

라이젠의 눈에 띄는 성능 향상에는 설계팀의 역할이 컸다. AMD는 자사의 목표 중 하나가 젠 아키텍처의 클럭당 명령어 처리수(IPC, instructions per clock)를 40% 늘리는 것이라고 밝힌 바 있다. 그리고 실제로 AMD는 IPC를 52% 향상했다. CEO 리사 수는 “단지 목표를 맞춘 것이 아니라 크게 초과 달성했다”라고 강조했다. editor@itworld.co.kr

코어 가스 / Core Gas

코어를 이용한 주조 모델링

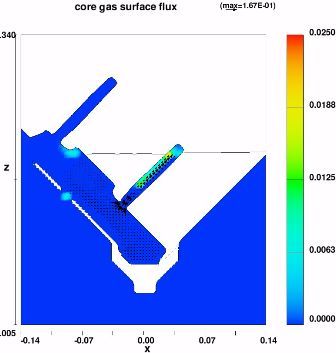
모래의 화학 결합제는 용해된 금속에 의해 가열될 때 가스를 생성할 수 있으며, 적절히 환기되지 않을 경우 가스가 금속으로 흘러 들어가 기체 다공성 결함을 초래할 수 있습니다. 이는 빠르게 가열되고 환기 경로가 긴 주물의 얇은 내부 특징을 형성하는 코어에서 가장 가능성이 높습니다. FLOW-3D의 핵심 가스 모델은 이러한 가스 결함 가능성을 예측하고 코어에서 모든 결합제 제품 가스를 안전하게 배출할 수 있는 코어 환기를 설계하는 데 도움이 됩니다.

알루미늄 및 철 주조의 결함 모델링

Core Gas 모델은 철 주물 (그림 1)과 알루미늄 주물 (그림 2) 모두에서 수지 결합 코어의 결함을 예측합니다. 충전 및 응고 모델과 동시에 작동하고 주조 충전 중 및 충전 후 바인더 가스 생성 및 흐름을 계산합니다.

코어 가스 시뮬레이션
그림 1 : 열린 플라스크 부분 V8 Al 블록 어셈블리 채우기. 두 개의 코어는 블록의 워터 재킷 공동을 형성합니다. 플라스크 바닥에 Al이 20 초 안에 채워집니다.
핵심 가스 모델
그림 2 : 환기가되지 않을 때 워터 재킷 코어는 충전 중에 금속에 가스를 불어 넣습니다 (그림 2b).

FAVOR™ vs. Body-Fitted Coordinates

본 자료는 국내 사용자들의 편의를 위해 원문 번역을 해서 제공하기 때문에 일부 오역이 있을 수 있어서 원문과 함께 수록합니다. 자료를 이용하실 때 참고하시기 바랍니다.

FAVOR™ vs. Body-Fitted Coordinates

The simplicity of the fractional area/volume method FAVOR™ for modeling complex geometric regions is very attractive. But, can it compete in terms of accuracy with deformed grids such as those employed by finite-element or body-fitted coordinate methods? A comparison between these methods shows that there are only small differences between the capabilities of the two approaches.

복잡한 기하 영역을 모델링하기 위해 면적/체적 점유율을 측정하는 FAVOR TM 법의 간결함은 매우 매력적입니다.  그러나 유한 요소법과 BFC (body-fitted coordinate : 물체 적합 좌표) 법에서 사용되는  변형 격자와 비교할 때 정확도면에서 경쟁 할 수 있을까요?  이러한 기술을 비교함으로써 이 두 가지 방법의 기능의 차이는 매우 적다는 것을 알 수 있습니다.

In the absence of solid boundaries there is little fundamental difference between grids of differently shaped control volumes. Some methods require users to store more information (e.g., node locations and various geometric factors) and some exhibit differing levels of accuracy depending on the amount of element distortion. In all cases, however, the underlying idea is a discrete approximation in which fluid forces and fluxes are computed for each element in the grid.

고체 경계가 존재하지 않는 경우, 형상이 다른 컨트롤 볼륨 격자 사이에는 근본적인 차이는 거의 없습니다.  어떤 방법이 더 많은 정보를 저장하도록 요구할 경우 (노드 위치, 다양한 기하학적 형상 요소 등)나 요소의 왜곡의 양에 따라 정확도 수준은 다를 수 있습니다.  그러나 어떤 경우에도 기초가 되는 개념은 격자의 각 요소마다 유체의 힘과 플럭스가 계산된 근사치입니다.

It is the issue of obstacle boundaries that is most often raised as an advantage of deformable grids because they can be constructed to fit the geometry. Two consequences come with this flexibility. One consequence is that these grids must be unstructured for general use. This is because structured grids can only undergo limited distortion before elements are turned inside out. The other consequence is that the distortion of an element makes it more difficult to construct accurate numerical approximations.

이것은 기하학적 형상에 적합하도록 구축 될 수있는 변형 가능한 격자의 장점으로 거론되는 가장 흔한 장애물 경계의 문제입니다.  이러한 유연성은 2 개의 결과가 포함됩니다.  하나는 이러한 격자는 범용으로 비구조이어야한다는 것입니다.  구조 격자의 경우 조금 왜곡을 더한 것만으로 요소가 뒤집어지기 때문입니다.  또 하나는 요소의 왜곡에 의해 정확한 수치 근사를 구축하는 것이 더욱 어려워 질 것입니다.

Structured FAVOR™ Grids vs. Unstructured Grids

The FAVOR™ concept can be used in connection with any type of grid including grids consisting of rectangular or distorted elements and whether the grid is structured or unstructured. Structured grids are best because they are easy to generate and the indices for neighboring elements are known. Rectangular grid elements make it easy to compute the fractional areas and volumes of elements used by the FAVOR™ method.

FAVOR TM의 개념은 사각형 요소와 왜곡 요소로 이루어진 격자를 포함하여, 또한 구조 격자 또는 비구조 격자 여부에 관계없이 모든 종류의 격자와 관련시켜 사용할 수 있습니다.  그 중에서도 구조 격자가 좋습니다.  구조 격자는 쉽게 생성 할 수 인접한 요소의 인덱스를 알고 있기 때문입니다.  직사각형의 격자 요소를 사용하면 FAVOR TM 법에서 사용되는 요소의 면적 점유율과 체적 점유율을 쉽게 계산할 수 있습니다.

The ease with which structured, rectangular grids can be generated makes this an obvious choice for the FAVOR™ method. However, the specification of open and closed grid regions implicit in the FAVOR™ method introduces a type of unstructured computing environment, because only those elements having a finite amount of open volume are actually computed. This results in a computation that is analogous to an unstructured grid computation.

직사각형 구조 격자를 쉽게 생성 할 수 있기 때문에 FAVOR TM 법에서는이를 선택하는 것이 당연하게되어 있습니다.  그러나 FAVOR TM 법에서는 열린 격자 공간과 닫힌 격자 영역의 지정을 잠재적하는 일종의 비구조 계산 환경입니다.  이것은 열린 체적의 크기가 유한한 요소만 실제로 계산되어 그 결과, 비 구조 격자의 계산과 비슷한 계산이 되기 때문입니다.

The analogy with a true unstructured grid is not perfect. For example, the FAVOR™ method requires storage for all elements whether they are blocked or not, while unstructured grids require storage of neighbor lists. Storing all elements is the price paid for automatically knowing which elements are neighbors. Of course, if heat conduction is to be computed in the solid regions surrounding a fluid, then blocked elements must be kept anyway.

진짜 비구조 격자와 유사하지만 완전하지 않습니다.  예를 들어, FAVOR TM 법은 차단되어 있는지 여부에 관계없이 모든 요소의 스토리지가 필요하지만, 비 구조 격자는 인접리스트의 스토리지가 필요합니다.  어떤 요소가 인접해 있는지를 자동으로 알 수 있는 대신 모든 요소를 저장해야 합니다.  물론, 유체를 둘러싼 고체 영역에서 열전도가 계산되는 경우 차단되는 요소는 어느쪽으로도 유지해야합니다.

One disadvantage associated with rectangular, structured grids is that they cannot be distorted to increase resolution in a localized region. Grid lines can be constructed closer together in a particular region for increased resolution, but these grid lines then extend across the entire grid. As a result, the number of elements in a grid may become large. Offsetting this disadvantage is the simplicity of grid generation. There is also the possibility of introducing multiple grid blocks joined at their boundaries to provide increased local resolution without a large increase in the number of grid cells.

직사각형 구조 격자와 관련된 단점 중 하나는 국소화된 영역에서 변형시켜 해상도를 올릴 수 없는 것입니다.  격자선은 특정 영역에서 해상도를 높이기 위해 세밀하게 만들 수 있지만, 이러한 격자는 그 격자 전체에 퍼집니다.  그 결과 하나의 격자 내의 요소의 수가 증가 할 수 있습니다.  이 단점을 상쇄하는 것이 격자 생성의 간단함입니다.  또한 경계에 결합된 복수의 격자 블록을 도입하여 격자 셀의 수를 크게 증가시키지 않고 국소적인 해상도를 올릴 가능성도 있습니다.

The FAVOR™ method is seen to have properties analogous to unstructured grids but without the overhead associated with the construction of unstructured body-fitted or finite-element grids. Since grid generation often requires a major investment of time and effort, the elimination of this task makes FAVOR™ a very desirable alternative.

FAVOR TM 법은 비 구조 격자와 유사한 특성을 가진 것으로 볼 수 있지만, 비 구조의 물체 적합 격자와 유한 요소 격자의 구축과 관련된 오버 헤드는 없습니다.  격자 생성에 시간과 노력을 많이 투자해야하는 경우가 많기 때문에이 작업이 불필요하게 됨으로써 FAVOR TM은 매우 바람직한 선택이 되고 있습니다.

FAVOR™ Elements vs. Body-Fitted Coordinate Elements

A second issue with deformed grids is that their deformation can be used to fit a bounding solid surface. This is accomplished by moving the nodes of elements closest to the surface onto the surface. In contrast, in the FAVOR™ method a surface is allowed to cut through an element and its location is recorded not by moving the edges of the element but in terms of the fractional face areas and fractional volume of the element that are not covered by the solid.

변형 격자의 두 번째 문제는 경계의 고체 표면에 대한 적합성에 변형을 사용할 수 있는 것입니다.  이것은 표면에 가장 가까운 요소 노드를 표면으로 이동함으로써 달성됩니다.  반대로 FAVOR TM 법에서는 표면에서 요소를 자를 수 있도록 허용되고 그 위치는 요소의 끝을 이동함으로써가 아니라 고체로 덮여 있지 않은 요소의 표면적 점유율 및 볼륨 점유율로 기록됩니다.

What we wish to show is that this fractional area/volume technique for defining solid boundaries has the same consequences for numerical approximation as does a deformed (i.e., body-fitted coordinates) grid technique.

우리가 보여주고 싶은 것은 경계를 정의하는 면적/체적 점유율 기법의 수치 근사의 결과가 변형 (BFC) 격자 기법과 동일한 결과를 가지고 있다는 것 입니다.

The most important point to recognize about the FAVOR™ method is that approximations of fluid-dynamic quantities are restricted to the open regions of elements. This restriction introduces fractional areas and volumes of elements as factors directly into the discrete approximations. For example, the flux of a quantity from one element to another has the fractional area of the fluxing boundary that is open to flow as a multiplier.

FAVOR ™ 법에 대해 이해하는 가장 중요한 점은 유체 역학의 유량의 근사치는 요소가 열려있는 영역에 한정되는 것입니다.  이 제한은 요소의 면적/체적 점유율은 인자로 분리된 사치에 직접 도입됩니다.  예를 들어, 요소 요소에 유량의 플럭스는 승수(multiplier)로 흐름에 대해 열려있는 플럭스 경계의 면적 점유율을 가지고 있습니다.

In this way FAVOR™ and body-fitted coordinates both compute fluxes across the faces of elements that employ the same areas. In FAVOR™ the areas are stored as fractions of the original element face areas. In a BFC method the areas are computed from the coordinates of the nodes defining the faces, and often times they are also stored so they don’t have to be recomputed.

이처럼 FAVOR TM과 BFC는 모두 동일한 면적을 사용하는 요소의 면을 통과하는 유량을 계산합니다.  FAVOR TM는 면적은 원래 요소 표면적의 비율로 저장됩니다.  BFC 법에서는 면적은 표면을 정의하는 노드의 좌표에서 계산됩니다.  많은 경우 저장도 되기 때문에 재 계산의 필요가 없습니다.

FAVOR method in FLOW-3D


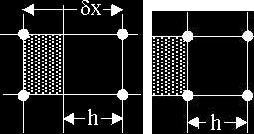
Figure 1: FAVOR™ blocked cell left (a) and BFC cell right (b). Solid region is shaded.

When constructing difference approximations in a grid of non-uniform elements it is necessary to know the effective element widths in different directions. A simple example is given in Fig. 1, which shows an element with a solid boundary. In this case the solid boundary is parallel with the vertical sides of the element. For a deformed element, Fig. 1b, the width of the cell would be h and this width would be used for computing differences in the horizontal direction.

불균일 요소 격자에서 차분 근사를 구축 할 때 다양한 방향의 유효 성분 폭을 알고 있어야 합니다.  간단한 예를 그림 1에 나타냅니다.  이것은 고체 경계를 가지는 요소를 보여줍니다.  이 경우 고체 경계 요소의 수직 측면과 평행하고 있습니다.  변형 된 요소 (그림 1b)에 대해 셀의 폭은 h되어,이 폭을 사용하여 가로 방향의 차이가 계산됩니다.

In FAVOR™ the width of the open portion of the cell is equal to the product of the open volume fraction and the original cell width. It is this product that is used in FAVOR™ for difference approximations in the horizontal direction and it is the same as the width of the deformed cell, h.

FAVOR TM에서 셀의 열 부분의 폭은 열린 체적 점유율과 원래의 셀 폭의 곱 같습니다.  이것은 수평방향에서의 근사 차이에 대한 FAVOR TM이 사용된 제품이며 이는 변형 된 셀의 폭 h와 같습니다.

When differences are computed in a vertical direction, for example, across the top of the element (i.e., parallel to the solid boundary in Fig. 1) the FAVOR™ method approximation involves a ratio of the fractional area at the top divided by the fractional volume. This ratio has a value of unity because the solid boundary blocks the same fraction of area horizontally as it does volume, which again makes the approximation similar to that of a BFC cell. Thus, there is no difference between the effective cell widths used in making difference approximations in FAVOR™ and body-fitted coordinate cells.

세로 방향, 예를 들어 요소의 표면과 교차 (그림 1의 고체 경계와 평행) 방향으로 차이를 계산하는 경우 FAVOR TM 법의 근사치는 윗면의 면적 점유율을 체적 점유율로 나눈 비율이 관계 합니다.  이 비율의 값은 1입니다.  이것은 고체 경계에 따라 부피와 마찬가지로 동일한 면적 점유율이 옆으로 차단되기 때문입니다.  따라서 여기서도 근사 BFC 셀과 비슷합니다.  이처럼 FAVOR TM 셀과 BFC 셀에서 차등 근사 할 때 사용하는 유효한 셀 폭에 차이는 없습니다.

FAVOR method in FLOW-3D for boundary-fitted coordinate systems


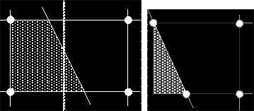
Figure 2: FAVOR™ cell left (a) and body-fitted coordinate cell right (b). Solid region is shaded.

If the solid surface is slanted as shown in Fig. 2, then the top and bottom face areas are different but are still known quantities in either case. Further, the average horizontal width of the open portion of the cell (h) is still the same because the volume fraction does not change when the solid surface is rotated about a midpoint within the cell (see dashed line). Here again there is little to distinguish between a FAVOR™ and a body-fitted coordinate cell.

그림 2와 같이 고체 표면이 경사져있는 경우에는 위 아래의 표면적은 다르지만 두 경우 모두 알려진 양입니다.  또한 셀의 열 부분의 가로 방향의 평균 폭 (h)도 마찬가지입니다.  이것은 셀의 중간 지점 (점선 참조)을 중심으로 단단한 표면을 회전해도, 체적 점유율은 변하지 않기 때문입니다.  여기서도 FAVOR TM 셀과 BFC 셀을 구별 할 수있는 것은 거의 없습니다.

Summary

It is well known that body-fitted coordinate grids can be difficult to construct, and there has been a huge effort devoted to the development of “automatic” grid generators. It is also well known that even with the best of grid generators it still takes a significant amount of time to establish a workable and well-behaved grid.

The simple rectangular construction of FAVOR™ grids makes them extremely easy to generate. Fractional areas and fractional volumes must be computed to define obstacles placed within a grid, but theses computations are well defined and easy to automate using simple algorithms.

Numerical accuracy is not sacrificed when selecting FAVOR™ over a body-fitted coordinate gridding method. The two approaches simply represent different ways to approximate bounding surfaces.

Finally, the numerical advantages inherent in the structured, smoothly varying, strictly orthogonal grids used by the FAVOR™ method should not be overlooked. These advantages, as well as the ability to automatically represent porous media (i.e., another example of a fractional area/volume region) are additional reasons why the FAVOR™ method was selected as the basis of FLOW-3D.

BFC 격자의 구축이 어려운 것은 잘 알려져 있으며 “자동”격자 생성 기능의 개발에 많은 노력을 쏟고 있습니다.  또한 최고 수준의 격자 생성 기능을 사용하더라도 유효하고 적절한 기능을 수행 격자를 조합하려면 상당한 시간이 걸릴 수 있다는 것이 잘 알려져 있습니다.

FAVOR TM 격자는 간단한 직사각형 구조이기 때문에 매우 쉽게 생성 할 수 있습니다.  격자에 배치 장애물을 정의하는 면적 점유율과 체적 점유율을 계산해야 하지만, 이러한 계산은 잘 정의되어 있으며, 간단한 알고리즘을 사용하여 쉽게 자동화 할 수 있습니다.

격자 생성 기법으로 BFC 대신 FAVOR TM을 선택하여 수치적 정확성이 희생되는 것은 아닙니다.  이 두 가지 방법은 경계 표면의 근사 방법이 다를 뿐입니다.

마지막으로, FAVOR TM 법에서 사용되는 구조화 된 변동이 부드럽고 엄격한 직교 격자 고유의 수많은 장점은 간과해서는 안됩니다.  이러한 장점과 다공성 매체 (면적 / 체적 점유율 영역의 또 다른 예)를 자동으로 표현하는 기능은 FAVOR TM 법이 FLOW-3D의 기초로 뽑힌 또 하나의 이유입니다.

완화와 수렴 조건

본 자료는 국내 사용자들의 편의를 위해 원문 번역을 해서 제공하기 때문에 일부 오역이 있을 수 있어서 원문과 함께 수록합니다. 자료를 이용하실 때 참고하시기 바랍니다.

Relaxation and Convergence Criteria

Numerical methods used to solve the equations for fluid flow and heat transfer most often employ one or more iteration procedures. By their nature, iterative solution methods require a convergence criteria that is used to decide when the iterations can be terminated.

유체 흐름 및 열전달 방정식을 풀기 위해 사용하는 수치 법은 하나 이상의 반복적 인 방법이 채용되고 있습니다.  특성상 반복 해법은 언제 반복을 중지 할 수 있는지를 결정하는 수렴 조건이 필요합니다.

In many cases, iteration methods are supplemented with relaxation techniques. For example, over-relaxation is often used to accelerate the convergence of pressure-velocity iteration methods, which are needed to satisfy an incompressible flow condition. Under-relaxation is sometimes used to achieve numerically stable results when all the flow equations are implicitly coupled together.

종종 반복적인 방법은 완화 법으로 보완됩니다.  예를 들어,과 완화는 압력 – 속도 반복 방법의 융합을 가속화하는 데 사용되는 경우가 많으며, 이것은 비압축성 흐름 조건을 충족해야합니다.  부족 완화는 모든 흐름 방정식이 음으로 결합되어있을 때, 수치적으로 안정된 결과를 얻기 위해 가끔 사용됩니다.

Choosing Relaxation Criteria

The amount of over or under-relaxation used can be critical. Too much leads to numerical instabilities, while too little slows down convergence. Similarly, a poorly chosen convergence criteria can lead to either poor results (when too loose) or excessive computational times (when too tight).

사용하는 over or under-relaxation의 양이 중요 할 수 있습니다.  너무 많으면 수치적으로 불안정 해지고 너무 작으면 수렴 속도가 느려집니다.  마찬가지로 수렴 조건을 잘못 선택하면 결과의 질이 나빠지거나 (너무 느슨한 경우) 계산 시간이 너무 길어 지거나 (너무 엄격 경우) 할 수 있습니다.

Selecting proper relaxation and convergence criteria can be a difficult and frustrating experience for users of computational fluid dynamics software. The criteria depend on the specifics of the problem being solved, which may change during the evolution of a problem. Unfortunately, there are no universal guidelines for selecting criteria because they depend not only on the physical processes being approximated, but also on the details of the numerical formulation. Many CFD programs have a standard set of recommended criteria, but users must often resort to trial-and-error adjustments to get good results.

적절한 완화 조건 및 수렴 조건을 선택하는 것은 전산 유체 역학 (CFD) 소프트웨어의 사용자에게 어렵고 초조한 작업이 될 수 있습니다.  조건은 해결되는 문제의 특성에 따라 다르지만, 이러한 특성은 문제가 발전하는 과정에서 변경 될 수 있습니다.  불행히도 조건을 선택할 때의 일반적인 지침은 없습니다.  근사되는 물리적 과정뿐만 아니라 수치 공식 상세도 관련되기 때문입니다.  많은 CFD 프로그램에 권장되는 조건의 표준 세트가 포함되어 있지만, 많은 경우 좋은 결과를 얻기 위해서는 시행 착오에 의한 조정을 할 필요가 있습니다.

Dynamic Selection of Criteria

FLOW-3D users are exempt from these difficulties because all relaxation and convergence criteria are selected by the program itself. Further, all selections are adjusted dynamically by the program to follow the development of the solution. Of course, users can always override the automatically selected criteria for special cases. One such case would be the use of a very large convergence criteria and no over-relaxation as a way to reach steady-state conditions with less CPU time.

FLOW-3D를 사용하면 완화 및 수렴 조건이 모두 프로그램 자체에 의해 선택되기 때문에 이런 고생은 필요하지 않습니다.  또한, 모든 선택이 솔루션의 발전에 따라 프로그램에 의해 동적으로 조정됩니다.  물론 특수한 경우에는 자동으로 선택된 조건을 사용자가 언제든지 무시할 수 있습니다.  이러한 경우는 예를 들어, 매우 큰 수렴 조건을 사용하여 오버 완화를 사용하지 않고 적은 CPU 시간에서 정상 상태에 도달하기위한 경우 등입니다.

휴리스틱 분석

Heuristic Analysis

Finite-difference equations may have rapidly growing and oscillating solutions that in no way resemble the solutions expected from the partial differential equations they are meant to approximate. Such solutions are said to exhibit computational instability. Clearly, it is desirable to avoid these numerical disasters. For linear difference equations with constant coefficients, computational stability can be determined using a Fourier method pioneered by von Neumann (see the article in this series “Computational Stability.” Unfortunately, most equations of physical interest are either nonlinear, or have non-constant coefficients, or both.

유한 차분 방정식의 계산 결과에서 본래 근사하는 편미분 방정식에서 예상되는 것과 크게 다르게 급속하게 증가하고 부호가 자주 반전하는 솔루션을 얻을 수 있습니다.  이러한 솔루션이 나타내는 행동을 “계산 불안정성”라고합니다.  물론 이러한 해석은 바람직하지 않습니다.  상수 계수를 따른 선형 차분 방정식의 계산 안정성을 확인하는 방법으로는 von Neumann 의한 푸리에 방법을 사용할 수 있습니다 (본 시리즈 “계산 안정성” 참조).  불행히도, 물리 현상을 나타내는 대부분의 방정식은 비선형이거나 비 상수 계수를 수반하거나 또는 둘 다입니다.

Heuristic Analysis Methods

In this article a simple heuristic analysis method is described for investigating the computational stability of such finite-difference equations. An important by-product of this type of analysis is that it often suggests simple ways to eliminate the instabilities and at the same time increase the accuracy of the approximations.

이 책에서는 위의 유한 차분 방정식의 계산 안정성을 조사하기위한 간단한 휴리스틱 분석 방법에 대해 설명합니다.  이 유형의 분석은 많은 경우에 불안정을 제거하는 방법을 보여뿐만 아니라 근사치의 정확도를 높이는 방법도 보여주는 뛰어난 특징이 있습니다.

The approach described here is called “heuristic” because it is not rigorous or complete, but it often works and can provide a great deal of useful information. Reference [1] is the original publication describing the heuristic stability method from which much of this article has been taken.

여기서 설명하는 방법은 엄격하지도 완전하지도 않은 것으로부터 “추론”이라고되어 있지만, 많은 경우에 유효하고 유용한 정보를 많이 제공합니다.  안정성을 분석하기위한 휴리스틱 기법에 대해 작성된 참고 문헌 [1]은이 책에서 다루고 많은 정보 출처 소스입니다.

Heuristic analysis is based on the rather simple idea of reducing a finite-difference equation back to a partial differential equation by expanding each of its terms in a Taylor series and keeping only terms to a certain order in the expansion. This expansion is in powers of the space and time increments, which are assumed to be small to begin with.

휴리스틱 분석은 유한 차분 방정식을 전개하고 각항을 테일러 급수로 나타내 특정 차수까지의 항만을 남김으로 편미분 방정식에 귀착시키는 비교적 간단한 개념을 기반으로합니다.  이 확장은 처음에는 작은 것으로 예상되는 공간 증가 및 시간 증분의 거듭 제곱으로 표시됩니다.

Certainly such an expansion must, to lowest order, reproduce the original partial differential equation, otherwise, it would not be a good approximation. Oftentimes this requirement is referred to as the “consistency” of the approximation. Terms beyond the lowest order in the expansion are referred to as truncation errors.

이러한 확장은 원래의 미분 방정식을 최소 차수까지 재현하는 것이 필수적입니다.  그렇지 않으면 좋은 근사치를 얻을 수 없습니다.  이 요구 사항은 종종 근사치의 ‘일치 성’이라고 합니다.  전개 된 최소 차수 다음은 절단 오류라고합니다.

The basic concept of a heuristic analysis is that the Taylor-expanded equation is a more accurate representation of the difference equation than the original partial differential equation. Even keeping only a few truncation error terms should result in a partial differential equation that is more closely related to the difference equation. With this in mind, the following discussion will show that an examination of the truncated equation can sometimes reveal properties shared with the difference equation such as stability problems, necessary initial conditions and/or serious inaccuracies.

휴리스틱 분석은 테일러 전개 방정식 쪽이 원래 편미분 방정식보다 차분 방정식을보다 정밀하게 나타내고 있다는 기본 개념을 기반으로합니다.  절단 오차 부분을 일부 남긴 경우에도 항은 차분 방정식에 가까운 편미분 방정식입니다.  이 점을 염두에 두면서 여기에서 계산을 중단 한 식을 조사함으로써 안정성 문제 필요한 초기 조건 심각한 부정확성 등 차등 방정식과 일반적인 특성이 밝혀 질 것을 보여 있습니다.

To begin, we consider the same linear partial differential equation that was discussed in the first article on stability: Computational Stability.

첫째, 안정성에 쓰여진 ” 계산 안정성”에서 사용한 것과 동일한 선형 편미분 방정식 생각합니다.

Linear Equation Example

The equation for one-dimensional advection-diffusion of a variable u(x,t) is

여기에서는 변수 u (x, t)의 1 차의 이류 확산 방정식을 이용합니다.

(1)     \displaystyle \frac{\partial u}{\partial t}+c\frac{\partial u}{\partial x}=\nu \frac{{{\partial }^{2}}u}{\partial {{x}^{2}}}.

The convection velocity c and the diffusion coefficient ν are assumed to be constants. Solutions of this equation are known to be bounded and otherwise well-behaved.

대류 속도 c와 확산 계수 ν은 상수로 간주합니다.  이 방정식의 해는 경계이며, 양호한 거동을 나타내는 것을 알 수 있습니다.

What will be shown here is that the stability of a simple finite-difference approximation to Eq. 1 can be determined from an examination of the truncations errors resulting from a Taylor series expansion of a the difference equation. Not only does this process reveal that there are two basic types of instability, but we shall be able to make a direct comparison between the heuristic method and the von Neumann type of Fourier analysis carried out in Computational Stability. This comparison provides a useful rule-of-thumb for which truncation error terms to keep and which to eliminate from the Taylor expansion in order to evaluate the difference equation’s stability.

여기에서는 차분 방정식의 테일러 급수 전개로 인한 절단 오차를 조사하는 것으로, 식 1에 대한 간단한 유한 차분 근사의 안정성을 판단 할 수있는 것을 나타냅니다.  이 프로세스는 불안정성은 기본적으로 두 가지 유형이 있다는 것을 밝혀 질뿐만 아니라 휴리스틱 기법과 “계산 안정성”에서 이용한 von Neumann 유형의 푸리에 분석을 직접 비교할 수 있게 되는 것 있습니다.  이러한 비교를 통해 차이 방정식의 안정성을 평가하는데 테일러 전개로 인한 절단 오차 중 유지해야 할 항목과 배제 할 부분을 결정하는 데 유용한 경험규칙을 얻을 수 있습니다.

The simple, explicit finite-difference equation approximating Eq. 1 discussed in Computational Stability is

다음 수식은 “계산 안정성”에서 설명한 식 1을 근사하는 간결하고 양적인 유한 차분 방정식입니다.

(2)     \displaystyle \frac{u_{j}^{n+1}-u_{j}^{n}}{\delta t}=-\frac{c}{2\delta x}\left( u_{j+1}^{n}-u_{j-1}^{n} \right)+\frac{\nu }{\delta {{x}^{2}}}\left( u_{j+1}^{n}-2u_{j}^{n}+u_{j-1}^{n} \right)

where, e.g., ujn denotes u(jδx,nδt). This is called a forward-in-time approximation that allows all j location values to be computed at time step n+1, provided all the j values at step n are known. In other words, the difference equation requires one initial condition to start things off, just as the original partial differential equation also requires a single initial condition because it only involves a single time derivative.

여기서, u j n은 u (jδx, nδt)을 나타냅니다.  이것은 시간의 전진 차분 근사라는 것으로, 시간 단계 n의 공간 내의 위치 j 값이 모두 알려진이면 단계 n + 1의 모든 j 값을 계산할 수 있습니다.  즉, 원래의 미분 방정식에서 1 개의 초기 조건이 필요할뿐만 아니라 하나의 시간 미분만을 포함하기 때문에 차분 방정식에서 계산을 시작함에있어서 초기 조건이 하나 필요합니다.

It may be observed that difference equation, Eq. 2, has the property that each space and time location (jδx,nδt) will affect points at time step n+1 at locations j-1, j and j+1. That is, point (jδx,nδt) has a region of influence at later time bounded by lines having slopes ±δx/δt in x-t space. These are similar to characteristic lines along which signals can propagate. For example, the original equation, Eq. 1, has a characteristic line with slope c along which a disturbance advects. In the discrete equation, however, the characteristic lines are not physical characteristics but computational ones defining the region where the difference equation changes data values resulting from a change in value at a particular point.

차분 방정식 2는 공간 위치 및 시간 위치 (jδx, nδt)마다 타임 단계 n + 1의 위치 j-1, j, j + 1의 각 점에 영향을주는 특성을 볼 수 있습니다.  즉, 점 (jδx, nδt)는 현재보다 먼저있는 시간에서, xt 공간에서 기울기 ± δx / δt를 가진 선이 경계가되는 영향 영역을 가지고 있습니다.  이것은 신호의 전달을 나타내는 특성 곡선과 비슷합니다.  예를 들어, 원래 식 1은 교란의 이류를 나타내는 기울기 c의 특성 선을 가지고 있습니다.  그러나 이산 방정식의 특성 선은 물리적 특성을 나타내는 것이 아니라 특정 시점의 값의 변화에 따라 차이 방정식의 데이터 값이 변화하는 영역을 정의하는 계산의 특성을 나타냅니다.

We saw in the Computational Stability article that a Fourier series technique could be used to determine a set of three stability conditions for the difference equation, Eq.2. Here we shall see what can be learned from looking at the truncation errors associated with the approximating equation, Eq. 2.

” 계산 안정성”에서는 푸리에 급수에 의한 방법을 이용하여 차등 방정식 2에 대한 3 개의 안정 조건을 이끌어 낼 것을 알 수있었습니다.  이 책에서는 근사 식 2에 관련된 중단 오차를 조사함으로써 얻은 정보에 대해 설명합니다.

Truncation Error Evaluation

Assume that each term in Eq. 2 is a continuous and differentiable function of x and t. Then, for example, “uj+1,n would be u(xj+δx,tn) and can be expanded about the point (xj,tn) in a Taylor series in powers of δx. Carrying out the expansion in δx and δt for all the terms in Eq.2 yields,

식 2 절은 x 및 t의 연속 미분 가능한 함수로 간주합니다.  그러면 예를 들어, u j + 1, n, n은 u (x j + δx, t n)이되고, 점 (x j, t n)의 주위에 δx의 거듭 제곱에서 테일러 급수 전개를 할 수 있습니다.  식 2의 모든 사항에 대해 δx 및 δt로 확장하면 다음 식을 얻습니다.

(3)     \displaystyle \frac{\partial u}{\partial t}+c\frac{\partial u}{\partial x}-\nu \frac{{{\partial }^{2}}u}{\partial {{x}^{2}}}=-\frac{1}{2}\delta t\frac{{{\partial }^{2}}u}{\partial {{t}^{2}}}+O\left( \delta {{x}^{2}},\delta {{t}^{2}} \right).

All second and higher order terms in δx and δt have been lumped into the order symbol O(δx2 ,δt2). This is a consistent approximation because it reduces to the original partial differential equation, Eq. 1, when δx and δt tend to zero.

2 차 이상의 δx 및 δt 절은 주문 기호를 사용하여 O (δx 2, δt 2)라고 기술되어 있습니다.  δx 및 δt가 제로에 접근 할 때, 원래의 편미분 방정식 1로 귀착하기 때문에 이것은 일관성 있는 근사치라고 할 수 있습니다.

Comparison of Fourier and Truncation Error Analysis

In the article Computational Stability a typical Fourier mode of the form

“계산 안정성”에서는 다음과 같은 형식의 전형적인 푸리에 모드

\displaystyle P_{j}^{n}\propto {{r}^{n}}{{e}^{{ikxj}}}

was substituted into the difference equation, Eq.2, to obtain an equation for r,

이를 차등 방정식 2에 대입하면 r을 구하는 식을 얻었습니다.

(4)     \displaystyle r=1-\left( \frac{ic\delta t}{\delta x} \right)\sin \left( k\delta x \right)-\left( \frac{2\nu \delta t}{\delta {{x}^{2}}} \right)\left[ 1-\cos \left( k\delta x \right) \right].

Computational stability of the difference equation requires that the magnitude of r remain less than or equal to 1.0.

차분 방정식의 계산 안정성을 실현하려면 r의 절대 값을 1.0 이하로하는 것이 필요합니다.

If we insert a Fourier mode of the form exp(i(kx+wt)) into the truncated Eq. 3, it will be seen that the result is the same as Eq. 4 with r=exp(iwδt) and then expanded in powers of wδt, plus the sine and cosine expanded in powers of kδx. This confirms that the two results are the same, as they should be to O(δx2,δt2) retained in Eq. 3.

exp (i (kx + wt)) 형식의 푸리에 모드를 계산을 중단 한 식 3에 대입하면 r = exp (iwδt)되고, wδt의 거듭 제곱에서 전개되고 더 sin과 cos는 kδx의 거듭 제곱 전개되고 식 4와 같은 결과를 얻을 수 있는 것을 알 수 있습니다.  식 3에서 개최 된 O (δx 2, δt 2)와 같이 두 결과는 동일하다고 확정됩니다.

However, the comparison also indicates that to keep the basic form of r in Eq. 4, with its real and imaginary parts, we must keep at least the first non-zero terms from the sine and cosine when they are expanded in powers of kδx. The first non-zero term in the imaginary contribution to r comes from sin(kδx) and is proportion to kδx, which corresponds to the first derivative with respect to x in Eq.3. The first non-zero term in the real part of r (other than 1) comes from cos(kδx) and is proportional to (kδx)2, which corresponds to the second derivative with respect to x in Eq. 3.

그러나 이 비교에서는 식 4의 실수 부와 허수 부로 구성된 r의 기본 형식을 유지하려면 kδx의 제곱으로 전개 된 때 적어도 sin과 cos의 첫 번째 non-zero 항을 유지 해야한다고 표시됩니다.  r의 허수 부분의 첫 번째 non-zero 항은 sin (kδx)로부터 유도 된 것으로, kδx에 비례합니다.  이것은 식 3의 x에 대한 1 차 도함수에 대응합니다.  r의 실수 부 최초의 non-zero 항 (1 제외)은 cos (kδx)로부터 유도 된 것으로, (kδx) 2에 비례합니다.  이것은 식 3의 x에 관한 2 차 도함수에 대응합니다.

These observations lead to the rule-of-thumb that for the truncated equation to reproduce the lowest order real and imaginary parts of the amplification factor r, it is necessary to retain the lowest order even and odd derivatives with respect to each independent variable in the truncation error. In Eq. 3 there is only one first order term proportional to δt and it is a second derivative with respect to t. There are no first order terms proportional to δx.

이러한 점에서 계산을 끊은 식으로 진폭 계수 r의 최소 차수의 실수 부와 허수 부를 재현하려면 중단 오차에서 각 독립 변수에 대해 최소 차수의 짝수와 홀수 함수 (도함수) 을 유지해야한다는 경험식을 지도합니다.  식 3에서 δt에 비례하는 1 차 항은 하나만에서 t에 대한 2 차 도함수입니다.  δx에 비례하는 1 차 항은 없습니다.

Examining the Truncated Equation for Stability

Using the above rule-of-thumb, the truncated equation is,

위의 경험식을 사용하면 계산을 중단 한 식은 다음과 같이됩니다.

(5)     \displaystyle \frac{\delta t}{2}\frac{{{\partial }^{2}}u}{\partial {{t}^{2}}}+\frac{\partial u}{\partial t}+c\frac{\partial u}{\partial x}-\nu \frac{{{\partial }^{2}}u}{\partial {{x}^{2}}}=0

The first important thing to note is that this is not identical to the original partial differential equation, Eq. 1. The claim made here is that Eq. 5 is a better approximation of the finite-difference equation than Eq. 1 and because of this we can obtain information about the stability properties of the difference equation. This, in fact, is the case.

여기에서 먼저주의해야 할 점은이 표현은 원래 편미분 방정식 1과 동일하지 않다는 것입니다.  여기에서 증명하고 싶은 것은, 식 5 식 1보다 유한 차분 방정식을 양호하게 근사 할 식이며, 따라서 차이 방정식의 안정성을 나타내는 특성에 대한 정보를 얻을 수 있다는 점입니다.  바로 이것이 증명됩니다.

Recall that the difference equation propagated information into a region of influence bounded by lines whose slopes are dx/dt=±δx/δt. Similarly, the truncated Eq. 5 has a hyperbolic (i.e., wave) character because of the second space and second time derivatives, and the effective wave speeds are ±(2ν/δt)½. If the difference equation is to have any hope of approximating the truncated equation then its region of influence must at least encompass the region of influence of the truncated equation, which leads to the condition

전술 한 바와 같이 차등 방정식은 기울기 dx / dt = ± δx / δt를 가진 선이 경계가되는 영향 영역에 정보가 전달됩니다.  마찬가지로 계산을 중단 한 식 5는 공간에 대한 2 차 도함수 및 시간에 대한 2 차 도함수에 의해 쌍곡선 (즉, 파동)의 특성을 가지고 유효한 파동 속도는 ± (2ν / δt ) ½입니다.  차분 방정식으로 계산을 중단 한 식을 근사하려면 그 영향 영역이 적어도 계산을 끊은 식의 영향 영역을 포함하고 있어야합니다.  그러면 다음의 조건이 도출됩니다.

(6)     \displaystyle \frac{2\nu }{\delta t}\le {{\left( \frac{\delta x}{\delta t} \right)}^{2}}   or   \displaystyle \frac{2\nu \delta t}{\delta {{x}^{2}}}\le 1.

Courant, Friedrichs and Lewy [2] used a similar region of influence condition, now called the Courant condition, which restricts the distance a wave travels in one time increment to less than one space increment. A violation of the Courant condition leads to an oscillating and exponentially growing instability. Condition Eq. 6 is precisely one of the stability conditions found from Fourier analysis in Computational Stability.

Courant, Friedrichs 및 Lewy [2]는 유사한 영향 영역에 관한 조건을 사용했습니다.  현재 이것은 “쿨랑 조건”이라고 불리며 하나의 시간 증분 사이에 파도가 전파하는 거리가 하나의 공간 증분 미만으로 제한된다는 것입니다.  쿨랑 조건이 충족되지 않은 경우, 부호의 빈번한 반전이나 기하 급수적 인 증가를 수반 불안정성이 생깁니다.  조건식 6은 바로 ‘ 계산 안정성 “푸리에 분석에서 도출 한 안정 조건의 하나입니다.

A similar Courant-type condition can be inferred from the two first order derivative terms (the advective terms) in the truncated Eq. 5, which propagate information with speed c,

계산을 중단 한 식 5의 2 개의 1 차 도함수 항 (이류 항)에서 다음과 같은 유사한 쿨랑 유형 조건을 추측 할 수 있습니다.  여기에서 정보는 속도 c로 전달합니다.

(7)     \displaystyle \frac{c\delta t}{\delta x}\le 1.

This stability condition, also identified in Computational Stability, likewise leads to an oscillating and growing instability when violated.

이 안정 조건도 “계산 안정성”로 표시 한 것으로, 충족되지 않을 때뿐만 아니라 부호의 반전이나 증가를 수반 불안정성이 생깁니다.

To uncover a third stability condition we must first rewrite the truncated equation by converting the δt term to have space instead of time derivatives, but in a way that still maintains the first order of the expansion. This is done by differentiating Eq. 3 by t and neglecting all first and higher order terms,

세 번째 안정 조건을 도출 먼저, δt 항을 변환하여 계산을 중단 한 식을 다시 작성합니다.  이 때 배포 1 차 항이 유지되도록 시간 도함수 대신 공간 도함수를 갖도록 변환합니다.  이것은 식 3을 t로 미분 1 차 이상의 항을 무시합니다.

(8)     \displaystyle \frac{{{\partial }^{2}}u}{\partial {{t}^{2}}}+c\frac{\partial }{\partial x}\frac{\partial u}{\partial t}-\nu \frac{{{\partial }^{2}}}{\partial {{x}^{2}}}\frac{\partial u}{\partial t}=O\left( \delta t \right)

Next replace the first time derivative of u by t in this equation using Eq. 1 to obtain

그런 식 1을 이용하여이 식 u / t 시간의 1 차 도함수를 대체하여 다음의 식을 얻는다.

(9)     \displaystyle \frac{{{\partial }^{2}}u}{\partial {{t}^{2}}}={{c}^{2}}\frac{{{\partial }^{2}}u}{\partial {{x}^{2}}}-2c\nu \frac{{{\partial }^{3}}u}{\partial {{x}^{3}}}+{{\nu }^{2}}\frac{{{\partial }^{4}}u}{\partial {{x}^{4}}}+O\left( \delta t \right)

Finally, rewrite the truncated Eq.5 using this result for the δt term

마지막으로,이 결과를 이용하여 δt 사항에 대해 계산을 중단 한 식 5를 다시 작성합니다.

(10)     \displaystyle \frac{\partial u}{\partial t}+c\frac{\partial u}{\partial x}=\left( \nu -\frac{{{c}^{2}}\delta t}{2} \right)\frac{{{\partial }^{2}}u}{\partial {{x}^{2}}}+c\nu \delta t\frac{{{\partial }^{3}}u}{\partial {{x}^{3}}}-\frac{{{\nu }^{2}}\delta t}{2}\frac{{{\partial }^{4}}u}{\partial {{x}^{4}}}.

This result is identical to what would have been obtained by Taylor expanding the original finite-difference equation about the point x=jδx and t=(n+½)δt (and would probably have been easier).

마지막으로 얻어진 수식은 원래 유한 차분 방정식을 점 x = jδx 및 t = (n + ½) δt의 주위에 테일러 전개하고 (아마도 더 쉽게) 제공하는 것과 같은 식입니다.

According to our rule-of-thumb the last two terms on the right side proportional to δt can be dropped because they involve higher order derivatives than what is in the first δt term on the right side, which leaves,

위의 경험칙에서 δt에 비례 우변의 마지막 두 절은 우변의 첫 번째 δt 항에 포함 된 것보다 고차 도함수를 포함하기 때문에 폐기합니다.

(11)     \displaystyle \frac{\partial u}{\partial t}+c\frac{\partial u}{\partial x}=\left( \nu -\frac{{{c}^{2}}\delta t}{2} \right)\frac{{{\partial }^{2}}u}{\partial {{x}^{2}}}.

This is an alternative form for the truncated equation that retains only the lowest order (first) truncation errors and only those that contain the lowest even and odd derivatives with respect to each independent variable.

이것은 계산을 끊은 식의 대체 형식으로 최소 차수 (1 차)의 중단 오차와 각 독립 변수에 대해 최소의 짝수와 홀수 함수 (도함수)을 포함 것만을 보유하고 있습니다.

Equation 11 is nearly the same as the original Eq. 1, except for a modified diffusion coefficient. The significant thing here is that the diffusion coefficient can be negative. As long as the diffusion coefficient is positive solutions of Eq. 11 exhibit exponentially damped behavior, but with a negative coefficient solutions have an exponentially growing character, i.e., a computational instability! Thus, a further condition for computational stability is that the diffusion coefficient remains positive,

식 11는 변형 된 확산 계수를 제외하고는 원래의 식 1과 거의 동일합니다.  여기서 중요한 것은, 확산 계수는 마이너스가 될 가능성이있는 것입니다.  확산 계수가 양수로 한 식 11의 해는 기하 급수적으로 감쇠 거동을 나타내지 만 계수가 음수 솔루션은 기하 급수적으로 증가하는 특성을 보인다, 즉 계산의 불안정성이 생깁니다 .  따라서 계산 안정성을 구현하기위한 또 하나의 조건으로 확산 계수가 정의되는 것을 결정합니다.

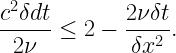
(12)     \displaystyle \frac{{{c}^{2}}\delta t}{2}\le \nu

In this case the instability is a pure growing one without the oscillations in sign associated with the two earlier region-of-influence conditions. If instability is encountered, knowing whether it is exhibiting an oscillation in sign or not will identify it as either a region-of-influence violation or a negative diffusion coefficient. Having this knowledge makes it easier to find a remedy for the instability.

이 케이스의 불안정성은 전술의 영향 영역에 관한 두 가지 조건에 관련한 부호 반전을 수반하는 것이 아니라 단순히 증가하는 특성입니다.  불안정성이 보여진다 부호의 빈번한 반전을 수반 여부를 파악하여 영향 영역에 관한 조건 또는 음의 확산 계수에 관한 조건 중이 충족되지 않았는지 확인 할 수 있습니다.  이러한 정보를 파악할 수 있으면 불안정을 해소하는 방법을 쉽게 찾을 수 있습니다.

Application to Two-Dimensional Fluid Flow

A two-dimensional example (x,z) of water flowing under a laboratory scale sluice gate offers a test for examining a computational instability arising from non-linearity in the governing equations. The physical problem consists of water held behind a gate with an elevation of 0.9ft. Downstream (right) of the gate there is a water pool of depth 0.14 ft. Gravity is 32.2 ft/s2 in the negative z direction (down). At time t=0 the gate is raised up a distance of 0.125ft and water surges out into the pool. Figure 1 shows the resulting flow obtained with a Navier-Stokes solver [3] at t=0.35s. The solver used for this example has been optimized to automatically eliminate instabilities so none are apparent in this case, but it is possible to force the program to use non-optimum settings.

실험실 규모의 수문 아래를 통과하는 2 차원 (x, z)의 흐름의 예는 지배 방정식의 비선형 성으로 인한 계산 불안정성을 조사 테스트합니다.  이 물리 현상 문제는 0.9 피트 높이까지 물을 막아서있는 수문이 있습니다.  수문 하류 측 (오른쪽)의 수심은 0.14 피트입니다.  중력이 -z 방향 (아래쪽)에 32.2 피트 / s 2입니다.  시간 t = 0에 수문은 0.125 피트 상승하고 물이 하류로 흘러갑니다.  그림 1은 나비에 스톡스 솔버[3]을 이용하여 얻은 t = 0.35s의 흐름을 나타냅니다.  이 예에서 사용 된 솔버는 불안정성을 자동으로 제거하도록 최적화되어 있기 때문에이 경우에는 불안정성은 볼 수 없습니다.  그러나 프로그램에 최적화되지 않은 설정을 강제로 실행할 수 있습니다.
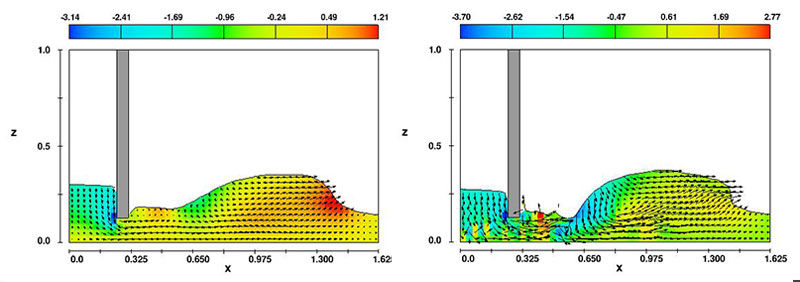
Computational stability issues

Figure 1 (left). Flow under a sluice gate. No unstable behavior is observed.
Figure 2 (right). Flow instability developing when computed with small time step and no viscosity.

To demonstrate some unstable behavior we first examine a heuristic analysis performed on the vertical velocity equation used in the simulation. Focus is on the effective diffusion coefficients for the z direction velocity w, while all other truncation errors are ignored,

불안정한 거동을 실례로 설명하기 위해 먼저 시뮬레이션에 사용 된 수직 속도 식에 대해 수행 한 휴리스틱 분석을 고찰합니다.  여기에서 z 방향 속도 w에 대한 효과적인 확산 계수에 초점을 맞추고 있으며, 다른 모든 중단 오차는 무시합니다.

(13)     \displaystyle \frac{\partial w}{\partial t}+u\frac{\partial w}{\partial x}+w\frac{\partial w}{\partial z}+\frac{\partial }{\partial z}\left( \frac{p}{\rho } \right)+g=\left( \nu +\frac{\alpha u\delta x}{2}-\frac{{{u}^{3}}\delta t}{2}-\frac{\delta {{x}^{2}}}{4}\frac{\partial u}{\partial x} \right)\frac{{{\partial }^{2}}w}{\partial {{x}^{2}}}+\left( \nu +\frac{\alpha w\delta z}{2}-\frac{{{w}^{2}}\delta t}{2}-\frac{\delta {{z}^{2}}}{2}\frac{\partial w}{\partial z} \right)\frac{{{\partial }^{2}}w}{\partial {{z}^{2}}}

The diffusion of w in the x and z directions are expressed by the two terms on the right side of Eq. 13, where ν is the fluid viscosity and α is a parameter that modifies the numerical approximation of the term describing the u advection of w, i.e., the second term on the left side of the above equation. When α=0 the finite-difference advection approximation is said to be centered about the location of w, but when α=1 an upstream or “donor cell” approximation is used.

x 및 z 방향의 w의 확산은 식 13의 우변의 두 항으로 표현되어 있습니다.  여기서, v는 유체 점성, α는 w의 u 이류를 나타내는 항 (식 13의 좌변의 제 2 항)의 수치 근사를 수정하는 매개 변수입니다.  α = 0 일 때, 이류의 유한 차분 근사 w의 위치를 중심으로 한 근사하지만, α = 1 일 때, 상류 측 또는 “도나세루」에 의한 근사를 사용합니다.

The first thing to notice is that if ν=0 and a centered difference approximation is also used (α=0) then the lowest order term in the two effective viscosity coefficients are proportional to δt and are negative. This clearly leads to unstable behavior, and is a well known property of the central difference approximation. Adding enough viscosity to keep the diffusion coefficient positive is also an established procedure to gain stability, but at the possible cost of introducing too much diffusion. The upstream difference option, α=1, is a reasonable compromise; provided the condition wδt<δx is maintained, the diffusion coefficients are positive (provided the δx2 and δz2 terms are small) and the simulation will be stable.

먼저 주의해야 할 점은 ν = 0이고 중심 차분 근사를 사용하는 경우 (α = 0), 2 개의 유효 점성 계수의 최소 차수의 항은 δt에 비례하고, 부가됩니다.  이것은 분명 불안정한 거동을 이끌 것으로, 중심 차분 근사의 잘 알려진 특성입니다.  확산 계수를 양수 유지하기 위해 충분한 점성을 추가 수법도 안정성을 얻는 데에서 확립 된 방법이지만, 확산이 커질 위험성도 있습니다.  상류 측에서 차분 옵션 α = 1은 합리적인 타협이다.  조건 wδt <δx이 충족되는 한, 확산 계수는 양이며 (δx 2 및 δz 2 항이 작은 경우) 시뮬레이션도 안정됩니다.

If the δx2 and δz2 terms in the diffusion coefficients are not small there is a possibility of unstable behavior. To demonstrate this we set the viscosity to zero and reduce the amount of upstream differencing by setting α=0.05. To keep the negative δt term less than the a term a very small time step δt=0.00025 is used. With these settings the resulting simulation is shown in Fig. 2. An instability in the z velocity has developed just upstream of the sluice gate, which is shown close up in Fig. 3 (where color indicates the z velocity magnitude).

확산 계수의 δx 2 및 δz 2 항이 작지 않은 경우 불안정한 거동이 발생할 수 있습니다.  이를 설명하기 위해 점성을 0으로 설정하고 상류의 차이 량을 α = 0.05로 줄입니다.  부정적인 δt 항이 a 항보다 작아 지도록 매우 작은 시간 단계 δt = 0.00025을 사용합니다.  이러한 설정에서 실행 된 시뮬레이션을 그림 2에 나타냅니다.  수문 상류 측에서 z 속도의 불안정성이 발생하고 있습니다.  그림 3은 그 확대도를 나타냅니다 (색상은 z 속도의 크기를 나타낸다).

This instability is a result of a negative x-direction diffusion coefficient, which is coming from the δx2 term. A negative value results from the fact that the flow upstream of the gate is compressing in the z direction, but expanding in the x direction, which means that the x derivative of u in the δx2 term is positive in this region resulting in a net negative diffusion coefficient.

이 불안정은 δx 2 항에 의하여 부정되었다 x 방향의 확산 계수에 기인합니다.  수문 상류의 흐름은 z 방향으로 압축하고 있습니다 만, x 방향으로 팽창하고 있기 때문에 음수입니다.  즉,이 영역에서는 δx 2 항의 u의 x 방향 도함수는 긍정적이고 순으로 부정적인 확산 계수입니다.

A check on this conclusion can be made by adding in a little viscosity ν=0.0093 to compensate for the negative δx2 term. Figure 4 shows that this change does, indeed, stabilize the flow.

이 결론을 확인하려면 부정적인 δx 2 항을 보정하기 위해 약간 점성을 추가합니다 (ν = 0.0093).  그림 4는이 작은 변화에 의해 흐름이 확실히 안정된 것을 알 수 있습니다.

This example demonstrates that truncation error terms arising from non-linear terms in the original equation influence the computational stability of the difference equation. This type of instability cannot be found by a von Neumann type Fourier analysis. Perhaps most important of all is that when troublesome truncation errors are found to exist this knowledge can be used to alter the finite difference equations to eliminate those errors.

이 예에서는 원래의 방정식의 비선형 항으로 인해 중단 오차 항은 차분 방정식의 계산 안정성에 영향을 미치는 것으로 나타했습니다.  이 유형의 불안정은 von Neumann 유형의 푸리에 분석에서 찾을 수 없습니다.  가장 중요한 것은 문제가 될 수있는 중단 오차가 존재하는 것으로 판명 될 때이 지식을 이용하여 유한 차분 방정식을 수정하여 이러한 오차를 제거 할 수 있습니다.
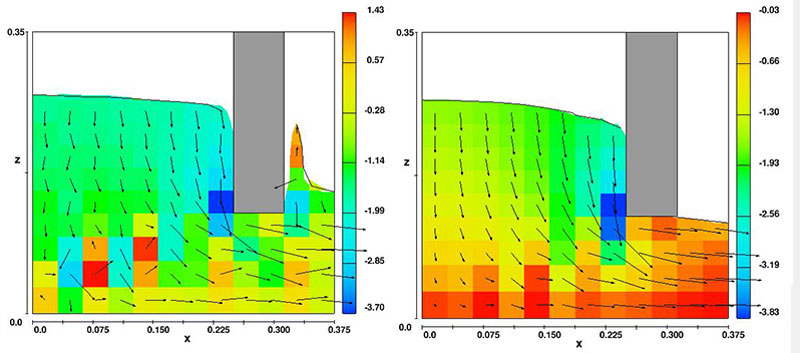
Totally unstable flow versus stable flow

Figure 3 (left). Close up of locally unstable flow caused by negative δx2 term. Color indicates z velocity.
Figure 4 (right). Same as Fig. 3 with a small amount of viscosity added to compensate for negative δx2 term.

Summary

To summarize, it has been shown that all the stability conditions associated with a linear finite-difference equation, Eq.2, can be identified using a heuristic truncation error approach. This approach not only identifies the instabilities, it also indicates what can be done to eliminate them. For instance, for a region-of-influence violation only a reduction in the time-step increment will solve the problem, but if there is a negative diffusion coefficient then adding more diffusion to compensate for the errors is one way to regain stability. Knowing the origin of a negative diffusion error may also suggest how the original finite-difference equation might be modified to avoid this problem.

이 책에서는 선형 유한 차분 방정식Eq.2에 관련된 모든 안정 조건을 중단 오차에 대한 경험적 접근에 의해 특정 할 수 있는지를 보여주었습니다.  이 방법은 불안정성을 특정 할 수있을 뿐만 아니라 그것을 제거하는 방법을 보여줍니다.  예를 들어, 영향 영역에 대한 조건이 충족되지 않을 경우 시간 단계를 줄일 수 밖에 없어 문제를 해결할 수 없지만, 음의 확산 계수가 존재하는 경우는 확산을 확대하고 오차를 보정하여 안정성을 되찾는 방법 도 있습니다.  음의 확산 오차의 원인을 아는 것은이 문제를 해결 할 수 있도록 원래의 유한 차분 방정식을 어떻게 해결 하는가하는 방법을 알려 줄 수 있습니다.

The most significant aspect of the heuristic approach is that it is not limited to linear equations with constant coefficients, as was shown in connection with the example of flow under a sluice gate. No special assumptions were necessary to form the approximating truncated equation. The goal was simply to reverse the procedure of writing a difference equation to approximate a partial differential equation, and instead to write a partial differential equation that approximates the difference equation. A simple rule-of-thumb was described for constructing the truncated equation. This approximating equation was then used to check for region-of-influence violations and for possible negative diffusion coefficients both features that lead to unstable solutions.

휴리스틱 접근법의 가장 중요한 특징은 상수 계수를 따른 선형 방정식에 한정되지 않는다는 점입니다.  이것은 수문 아래를 통과하는 흐름의 예에서 나타났습니다.  계산을 끊은 식의 근사 식을 세우는 데 특별한 가정이 필요하지 않았습니다.  편미분 방정식을 근사하는 차분 방정식을 설명하는 것이 아니라 차분 방정식을 근사하는 편미분 방정식을 기술한다는 단순히 역순를 할 목적이었습니다.  계산을 중단 한 식을 세우기위한 간단한 경험칙에 대해서도 설명했습니다.  이 근사 식을 사용하여 솔루션의 불안정으로 이어질 영향 영역에 대한 조건이 충족되어 있는지, 또한 음의 확산 계수가 존재하는지의 두 관점을 확인했습니다.

Several additional examples involving compressible and incompressible fluid dynamics simulations can be found in the original heuristic stability paper [1], which further show how the heuristic approach can be applied to real, practical, non-linear problems.

안정성에 관한 경험적 분석에 대해 기술 된 참고 문헌 [1]에는 압축 흐름 및 비 압축 흐름을 따른 몇 가지 유체 역학 시뮬레이션 예가 나와 있습니다.  또 경험적 접근을 실제 비선형 문제에 적용하는 방법에 대해 자세히 나와 있습니다.

References

  1. C.W. Hirt, Heuristic Stability Theory for Finite-Difference Equations, J. Comp. Phys., 2, 339 (1968).
  2. R. Courant, K.O. Friedricks and H. Lewy, Math. Ann. 100, 32 (1928).
  3. The commercial software package FLOW-3D from Flow Science, Inc., Santa Fe, NM, USA.

계산 안정성

본 자료는 국내 사용자들의 편의를 위해 원문 번역을 해서 제공하기 때문에 일부 오역이 있을 수 있어서 원문과 함께 수록합니다. 자료를 이용하실 때 참고하시기 바랍니다.

Computational Stability/계산 안정성

It is a fact of life that numerical approximations to differential equations may exhibit unstable behavior. That is, computational results may include exponentially growing and sometimes oscillating features that bear no relation to the solution of the original differential equation. This type of behavior is referred to as a computational instability.

미분 방정식의 수치 근사에서 불안정한 거동을 보이는 것은 드문 일이 아니다.  즉, 계산 결과에서 기하 급수적으로 증가하고 때로는 부호가 자주 반전하는 등 원래의 미분 방정식의 솔루션과 아무런 관련이없는 특성을 볼 수 있습니다.  이러한 동작을 “계산 불안정성”이라고합니다.

It is important to distinguish computational instability from physical instabilities, which may occur in some physical problems. In practice, the distinction between these types of unstable behavior is not always obvious. Certainly when a computed solution has features that change sign with each step of the finite-difference increments (in time or space) the instability is probably associated with the numerical approximation. On the one hand, changes in sign during time advancement can often be cured by decreasing the size of the time increment. On the other hand, changes in sign with space increments might indicate a lack of computational resolution, which a reduction in the size of the space increments might eliminate.

어떤 물리적인 문제가 발생할 수 있는 물리적 불안정성으로 부터 게산 불안정성을 구별하는 것이 중요합니다.  그러나 실제로는 이러한 불안정한 거동의 차이는 항상 명확하지 않습니다.  계산된 솔루션에서 유한 차등 (시간 또는 공간) 증분 단계마다 부호가 반전하는 특성이 나타나는 경우 이 불안정은 틀림없이 수치 근사에 의한 것으로 생각됩니다.  한편으로는, 시간 진행에 따른 부호 반전은 종종 시간 증가를 작게하여 해결할 수 있습니다.  반면 공간 증가에 따른 부호 반전은 계산 해상도의 부족을 나타낼 수 있습니다.  이것도 공간 증가를 작게하여 문제를 제거 할 수 있는 경우가 있습니다.

In general, it would be desirable to have a means of predicting when computational as opposed to physical instabilities can occur. Unfortunately, no general method has yet been devised. There are, however, some analysis techniques that often provide enough guidance to avoid the majority of frequently encountered computational instabilities. Some of these techniques will be described in this introductory article.

일반적으로 물리적이 아니라, 계산에 의한 불안정성이 생기는 것을 예측 할 수 있는 방법이 바람직 할 것입니다.  불행하게도 그러한 일반적인 방법은 아직 고안되어 있지 않습니다.  그러나 자주 발생하는 계산 불안정성을 많이하지 않도록 하는데 충분한 지침이되는 분석 방법은 여러 가지가 있습니다.  기본 개념을 나타내는 문서에서는 이러한 방법 중 일부에 대해 설명합니다.

A Simple Example of Computational Instability

The following simple example provides a useful introduction to the subject of computational stability. Consider the simple rate equation,

여기에서는 계산 안정성의 기본 개념을 설명하기에 적합한 간단한 예를 보여줍니다.  다음과 같은 간단한 반응 속도 식을 생각합니다.

(1)     \displaystyle \frac{\delta Q}{dt}=-AQ,

where Q=Q0 at t=0. The exact solution of this equation is an exponential decay Q=Q0exp(-At).

For a numerical approximation, suppose time is discretized into equal steps of size δt and that t=n δt, where n is an integer. Numerically computed values of Q will the denoted by a lower case q to distinguish them from the exact solution and an exponent n will be used to denote the time step, so that qn is the approximation to Q(n δt). A finite-difference approximation to Eq.1 can be written as,

여기서 Q = Q 0, t = 0으로하면이 식의 정확한 솔루션은 지수 적 감쇠 Q = Q 0 exp (-At)입니다.

수치 근사치를 얻기 위해 일정한 단계 크기 δt 시간을 이산화 t = n δt합니다 (n은 정수).  수치적으로 계산 된 Q 값은 정확한 솔루션과 구별하기 위해 소문자 q로 나타내며 지수 n을 사용하여 시간 단계를 나타냅니다.  그러면 Q (n δt)의 근사치는 q n입니다.  식 1의 유한 차분 근사는 다음과 같이 작성할 수 있습니다.

(2)     \displaystyle {{q}^{n+1}}-{{q}^{n}}=-A\delta t{{q}^{n}},

where q0=Q0. Because of its simplicity there is an exact solution to Eq.2,

여기서, q 0 = Q 0하면 매우 간결하게 식 2의 정확한 솔루션을 얻을 수 있습니다.

(3)     \displaystyle {{q}^{n}}={{\left( 1-A\delta t \right)}^{n}}{{q}_{0}}

Now the interesting thing is to observe how the values of qn evolve with n as the value of Aδt is changed. The values depend on the magnitude of the bracket (1-Aδt), which is raised to the power of n, Fig. 1.

여기서 주목해야 할 것은 Aδt 값이 변화함에 따라 값 q n이 n에 따라 어떻게 변화 해 나갈 것인가 하는 점입니다.  값은 n 승되는 괄호 (1-Aδt) 값의 크기에 따라 달라집니다 (그림 1).

Equation 3 for the first few values of n.

Figure 1. Equation 3 for the first few values of n. Series 1 for Aδt=0.5, Series 2 for Aδt=1.5, Series 3 for Aδt=2.5 and Series 4 for exact values from Eq.1.

When Aδt is greater than 2.0, the bracket is negative and has a magnitude that is greater than 1.0, so qn changes sign alternately with increasing n and its magnitude is rapidly growing. This is a clear case of computational instability in which the numerical results provide no useful information about the evolution of q. In contrast, if the value of Aδt is less than 1.0, the bracket is positive and has a magnitude less than 1.0. In this case the evolution of qn is a decent approximation of the exponential decay in the exact solution, in which the values lie a little below the exact values. Intermediate values of Aδt (between 1.0 and 2.0) result in qn values that decay, but do so with an oscillation in sign each time step. Based on these observations we can say that the finite-difference approximation Eq. 2 is a stable and reasonable approximation to the exact equation provide the time step δt is limited by the “stability condition” Aδt<1.0.

Aδt가 2.0보다 큰 경우 괄호 안에 음수가되고, 그 절대 값은 1.0보다 커집니다.  따라서 n이 증가 할 때마다 q n의 부호는 반전 값은 크게 증가하고 있습니다.  이것은 계산 결과를 봐도 q가 어떻게 변화 해 나갈 것인가를 파악할 수없는 계산 불안정성이 보이는 전형적인 케이스입니다.  이에 대해 Aδt 값이 1.0보다 작을 때, 괄호 안은 정되고, 그 절대 값은 1.0보다 작아집니다.  이 경우 q n의 변화는 근사치가 정확한 값을 약간 밑도는 엄격 해의 지수 적 감쇠의 우수한 근사치입니다.  Aδt에 중간 값 (1.0과 2.0 사이)을 대입하면 q n 값은 감소하지만, 시간 단계마다 부호가 반전됩니다.  이러한 점에서 유한 차분 근사 식 2는 시간 단계 δt가 “안정 조건”Aδt <1.0에 의해 엄격하게 제한 될 때 식에 안정적이고 합리적인 근사치를 나타내는 것을 알 수 있습니다.

Linear Stability Analysis of von Neumann

One of the 20th century’s most famous mathematicians, John von Neumann played an important role in the development of the modern computer. So it may be no surprise that he also pioneered analytical techniques for studying the properties of finite-difference equations. His approach to evaluating the computational stability of a difference equation employs a Fourier series method and is best described in References 1 and 2.

20 세기의 가장 유명한 수학자의 한사람 인 John von Neumann은 현대 컴퓨터의 기초를 세운 업적들로 알려져 있습니다 만, 유한 차분 방정식의 특성을 조사하기위한 분석 기법도 개발하고 있습니다 .  그 방법은 차분 방정식의 계산 안정성을 평가하기 위해 푸리에 급수를 이용한 접근 방식을 취하며, 참고 문헌 1 및 2 에 대한 세부 사항을 설명하고 있습니다.

The approach von Neumann used is based on two assumptions. First, that the difference equation can be linearized with respect to a small perturbation in the solution. Second, that there exists a set of overlapping regions in each of which the coefficients of terms in the difference equation for the perturbation can be considered locally constant. When these conditions are satisfied a Fourier series can be used in each region to compute the local behavior of the perturbation.

von Neumann의 접근 방식은 두 가지 가정에 근거하고 있습니다.  차분 방정식은 솔루션에 포함 된 작은 섭동에 대해 선형화 할 수있는, 그리고 섭동에 대한 차분 방정식의 항의 계수를 국소적으로 상수로 간주 될 수 겹치는 영역이 존재하는 것입니다.  이러한 조건이 충족 될 때, 각 영역에서 푸리에 급수를 이용하여 섭동의 국소 적 거동을 계산할 수 있습니다.

The solution for the perturbation Pjn, at discrete location j and time step n, is sought as a sum of Fourier terms having the form

시간 단계 n과 공간의 이산 위치 j의 섭동 P j n은 다음의 형식을 취해 푸리에 항의 합으로 구해집니다.

(4)     \displaystyle P_{j}^{n}\propto {{r}^{n}}{{e}^{ikx}},

where xj is the location of the jth finite-difference point, k is the wave number of the mode and r is a time amplitude. Because of the linear nature of the difference equation, it is only necessary to consider the behavior of a typical mode. Substitution of the typical mode into the linearized difference equation leads to an algebraic equation for the time amplitude r that must be satisfied if there is to be solution of the form postulated. A full solution for the perturbation could then be constructed from a sum of Fourier modes over a range of wave numbers.

여기서 xj는 j 번째의 유한 차분 점의 위치, k는 모드의 주파수, r은 시간 진폭입니다.  차분 방정식의 선형 특성에 따라 전형적인 형태의 거동을 고찰하기 만하면 됩니다.  전형적인 모드를 선형화 된 차분 방정식에 대입하여 추정 된 형식의 솔루션을 얻기 위해 충족되어야 시간 진폭 r의 대수 방정식을 얻습니다.  그러면 범위의 주파수에 걸쳐 푸리에 모드의 합에서 섭동의 전체 솔루션을 얻을 수 있습니다.

Numerical stability implies that as time increases (i.e., with increasing n) the magnitude of each mode must not grow unboundedly, and this means that the magnitude of r must be less than or equal to unity.

수치적으로 안정되어 있다는 것은 시간이 진행하는 (즉 n이 증가)에 따라 각 모드의 크기가 제한없이 증가하고 안되어, 그것은 r 값의 크기가 1 이하 이어야한다는 것을 의미합니다.

An Example of Linear Stability Analysis

An example will make von Neumann’s technique clear. For illustration purposes an advection-diffusion equation is a good test case,

von Neumann의 방법을 명확하게 하기 위해, 예를 이용하여 설명합니다.  여기에서는 테스트 케이스에 적합 이류 확산 방정식을 예로 들어 있습니다.

(5)     \displaystyle \frac{\partial u}{\partial t}+c\frac{\partial u}{\partial x}=\nu \frac{{{\partial }^{2}}u}{\partial {{x}^{2}}},

which describes the convection and diffusion of a function u(x,t). The convection velocity c and diffusion coefficient ν are constant. Solutions of this equation are known to be well-behaved (i.e., physically stable).

이것은 함수 u (x, t)의 대류와 확산을 나타내는 식입니다.  대류 속도 c와 확산 계수 ν는 정수입니다.  이 방정식의 해는 양호한 거동을 나타내는 것을 알 수 있습니다 (즉, 물리적으로 안정되어있다).

A simple finite-difference approximation using constant time steps δt and spatial steps δx for ujn= u(jδx,nδt) is

상수 인 타임 단계 δt 및 공간 단계 δx를 사용하여 u j n = u (jδx, nδt) 한 다음 간단한 유한 차분 근사 식을 얻습니다.

(6)     \displaystyle \frac{u_{j}^{n+1}-u_{j}^{n}}{\delta t}=-\frac{c}{2\delta x}\left( u_{j+1}^{n}-u_{j-1}^{n} \right)+\frac{\nu }{\delta {{x}^{2}}}\left( u_{j+1}^{n}-2u_{j}^{n}+u_{j-1}^{n} \right)

Inserting von Neumann’s mode Eq. 4 to this equation, with xj=jδx, and solving for r gives

이 식은 von Neumann 모드 식 4를 대입하고 xj = jδx로 r에 대해 해결합니다.

(7)     \displaystyle r=1-\left( \frac{ic\delta t}{\delta x} \right)\sin \left( k\delta x \right)-\left( \frac{2\nu \delta t}{\delta {{x}^{2}}} \right)\left[ 1-\cos \left( k\delta x \right) \right].

Because this involves real and imaginary terms the square of the magnitude of r is given by the sum of the squares of the real and imaginary parts,

이 식에는 실수 항과 허수 부분이 포함되어 있으며, r의 절대 값의 제곱은 실수 부와 허수 부를 각각 제곱 한 합계에서 구할 수 있습니다.

(8)     \displaystyle {{r}^{2}}={{\left( 1-\frac{2\nu \delta t}{\delta {{x}^{2}}}\left( 1-\cos \left( k\delta x \right) \right) \right)}^{2}}+{{\left( \frac{c\delta t}{\delta x}\sin \left( k\delta x \right) \right)}^{2}}.

From this result, limits on ν, c, and δt can be determined that ensure that r remains less than or equal to 1.0 the requirement for not having an unbounded solution of the form Eq. 4.

In general, the extreme values for r occur when the sine and cosine factors are at their extreme values of 0.0, 1.0 or -1.0. For instance, if kδx=0 then r=1 and this mode will be neutrally stable, neither increasing nor decreasing with increasing values of n (i.e., rn=1). When kδx=π the value of r2 is (1-4νδt/δx2)2 and this implies the stability condition

따라서 식 4 형식으로 답을 비 묶여 있어서는 안된다는 요구 사항, 즉 r이 1.0 이하로하는 조건을 만족하는 ν, c δt에 대한 제한이 결정됩니다.

기본적으로, r이 극값이되는 것은, sin과 cos의 인수가 각각의 극치 인 0.0,1.0 또는 -1.0 때입니다.  예를 들어, kδx = 0 일 때 r = 1입니다.  이 모드는 중립 안정이며, n의 증가에 따른 값의 증가 / 감소되지 않습니다 (즉, r n = 1).  kδx = π 일 때 r 2 값은 (1-4νδt / δx 2) 2이며 다음의 안정 조건이 도출됩니다.

(9)    \displaystyle \frac{2\nu \delta t}{\delta {{x}^{2}}}\le 1.

And finally, when kδx=π/2 the stability condition r2

또한 kδx = π / 2의 경우 안정적인 조건 r 2 <1은 다음과 같이됩니다.

(10)     \displaystyle {{r}^{2}}={{\left( 1-\frac{2\nu \delta t}{\delta {{x}^{2}}} \right)}^{2}}+{{\left( \frac{c\delta t}{\delta x} \right)}^{2}}\le 1.

Since the left side of the inequality is a sum of squares, neither term can exceed 1 without the left side exceeding 1.0, thus we have two conditions for stability solutions

부등식의 좌변은 제곱의 합이기 때문에 어느 부분이 1을 초과하면 왼쪽이 1.0을 초과하게되어, 안정적인 솔루션을 얻기위한 두 가지 조건이 인도됩니다.

(11)     \displaystyle \frac{c\delta t}{\delta x}\le 1   and   \displaystyle \frac{2\nu \delta t}{\delta {{x}^{2}}}\le 2.

The first condition is a new stability condition, but the second condition has already been made more restrictive in Eq. 9. In addition to these conditions, Eq. 10 admits of one more condition that can be evaluated by expanding the first term and rearranging the inequality,

첫 번째 조건은 새로운 안정 조건이지만, 두 번째 조건은 더 까다로운 것이 이미 식 9로 표시되어 있습니다.  이러한 조건 이외에 식 (10)의 제 1 항을 전개하고 불평등을 정렬하여 구해지는 또 하나의 조건이 부여됩니다.

(12)     \displaystyle \frac{{{c}^{2}}\delta dt}{2\nu }\le 2-\frac{2\nu \delta t}{\delta {{x}^{2}}}.

The minimum value on the right side, according to Eq. 9, is 1.0, which finally leads to a condition for the minimum size of diffusion ν. In total, there are three stability conditions to be satisfied,

식 9에서 우변의 최소값은 1.0입니다.  따라서 확산 계수 ν의 최소 크기에 대한 조건이 부여됩니다.  마지막으로, 충족되어야 할 3 가지 안정 조건이 인도됩니다.

(13)     \displaystyle \nu \ge \frac{{{c}^{2}}\delta t}{2},     \displaystyle \frac{c\delta t}{\delta x}\le 1,     \displaystyle \frac{2\nu \delta t}{\delta {{x}^{2}}}\le 1.

When these three conditions are satisfied no Fourier modes will grow as n increases and so no unbounded instability develops. The first condition, in particular, is interesting because it says there will be unstable solutions for any non-zero time step unless there is a sufficient amount of diffusion. In contrast, the remaining conditions are simply restrictions on the maximum time step size.

이러한 세 가지 조건이 충족 될 때 n이 증가함에 따라 푸리에 모드가 증가하는 것은 아니라 제한없는 불안정성이 발생하지 않습니다.  특히 첫 번째 조건은 충분히 확산되지 않는 한 0이 아닌 임의 시간 단계에 해가 불안정해질 수를 나타내고 있다는 점에서 매우 흥미 롭다고 할 수 있습니다.  반면 나머지 두 조건은 최대 시간 단계에 대한 단순한 제한에 지나지 않습니다.

At this point it’s worthwhile observing that a violation of the first condition in Eq. 13 leads to a solution with purely exponential growth, while violation of either of the second two conditions exhibits a growth that not only grows exponentially, but also changes sign with each increment in time. The reason for this behavior and other useful information about finite-difference equations is explained in the second CFD-101 article on stability, Heuristic Analysis.

여기서, 식 (13)의 첫 번째 조건이 충족되지 않은 경우 해석은 기하 급수적으로 증가 할뿐입니다 만, 나머지 2 개의 조건의 어느 한쪽이라도 충족되지 않은 경우에는 지수 함수 적인 증가뿐만 아니라 시간 증분마다 부호가 반전하는 것에 주목하십시오.  이 동작을 가져다 원인 및 유한 차분 방정식에 관한 기타 유용한 정보는 안정성을 설명하는 “CFD-101″의 다음 문서 “휴리스틱 분석”을 참조하십시오.

In summary, the von Neumann type of Fourier analysis of finite-difference equations is quite useful provided the equation(s) are linear and have constant coefficients within a set of overlapping regions. For more general situations other methods must be sought to analyze computational stability.

이처럼 대상 유한 차분 방정식이 선형이며, 겹치는 영역 세트에서 상수 계수가 사용되는 경우에는 von Neumann 유형의 푸리에 분석이 매우 유용하다고 할 수 있습니다.  보다 일반적인 상황에 대해 계산 안정성을 분석하는 경우에는 다른 방법을 고려해야합니다.

End Note

Readers who may be a bit rusty with exponentials and imaginary numbers may find the following set of identities useful for performing a von Neumann type analysis:

지수와 허수에 관한 노트로 von Neumann 유형의 분석을 수행하는 데 도움이되는 항등식은 다음과 같습니다.

\displaystyle \sin \theta =\frac{{{e}^{i\theta }}-{{e}^{-i\theta }}}{2i},                    \displaystyle \cos \theta =\frac{{{e}^{i\theta }}+{{e}^{-i\theta }}}{2}

\displaystyle \sin \theta =2\sin \left( \frac{\theta }{2} \right)\cos \left( \frac{\theta }{2} \right),     \displaystyle \cos \theta ={{\cos }^{2}}\left( \frac{\theta }{2} \right)-{{\sin }^{2}}\left( \frac{\theta }{2} \right)

\displaystyle {{\sin }^{2}}\left( \frac{\theta }{2} \right)=\frac{1-\cos \theta }{2},              \displaystyle {{\cos }^{2}}\left( \frac{\theta }{2} \right)=\frac{1+\cos \theta }{2}

References

  1. B.G. O’Brien, M.A. Hyman and S. Kaplan, “A Study of the Numerical Solution of Partial Differential Equations,” J. Math. Phys. 29, 223 (1951).
  2. J. von Neumann, Collected Works, IV, Macmillan Co., New York, NY (1963).

Free Surface Fluid Flow | 자유 표면 유체 흐름

Free Surface Fluid Flow

유체 흐름 문제는 복잡한 기하학적 구조의 자유 표면과 관련되는 경우가 많으며 대부분 매우 일시적입니다. 수력학의 예로는 배수로, 강, 교각 주변, 홍수 범람, 수문, 잠금 장치 및 다수의 기타 구조물의 흐름이 있습니다. 이러한 유형의 흐름을 계산적으로 모델링 하는 능력은 이러한 계산이 정확하고 합리적인 계산 자원으로 수행될 수 있다면 매력적입니다. 유용하게 사용하려면 시뮬레이션은 물리적 모델을 사용하는 것보다 훨씬 빠르고 저렴해야 합니다.

Fluid flow problems often involve free surfaces in complex geometry and in many cases are highly transient. Examples in hydraulics are flows over spillways, in rivers, around bridge pilings, flood overflows, flows in sluices, locks, and a host of other structures. A capability to computationally model these types of flows is attractive if such computations can be done accurately and with reasonable computational resources. To be useful, simulations should be much faster and less expensive than using physical models.

많은 컴퓨터 프로그램은 유체의 역학을 설명하는 편미분 방정식을 풀 수 있습니다. 시뮬레이션에 자유 표면을 포함 할 수있는 프로그램은 많지 않습니다.  그 이유는 Free Surface 경계 문제로 잘 알려진 수학적인 문제입니다.  자유 경계 문제는 다루기 어려운 표면이 이동함에 따라 계산 영역이 변화하는 한편, 그 표면 이동 자체가 계산에 의해 결정된다는 점에 있습니다.  계산 영역의 변화는 그 크기와 모양의 변화뿐만 아니라, 경우에 따라서는 영역의 결합과 분리(즉, 자유 표면의 발생과 소멸)을 포함합니다.

Many computer programs can solve the partial differential equations describing the dynamics of fluids. Not many programs are capable of including free surfaces in their simulations. The difficulty is a classical mathematical one often referred to as the free-boundary problem. A free boundary poses the difficulty that on the one hand the solution region changes when its surface moves, and on the other hand, the motion of the surface is in turn determined by the solution. Changes in the solution region include not only changes in size and shape, but in some cases, may also include the coalescence and break up of regions (i.e., the loss and gain of free surfaces).

이 책에서는 모든 자유 표면을 고려한 유체흐름 현상을 수치 해석용으로 모델링하는 방법에 대해 설명합니다.  이 기술은 VOF (Volume-of-Fluid) 법에 근거한 것으로, 특히 자유 표면 흐름에 적합한 다양한 기능을 제공합니다.  이 책에서는 VOF 법이 자유 표면과 그 발생과 소멸을 해석하는데 가장 자연스럽고 매우 효율적인 방법을 제시합니다.

In this note a computational modeling technique for fluid flows with arbitrary free surfaces is discussed. The technique is based on the Volume-of-Fluid (VOF) technique. This technique has many unique properties that make it especially applicable to flows having free surfaces. The goal of this discussion is to show why the VOF approach offers a natural way to capture free surfaces and their evolution with great efficiency.

VOF 법의 특징을 잘 보여주기 위해 간단하지만 매우 중요한 유동 현상에 관한 문제를 다룹니다.  여기에서는 계단 낙차형상의 낙하류를 예로 들어 있습니다.  개념적으로 간단한 흐름인 동시에 결과의 타당성을 확인하기위한 좋은 실험 데이터도 제공되어 있습니다 (N. Rajaratnam and MR Chamani “Energy Loss at Drops”J. Hydraulic Res. Vol. 33 p.373,1995 참조).

A good recommendation for the VOF method is to demonstrate its capabilities on a simple hydraulic flow problem, one that is far from trivial. The example selected is of flow over a step. This flow has conceptual simplicity and good experimental data available for validation (see N. Rajaratnam and M.R. Chamani, “Energy Loss at Drops,” J. Hydraulic Res. Vol. 33, p.373, 1995).

Prototype Hydraulic Flow with Free Surfaces

그림 1a는 정상 상태에 도달 한 후 흐름의 문제를 보여줍니다.  계단 낙차형상 상부로부터의 월류(액체 또는 스냅 시트)에는 상하 모두의 자유 표면이 있습니다.  월류의 아래쪽에는 월류와 계단 가공면 사이에 웅덩이가 형성되어 있으며, 하류에서는 액체는 평평한 정상 표면에서 오른쪽으로 흐르고 있습니다.  엄밀히 말하면, 웅덩이 영역의 흐름 상태는 정상입니다.  이것은 충돌하는 액체에 의해 풀에 난류 혼합이 발생하고 있기 때문입니다.  그러나 평균적인 구성이 존재하고 그것은 실험에서도 보고됩니다.

Figure 1a shows the flow problem after it has reached a steady-state condition. The overflow (sheet of liquid or nappe) leaving the top of the step has both an upper and lower free surface. At the bottom of the overflow a pool has formed between the overflow and the face of the step, while downstream, liquid is flowing to the right with a flat, steady surface. Strictly speaking, the flow conditions in the pool region are not steady because turbulent mixing is generated in the pool by the impinging fluid. There is, however, an average configuration and that is what is reported in the experiments.

실용적인 목적 유동 흐름은 항상 2 차원입니다.  즉, 그림 1a에서 수직 방향에서는 큰 변화는 없습니다.  현실에서는 웅덩이 위쪽으로 공간을 만들기 위해서는 대기에 여유공간이 필요하고, 그게 없으면 닫힐 것입니다.

For all practical purposes the flow is two-dimensional, that is, it does not have any significant variation in the direction normal to the illustration in Fig. 1a. In actuality, to have an air space above the pool there must be some opening to the atmosphere otherwise it would close up.

계단 낙차형상 상단의 유속은 중요합니다.  즉, 이것은 표면파와 같거나 그 이상의 속도이기 때문에 하류에서의 교란이 영역을 관통하고 상류 흐름 (계단 낙차형상의 왼쪽)에 영향을 줄 수 없습니다.  따라서 이 영역에서의 흐름은 예외적으로 원활하고 정상입니다.

The flow speed at the top of the step is critical, that is, it has a speed equal to or greater than the speed of surface waves, so that no disturbances from downstream can penetrate through this region to affect flow upstream (to the left of the step), which is why the flow is exceptionally smooth and steady in that region.

이 문제는 수치 시뮬레이션과 비교할 수 있는 기하 형상 기능이 많이 있습니다.  예를 들어, 계단 낙차형상의 전후 흐름의 높이, 월류가 바닥에 충돌 할 때의 각도, 월류 아래에 형성되는 웅덩이의 깊이 등입니다.  또한 실용화를 위한 중요한 비교 항목으로는, 계단 낙차형상을 통해 떨어지는 낙하 류에 의해 손실되는 에너지의 양 (운동 에너지와 위치 에너지의 합)가 있습니다.

There are many geometric features in this problem that can be compared with a numerical simulation; such as flow heights before and after the step, the angle of the overflow stream when it strikes the bottom and the depth of the pool formed under the overflow. Additionally, an important comparison for practical applications is the amount of energy (i.e., kinetic plus potential) lost by the flow in passing over the step.

Simulation of Prototype Problem

그림 1a는 시뮬레이션의 결과입니다.  이 예에서는 실험에 사용된 모든 기하 형상 및 물질의 특성이 시뮬레이션에 사용되었습니다.  실험실 테스트에서 사용한 계단 낙차형상의 높이가 62cm에서 액체는 보통의 물 (밀도 = 1.0gm / cc 어떻게 점성 = 0.01dynes / cm)입니다.  계산 영역에 들어가는 물의 깊이는 15.5cm에서 속도가 임계에 가까운 123.0cm/s 였습니다.  물론, 중력은 수직 방향으로 크기는 g = -980cm / s^2입니다.

Figure 1a is from a simulation. For this example all of the geometric and material properties used in the experiments were used in the simulation. The height of the step used in the laboratory test is 62cm and the fluid is ordinary water (density=1.0 gm/cc and dynamic viscosity=0.01dynes/cm). The depth of water entering the computational region was 15.5cm and was given a near critical velocity of 123.0cm/s. Of course, gravity was in the vertical direction with magnitude g=-980cm/s^2.

Figure 1a. Simulation of flow over a step. Figure 1b. Grid used in simulation.

월류 왼쪽에 있는 웅덩이에 난류가 발생 할 것으로 예상 되었기 때문에, 시뮬레이션에서는 난류 모델 (the Renormalization Group, 즉 RNG 모델)을 사용했습니다.  그 후, 난류 모델을 사용하지 않고 한 시뮬레이션에서도 비슷한 결과를 얻을 수 있었지만, 이것은 그다지 놀라운 일이 아닙니다.  흐름의 중요한 요소의 대부분은 매끄러운 (즉 난류가 아닌) 유입, 유출, 월류 때문입니다.

Because some turbulence was expected to develop in the pool to the left of the overflow, a turbulence model (the Renormalization Group or RNG model) was used in the simulation. Subsequent simulations without a turbulence model produced very similar results, which is not too surprising since most of the important elements of the flow are smooth (i.e., non-turbulent) inflow, overflow and outflow streams.

그림 1b 시뮬레이션 영역은 폭 170cm, 높이 100cm에 가로 80 개, 세로 60 개, 총 4800 개의 셀로 구성되는 같은 크기의 사각형 셀의 격자로 세분화되어 있습니다.  이 격자는 유체 역학의 지배 미분 방정식 (나비에 – 스토크스 방정식)의 유한 차분 근사의 기초로 사용됩니다.  격자 셀의 수와 크기는 흐름 속에서 예측되는 최소의 특성을 파악하는 목적으로 선택되었습니다.  결과를보고 어떤 조정이 필요하다고 생각되는 경우는 숫자를 쉽게 늘리거나 줄일 수 있습니다.  사실, 해상도를 바꾸어 시뮬레이션을 반복하여 계산이 그러한 변화에 영향을 많이 들어 있지 않은지 확인하는 것이 좋습니다.

The simulation region shown in Fig. 1b is 170cm wide and 100cm high and has been subdivided into a grid of equal sized rectangular cells consisting of 80 cells in the horizontal direction and 60 cells in the vertical direction, for a total of 4800 cells. This grid is used as the basis for finite-difference approximations of the governing differential equations of fluid dynamics (the Navier-Stokes equations). The number and size of the grid cells was chosen with the goal of capturing the smallest expected features of the flow. The number can be easily increased or decreased if the results seem to warrant some adjustment. In fact, it is often a good idea to repeat a simulation with a change of resolution to make sure that the solution is not too sensitive to such changes.

왼쪽의 경계는 지정된 속도 경계입니다 (유체의 높이도 지정).  오른쪽의 경계는 유출 경계에서 모든 유량이 경계에 수직 제로 기울기이며, 균일 한 유출이 촉진됩니다.  상하 경계는 단단한 벽으로 세 번째 방향의 경계는 대칭면 (점성 저항 제로의 벽)으로 처리되었습니다.  계단 낙차형상의 표면도 자유-미끄럼(free slip) 경계로 처리되었습니다.
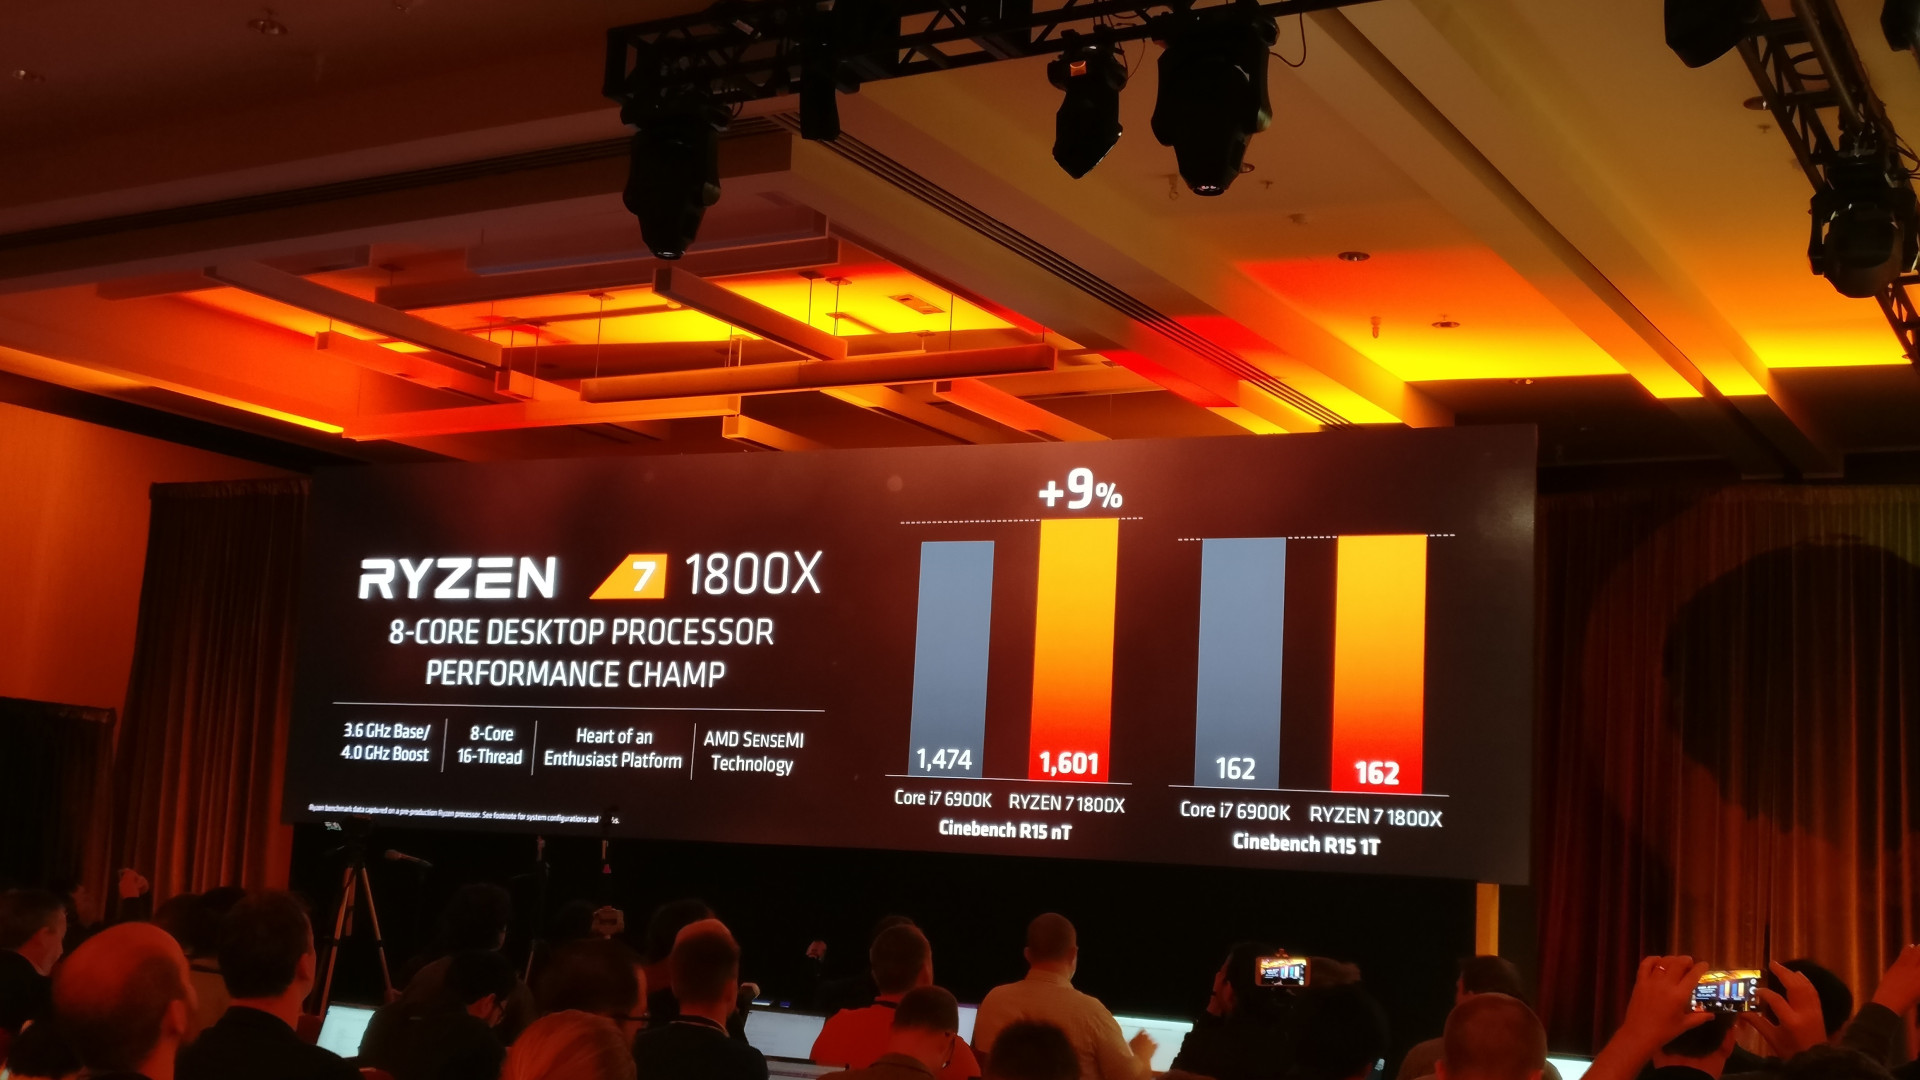
The left boundary was a specified velocity boundary (also with a specified fluid height). The right boundary was an outflow boundary where all flow quantities have a zero gradient normal to the boundary to encourage a uniform outflow. The top and bottom boundaries are rigid walls, while in the third direction the boundaries were treated as planes of symmetry (i.e., walls with zero viscous drag). The surface of the step was also treated as a free-slip boundary.

초기 조건은 예측되는 흐름의 배열을 대략적으로 근사하도록 설정할 수 있었지만, 흐름의 구성은 계산하고 싶은 것 중 하나이기 때문에 유체가 어떻게 분포되는지를 모르는 경우에는 간단한 방법이 필요합니다.  이 예제에서는 비정상 흐름 시뮬레이터를 사용했기 때문에 그림 1a의 계단 낙차형상에 유체의 블록만 있고 왼쪽 경계의 같은 수평 속도와 높이가 할당된 간단한 초기 조건을 정의할 수 있습니다.  시뮬레이션은 이후 정상 흐름으로 발전하고 있지만, 이것은 약 8.0 초 후에 발생합니다.  시뮬레이션은 정상 상태에 도달 한 것을 보장하기 위해, 10.0 초의 시간까지 실행되었습니다.  그림 2는 중간 시간을 두 보여줍니다.  도 2b는 0.2 초, 그림 2c는 0.5 초 시점에서 그림 2d는 마지막 10.0 초 시점을 보여줍니다.

Initial conditions could have been set to roughly approximate the expected flow arrangement, but since the flow configuration is one of the things that one would like to compute, especially for situations where one doesn’t know what the distribution of fluid is likely to be, a simpler approach is needed. Because a transient flow simulator was used for this example a simple initial condition could be defined that consisted of just a block of fluid on top of the step, Fig. 1a with the same horizontal velocity and height assigned to the left boundary. The simulation then followed the development of the steady flow, which occurs after about 8.0s. The simulation was run out to a time of 10.0s to assure that steady conditions had been reached. Figure 2 shows two intermediate times; 2.b at 0.2s and 2.c at 0.5s plus the final time in 2.d at 10.0s.

Figures 2a-2d. Simulation times of 0.0, 0.2, 0.5 and 10.0s.

처음에는 단일 결합하고 있는 자유 표면이었던 것이 액체가 바닥에 충돌한 후 2 개의 독립적인 자유 표면 (상하 스냅 표면)으로 변화하는 것에 주목하십시오.  아래 경계의 충격점의 좌우로 흐름이 분리되도 문제는 없습니다.  이에 대해서는 다음 섹션에서 자세히 설명합니다.

It should be noted that what starts as a single, connected free surface changes to two independent free surfaces (upper and lower nappe surfaces) after the fluid strikes the bottom. No difficulties are experienced with this separation of the flow into portions flowing to the left and right of the impact point on the bottom boundary. This will be discussed at further length in the next section.
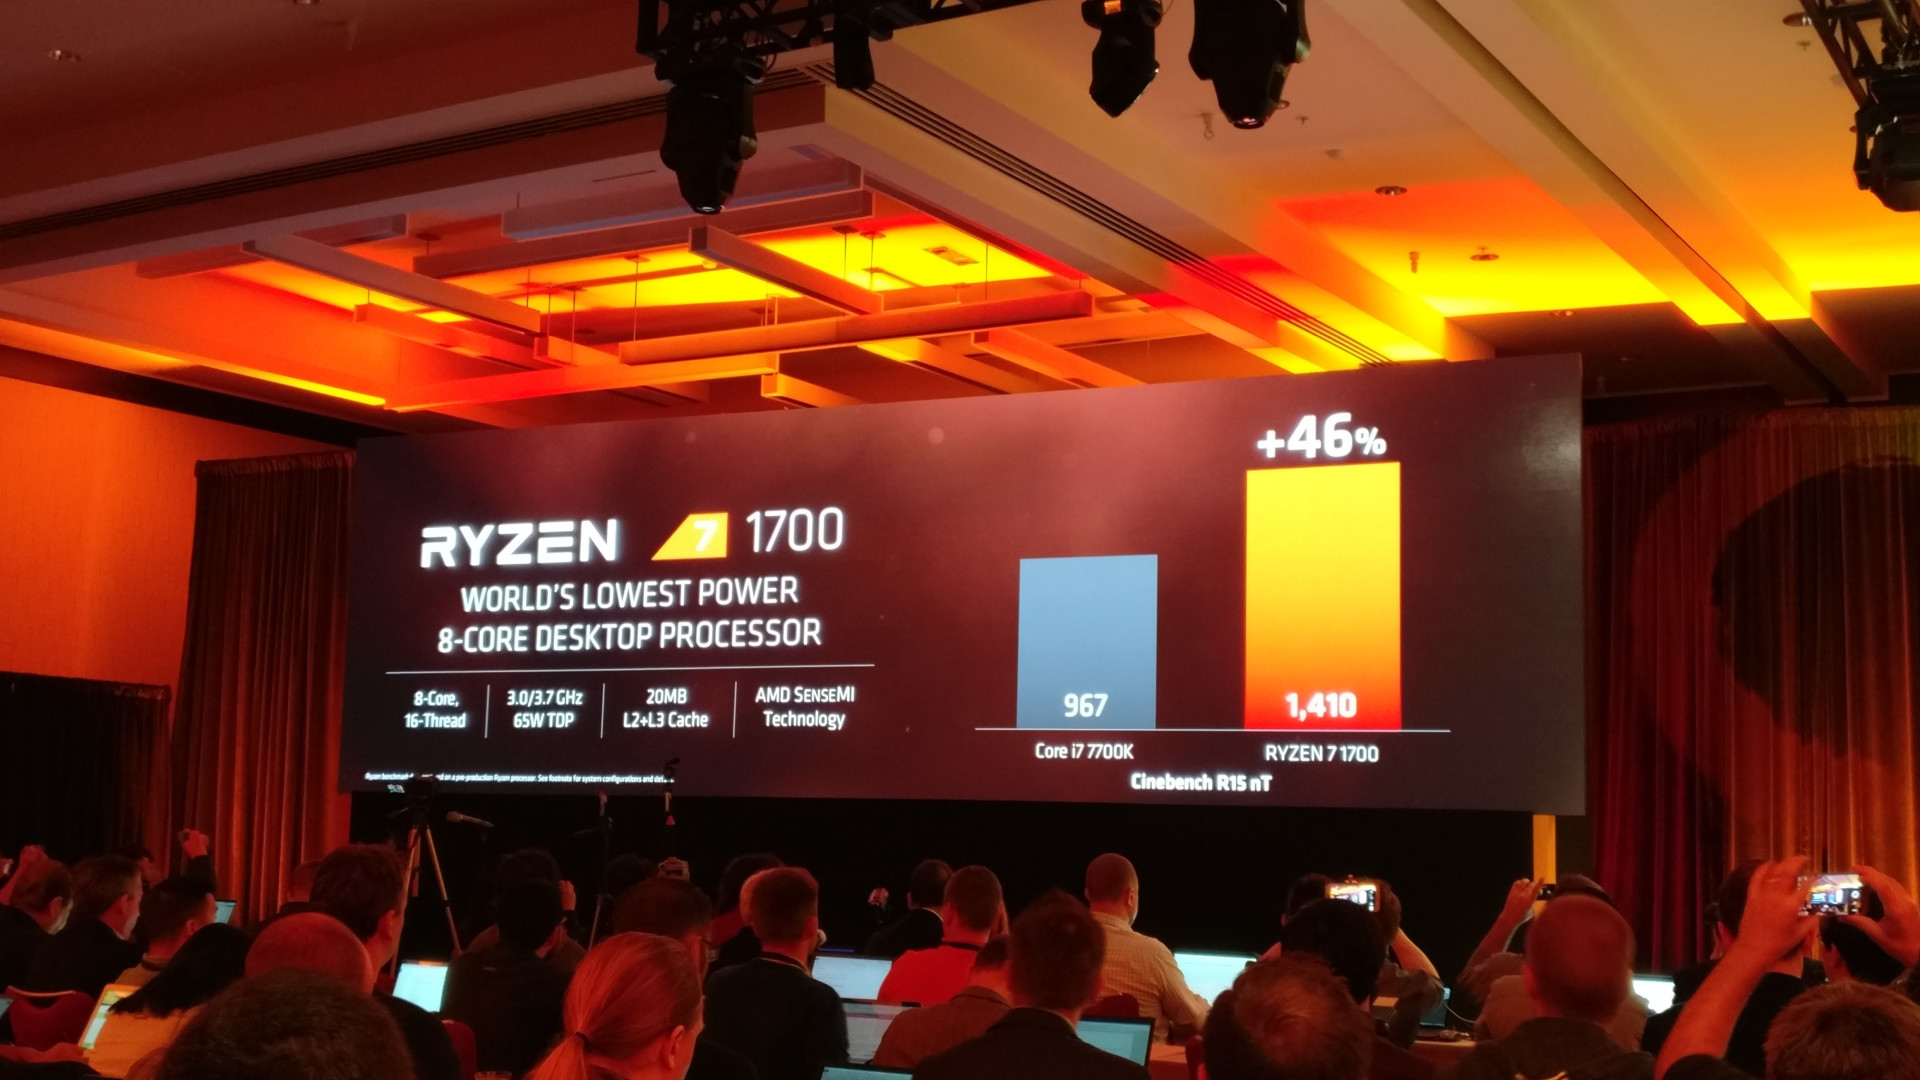
실험과 시뮬레이션의 비교는 다음 표와 같으며 매우 잘 일치하고 있습니다.

Comparisons between experiment and simulation are given in the following table and are in excellent agreement.

Comparison TableExperimental ResultsSimulation Results
Outflow Height/Step Height0.0940.094
Pool Height/Step Height0.410.41
Angle of Nappe at Bottom57°59°
Energy Loss/Initial Energy0.290.296

이러한 결과를 고려하면이 같은 정밀도를 달성하려면 상당한 계산시간이 필요할 것으로 생각될지도 모릅니다.  그러나 실제로는 Pentium 4, 3.20GHz의 데스크톱 컴퓨터의 총 CPU 시간은 단 88 초였습니다. 계산시간이 너무 짧은 것은 설명이 필요하며, 이것은 다음 섹션의 목적입니다.

In view of these results it might be expected that a considerable amount of computational time would be required to achieve such accuracy. In fact, the total cpu time on a desktop Pentium 4, 3.20GHz computer was only 88s. Such a short computational time requires explanation and that is the purpose of the following sections.

Figures 2a-2d. Simulation times of 0.0, 0.2, 0.5 and 10.0s.

Why the VOF Technique Works Well / VOF 법이 적합한 이유

VOF 법의 구조와 그것이 매우 효율적인 방법인 이유를 이해하기 위해 다양한 계산법 중에서도 특히 VOF 법에 대한 몇 가지 기본 개념을 나타냅니다.

There are a few general concepts about computational methods and the VOF technique in particular that can be used to gain an understanding of how and why VOF works so efficiently.

Basic Theory

모든 수치해석 방법에서 흐름의 문제를 단순하게 산술 계산하도록 유한의 수치 세트로 단순화해야합니다.  연속 유체를 이산화된 수치 세트에 근사하기 위해서 일반적으로 사용되는 것이 유체가 차지하는 공간을 격자로 분할하는 방법입니다.  이 격자는 일반적으로 다수의 작은 직사각형의 블록(요소)로 구성됩니다.  이러한 각 요소에 대해 평균화 처리를 실시함으로써 그 요소의 유체의 압력, 밀도, 속도 및 온도의 대표 값을 얻을 수 있습니다.

All numerical methods must use some simplification to reduce a fluid flow problem to a finite set of numerical values that can then be manipulated using elementary arithmetical operations. A typical procedure for approximating a continuous fluid by a discrete set of numerical values is to subdivide the space occupied by the fluid into a grid consisting of a set of small, often rectangular “bricks.” Within each element an averaging process is applied to obtain representative element values for the fluid’s pressure, density, velocity and temperature.

간단한 수식을 사용해, 어느 시간에 걸친 각 요소 값과 인접한 요소의 상호 작용을 근사할 수 있습니다.  예를 들어, 요소의 밀도는 그 요소와 인접 요소 사이에서 (질량 보존에 의한) 질량 유량이 교환된 경우에만 변경됩니다.  요소 사이에서 질량이 교환되는 물질의 속도는 운동량 보존 법칙에 의해 계산되며 일반적으로 나비에-스토크스 방정식으로 표현됩니다.  나비에-스토크스 방정식은 인접한 요소 사이에 작용하는 압력과 점성 응력을 이용하여 요소에서 변화하는 유체 속도를 근사합니다.

Simple equations can be devised to approximate how each element’s values interact with neighboring elements over time. For instance, the density of an element can only change when there is a net flow of mass exchanged between an element and its neighbors (i.e., conservation of mass). The material velocity that carries mass between elements is computed from the conservation of momentum principal, usually expressed in the form of the Navier-Stokes equations, which uses the pressures and viscous stresses acting between neighboring elements to approximate the changing fluid velocities in the elements.

이러한 요소와 인접 요소 사이의 상호 작용에 따른 아이디어는 편미분 방정식 근방의 양의 변화에 의해 생기는 작은 변화의 효과를 평가하는 것과 본질적으로 동일합니다.  공학계의 교과서에서 파생된 작은 컨트롤 볼륨을 사용하여 그 크기를 무한대까지 작게 한 근사치의 극한으로 편미분 방정식이 유도됩니다.  수치 시뮬레이션에서도 같은 방식을 취하고 있지만, 요소 수가 너무 많으면 추적이 어렵게  되어 컨트롤 볼륨의 크기를 최대한 작게 만들 수 없습니다.  실제 시뮬레이션 현상을 해결하는데 충분하고 계산 시간을 최소한으로 억제 할 수 있는 요소수를 설정하는 것이 목표입니다.

This idea of an element interacting with its neighbors is essentially what is meant by a partial differential equation; that is, evaluating the effects of small changes caused by the variation in quantities nearby. Partial differential equations are typically derived in engineering text books as the limit of approximations made with small control volumes whose sizes are then reduced to infinitesimal values. In a numerical simulation the same thing is done except that the control volume sizes cannot be taken to the limit because that would require too many elements to keep track of. In practice, the goal is to use enough elements to resolve the phenomena of interest, and no more, so that computing times are kept to a minimum.

요소에 사용되는 연산은 기본적으로 더하기, 빼기, 곱하기 및 나누기만 포함된 간단한 것입니다.  예를 들어, 요소의 질량의 변화는 일정한 시간 간격에 걸쳐 요소의 측면에서 유입 및 유출된 질량의 가산 및 감산에서 구할 수 있습니다. 그러나 시뮬레이션에서는 이러한 연산을 수천, 때로는 수백만 요소에 대해 매우 짧은 시간 간격에 대해 반복 계산해야합니다.  따라서 이러한 반복 계산의 고속 처리는 컴퓨터가 적합합니다.

Arithmetical operations associated with an element generally involve only simple addition, subtraction, multiplication and division. For instance, the change of mass in an element involves the addition and subtraction of mass entering and leaving through the faces of the element over a fixed interval of time. A simulation requires that these operations be done for thousands or even millions of elements as well as repeated for many small time intervals. Computers are ideal for performing these types of repetitive operations very rapidly.

자유 표면을 수반하는 유체 운동의 시뮬레이션에서는 형상이 변화하는 계산 영역을 다루어야합니다.  이 복잡성에 대응할 수있는 분석 방법이 아래에서 설명하는 VOF 법입니다.

Simulating fluid motion with free surfaces introduces the complexity of having to deal with solution regions whose shapes are changing. A convenient way to deal with this is to use the Volume of Fluid (VOF) technique described next.

The VOF Concept

VOF 법은 각 격자 셀의 체적 중 액체가 차지하는 비율, 즉 체적 점유율을 기록한다는 생각에 근거합니다.  일반적으로 부피 점유율은  F로 표시됩니다.  F는 부피 점유율이기 때문에 값이 취할 수있는 범위는 0.0 ~ 1.0입니다.

The VOF technique is based on the idea of recording in each grid cell the fractional portion of the cell volume that is occupied by liquid. Typically the fractional volume is represented by the quantity F. Because it is a fractional volume, F must have a value between 0.0 and 1.0.

액체 내부의 영역에서는 F 값은 1.0이 액체의 외부, 즉 (공기 등) 기체 영역에서 F 값은 0입니다.  F 값이 0.0과 1.0 사이에서 변화하는 장소가 자유 표면이 존재하는 위치입니다.  즉 0.0보다 크고 1.0보다 작은 F 값을 가지는 요소는 반드시 표면을 가지고 있습니다.

In interior regions of liquid the value of F would be 1.0, while outside of the liquid, in regions of gas (air for example), the value of F is zero. The location of a free surface is where F changes from 0.0 to 1.0. Thus, any element having an F value lying between 0.0 and 1.0 must contain a surface.

여기서 유의해야 할 것은 VOF 법에서 자유 표면을 직접적으로 정의하는 것이 아니라 벌크 유체의 위치를 정의한다는 점입니다.  이렇게하면 계산상의 어려움을 초래하지 않고 유체 영역을 결합 또는 분할 할 수 있습니다.  자유 표면은 단순히 유체의 체적 점유율이 1.0과 0.0 사이에서 변화하는 장소로 정의됩니다.  이것은 자유 표면을 수반하는 거의 모든 문제에 적용 할 수 VOF 법의 뛰어난 특징이기도합니다.

It is important to emphasize that the VOF technique does not directly define a free surface, but rather defines the location of bulk fluid. It is for this reason that fluid regions can coalesce or break up without causing computational difficulties. Free surfaces are simply a consequence of where the fluid volume fraction passes from 1.0 to 0.0. This is a very desirable feature that makes the VOF technique applicable to just about any kind of free surface problem.

또한 격자의 각 요소에 단일 수치 (F)를 할당하여 유체의 위치를 기록 할 수 있는 점도 VOF 법의 중요한 특징입니다.  이것은 평균값을 기준으로 압력과 속도 등 다른 모든 유체 물성의 기록과 완전히 일치합니다.

Another important feature of the VOF technique is that it records the location of fluid by assigning a single numerical value (F) to each grid element. This is completely consistent with the recording of all other fluid properties in an element such as pressure and velocity components by their average values.

Some Details of the VOF Technique

Figure 3. Surface in 1D column of elements.

정확도를 위해 요소 내에 자유 표면을 배치하는 방법을 갖는 것이 바람직합니다. 인접 요소의 F 값을 고려하면 이를 쉽게 할 수 있습니다.  예를 들어, 열의 일부에 액체가 충전되어있는 1 차원 요소를 상상하십시오 (그림 3).  액체의 표면은 열 중앙 영역의 요소에 있습니다.  이것을 표면 요소라고합니다.  여기에서는 표면 요소를 제외하고 F 값은 0.0 또는 1.0이어야한다고 가정하고 있기 때문에 이를 사용하여 표면의 정확한 위치를 파악할 수 있습니다.  우선, 표면이 표면 또는 바닥을 확인하는 테스트를 실시합니다.  표면요소에 대해 액체가 없을 경우에는 표면으로 간주합니다.  위의 요소에 액체가 들어있는 경우는 물론, 그 표면은 바닥입니다.  윗면에 관해서는 정확한 위치는 표면 요소의 아래쪽에서 위쪽으로 요소의 세로 크기를 F 배 한 거리에있는로 계산합니다.  바닥도 마찬가지로 표면 요소의 상단에서 아래로, 요소의 세로 크기를 F 배 한 거리에 있습니다.  이 방법에 의한 요소의 표면 위치의 특정은 요소 내의 액체의 부피 점유율로 F를 정의한 후에 합니다.

For accuracy purposes it is desirable to have a way to locate a free surface within an element. Considering the F values in neighboring elements can easily do this. For example, imagine a one-dimensional column of elements in which a portion of the column is filled with liquid, Fig. 3. The liquid surface is in an element in the central region of the column, which will be referred to as the surface element. Because we assume the values of F must be either 0.0 or 1.0, except in the surface element, we can use this to locate the exact position of the surface. First a test is made to see if the surface is a top or bottom surface. If the element above the surface element is empty of liquid, the surface must be a top surface. It the element above is full of liquid then, of course, the surface is a bottom surface. For a top surface we compute its exact location as lying above the bottom edge of the surface element by a distance equal to F times the vertical size of the element. A bottom surface is similarly located a distance equal to F times the vertical size of the element below the top edge of the surface element. Locating the surface within an element in this way follows from the definition of F as a fractional volume of liquid in the element.

1 차원 열의 표면 위치 계산은 간단하고 정확하며 계산이 거의 필요없습니다. 그러나 2 차원 및 3 차원의 경우 하나의 표면 셀에 연속적인 표면 방향이 존재할 가능성이 있기 때문에 위치 계산은 조금 복잡해집니다.  그럼에도 불구하고 이를 취급하는 것은 어렵지 않습니다.  그림 4의 이차원의 예는 표면의 위치를 계산할 뿐만 아니라 경사와 곡률도 이해할 수 있는 쉬운 방법을 보여줍니다.

Calculating surface locations in one-dimensional columns is simple, accurate and requires very little arithmetic. In two and three dimensional situations, however, computing a location is a little more complicated because there is a continuous range of surface orientations possible within a surface cell. Nevertheless, dealing with this is not difficult. A two-dimensional example, Fig. 4, will illustrate a simple way to not only compute the location of the surface, but also to get a good idea of its slope and curvature.

Figure 4. Surface in 2D grid of elements.

1 차원의 경우처럼 먼저 인근 요소를 테스트하여 표면의 대략적인 방향을 찾아야합니다.  그림 4는 바깥 쪽의 법선이 상승 방향에 가장 가깝게 됩니다.  이것은 그 방향 밖의 값의 차이가 다른 방향보다 크기 때문입니다.  그럼 거의 수직으로 있는 요소 열에서 표면의 국소적인 높이가 계산됩니다.  그림 4의 2 차원의 경우에는 이러한 높이가 화살표로 표시되어 있습니다.  마지막으로, 표면 요소를 포함하는 컬럼의 높이에 따라 그 요소의 표면의 위치를 확인합니다.  다른 2 개의 높이를 사용하면 국소적인 표면 경사와 표면 곡률을 계산할 수 있습니다.

As in the one-dimensional case, it is first necessary to find the approximate orientation of the surface by testing the neighboring elements. In Fig. 4 the outward normal would be closest to the upward direction because the difference in neighboring values in that direction is larger than in any other direction. Next, local heights of the surface are computed in element columns that lie in the approximate normal direction. For the two-dimensional case in Fig. 4 these heights are indicated by arrows. Finally, the height in the column containing the surface element gives the location of the surface in that element, while the other two heights can be used to compute the local surface slope and surface curvature.

3 차원에서도 동일한 절차를 사용하지만, 표면 요소의 주위에 있는 9개의 열에 대해 열 높이를 요구해야합니다.  필요한 계산은 조금 더 걸리지만, 주된 내용은 열의 간단한 덧셈과 경사와 곡률을 추구하는 열의 높이의 합과 차이가 있습니다.  이 토론을 토대로, 이제 자유 표면을 정의하는 데 필요한 모든 정보를 빠르고 쉽게 평가하기 위해 부분 유체 체적을 사용하는 방법을 알아야합니다.

In three-dimensions the same procedure is used although column heights must be evaluated for nine columns around the surface element. Although a little more computation is needed, it consists primarily of simple summations in the columns and then sums and differences of column heights for evaluating the slope and curvature. Based on this discussion, the reader should now see how the fractional fluid volume can be used to quickly and easily evaluate all the information needed to define free surfaces.

다루어야 할 문제가 앞으로 2 개 남아 있습니다.  하나는 그림 1 및 2와 같은 시뮬레이션은 유체가 존재하는 영역에는 유체 역학만으로 해결합니다.  이것은 VOF 법의 계산 효율이 높은 또 하나의 이유입니다.  계단 형상의 낙하류의 문제로 유체가 차지하는 영역은 계산 격자의 오픈 공간의 절반 이하입니다.  액체를 둘러싼 기체의 흐름을 계산할 필요가 있다면 필요한 계산 시간이 크게 늘어납니다.  그러나 액체만으로 계산을 할 경우 자유 표면 경계 조건을 지정해야합니다.  이 조건은 접선 응력의 소실과 기체의 압력에 동일한 표준 압력을 표면에 추가하는 것입니다.

There are two remaining issues to deal with. One issue is that a simulation like that in Figs. 1 and 2 is only solving for the fluid dynamics in regions where there is fluid. This is another reason for the computational efficiency of the VOF method. The region occupied by fluid in the flow over a step problem is much less than half of the open region in the computational grid. If it were necessary to also solve for the flow of gas surrounding the liquid, then considerably more computational time would be required. In order to perform solutions only in the liquid, however, it is necessary to specify boundary conditions at free surfaces. These conditions are the vanishing of the tangential stress and application of a normal pressure at the surface that equals the pressure of the gas.

두 번째 문제는 자유 표면이 유체와 함께 움직일 때의 움직임과 변형을 유체 점유율 변수 F를 구함으로써 계산해야 한다는 것입니다.  변수 F는 불연속 (주로 0.0 또는 1.0)이기 때문에 계산 격자를 이동할 때 이 불연속성이 유지되도록주의해야합니다.  VOF 법은이 목적으로 특수 이류(advection) 알고리즘이 사용되고 있습니다.

A second issue is that movement and deformation of a free surface must be computed by solving for the fraction of fluid variable, F, as it moves with the fluid. Because the variable F is discontinuous (i.e., primarily 0.0 or 1.0) some care must be taken to maintain this discontinuity as it moves through a computational grid. In the VOF method, special advection algorithms are used for this purpose.

Illustration of Free-Surface Tracking by VOF Technique

그림 6a는 이것의 적합 여부를 보여줍니다.  유체의 체적 점유율은 격자 요소마다 균일하게 분류되고 그 요소의 값을 나타냅니다.  자유 표면은 거의 모든 곳에서 선명하게 정의되어 있습니다.  스냅의 가장 낮은 가장 좁은 부분에만 선명한 유체 분포의 손실을 확인할 수 있습니다 (그림 5b).  이것은 예상대로입니다.  이 영역에서는 스냅의 두께는 3 가지 요소보다 작고, 따라서 부분 충전된 표면 요소에 연결된 작은 F 값이 어떤 중심 요소 (값 1.0)에 혼입하기 때문입니다.  계산 목적으로 이 것은 별로 문제가 되지 않습니다.  이 시뮬레이션 방법은 액체 내부의 요소는 순수한 액체 성분과 같은 방식으로 처리되기 때문입니다.

Figure 6a is an illustration of how well this works; the fluid volume fraction is colored uniformly in each grid element to represent its value in that element. The free surface is sharply defined nearly everywhere. Only in the lowest and narrowest part of the nappe is there any noticeable loss of a sharp fluid fraction distribution, Fig. 5b. This was expected because in this region the nappe is less than three elements in thickness and this allows some of the smaller F values associated with partially filled surface elements to mix in with the central element, which should have a value of 1.0. For computational purposes this doesn’t really matter because the simulation method treats elements interior to the liquid as though they are pure liquid elements.

그림 5b에 나타내는 영역에서는 실제 실험에서 난류 및 공기 혼입이 관찰된 것도 지적해 두지 않으면 안됩니다.  따라서 유체 점유율의 값을 1보다 조금 작게 보이는 것이 다소 현실적입니다.  이것은 전혀 의외라는 것은 없습니다.  난류와 공기 유입을 담당하는 풀의 액체 제트의 교점은 난류와 공기 유입의 원인이 되지만, 유체 점유율 값(fluid fraction values )은 액체 내부에 “유입” 원인이 되기 때문에 실수가 아닙니다.

It should also be pointed out that in the region shown in Fig. 5b turbulence and air entrainment are observed in actual experiments. Thus, the appearance of fluid fraction values a little less than unity is somewhat realistic. This is not entirely accidental because the intersection of jet of liquid with a pool, which is responsible for turbulence and air entrainment, is also responsible for the “entrainment” of fluid fraction values into the interior of the liquid.

Figure 5a (left): Fluid fraction values in elements, showing sharpness of surface definition. Figure 5b (right): Close up of fluid fraction values where the overflow hits bottom.

Summary

처음에는 컴퓨터가 단순히 반복적인 산술 연산을 수행하고, 복잡하고 시간에 의존적인 유체 역학 문제에 대해, 현실적인 시뮬레이션을 할 수 있다는 것이 다소 마술처럼 보일 수 있습니다. 이 논의의 목적은 비교적 기본적인 절차로 이를 수행하는 접근법을 설명하는 것입니다.

간단하지만 사소한 유압 흐름 예제를 사용하여 계산된 시뮬레이션이 물리적인 측정 결과와 매우 일치하는 세부 결과를 생성 할 수 있음이 입증되었습니다. VOF (Volume of Fluid) 기술을 기반으로 한 시뮬레이션은 정확하고, 매우 효율적인 것이 추가로 입증되었습니다.

분명하게, 수력 발전소에서 사용되는 것과 같은 복잡한 유압 구조와 관련된 실제 예는 유용한 결과를 얻기 위해서는 이 예에서 사용되는 몇 초 이상의 많은 계산 시간을 소비해야합니다. 그럼에도 불구하고 이러한 결과는 합리적인 시간 (사람과 컴퓨터 모두)에서 수행 될 수 있으며, 실제 실험에서는 거의 불가능한 세부 사항들을 포함합니다. 또한, 지오메트리, 유동 조건 또는 유체 특성의 거의 모든 종류의 변화의 영향을 쉽게 테스트 할 수있는 능력은 시뮬레이션을 사용하는 또 다른 강력한 이유입니다. 기술의 발전에 따라 hydraulic flow 시뮬레이션을 위한 현재 소프트웨어 및 하드웨어는 기존의 물리적 모델링에 비해 상당한 비용 이점을 제공합니다.

At first it may seem somewhat magical that a computer can simply perform repeated arithmetic operations on arrays of numbers and produce a realistic simulation of a complex, time-dependent, fluid dynamics problem. It was the purpose of this discussion to explain an approach that does this with relatively elementary procedures.

Using a simple, but non-trivial, hydraulic flow example it has been demonstrated that computational simulations can produce detailed results in excellent agreement with physical measurements. It has been further demonstrated that the simulation, which was based on the Volume of Fluid (VOF) technique, uses simple approximation methods that are both accurate and efficient.

Clearly, real world examples involving complex hydraulic structures such as those used in hydroelectric power stations, must consume more than the few seconds of computational time used in our example to obtain useful results. Nevertheless, those results can be generated in reasonable times (both man and computer) and contain a richness of detail rarely possible in physical experiments. For examples visit our water and environmental application pages. In addition, the ability to easily test the influence of just about any kind of change in geometry, flow condition or fluid property is another powerful reason to employ simulations. Current software and hardware for hydraulic flow simulations offer a significant cost advantage over traditional physical modeling.

Postscript

The first detailed description of the VOF method was in 1981 by C.W. Hirt and B.D. Nichols, J. Comp. Phys., 39, p.201. All simulations appearing in this article were performed with the commercial software package FLOW-3D developed by Flow Science, Inc. This program uses an enhanced variant of the VOF concept called TruVOF.

본 자료는 국내 사용자들의 편의를 위해 원문 번역을 해서 제공하기 때문에 일부 오역이 있을 수 있어서 원문과 함께 수록합니다. 자료를 이용하실 때 참고하시기 바랍니다.

Fuel Tanks

Fuel Tanks

차량의 연료 탱크는 안전하게 연료를 저장하기 위한 필수적인 장치입니다. 또한 운행 중 차량에 들어오는 다양한 형태의 외력에 대해 일정하고도 적당한 연료 공급을 보장해 주는 장치입니다. 연료탱크는 차량 섀시 디자인과 바디 패널과 소형화의 목적을 위해 모양이 복잡 할 수 있습니다. 차량이 가속 할 때, 연료는 연료 레벨 게이지, 압력 및 전달 시스템에 문제를 유발할 수 있는 탱크 내에서 슬러싱하게 됩니다. 연료 충전은 특히 펌프류에서 중요한 부분인데, 탱크 안에서 증기 압축성은 충전 노즐의 초기 닫힘(Shutoff)을 일으키는 원인이 됩니다. 또한, 정전기는 연료 시스템 내에서 전위의 상승에 기인하여 연료 탱크 내로 이송 될 수 있습니다. FLOW-3D는 연료 시스템 설계 및 개선을 돕기 위해 이러한 복잡한 다상(multi-phase), 다물리(multi-physical), 과도(transient) 해석을 할 수 있는 도구 입니다.

Simulation of gas filling of a tank, modeling air entrainment.

Other analysis capabilities:

  • An electrostatic model that can capture a charge distribution with time
  • Fuel level indication using the Moving Objects model with 6 degrees of freedom to capture float variations
  • Fuel line pressurization
  • Optimal location of vents

Aerospace Laval Nozzles

Laval Nozzles

FLOW-3D는 자유 표면 흐름을 모델링하는데 세계에서 가장 정확한 CFD 도구로 알려져 있지만, 대부분의 연구자들은 라발 노즐 등을 시뮬레이션 할 수 있는 강력한 압축성 유동 능력을 가지고 있음을 알지 못합니다. 라발 노즐은 모래 시계 모양을 가진 중간이 좁은 관입니다. 이것은, 노즐을 통과하는 가스의 유동을 촉진하는 방법으로 사용됩니다. 이러한 노즐은 로켓 및 초음속 제트 엔진뿐만 아니라 특정 증기 터빈에도 사용됩니다.

Cavitation in Laval Nozzles

유속이 빨라질수록 유선의 휘어짐으로 인한 영향이 커지기 때문에 국부적으로 수압이 매우 낮아지는 곳이 나타난다. 압력이 증기압보다 낮아지면 액체가 기화하거나 또는 녹아 있던 공기 등이 기포로 되기 때문에 공동(空洞)이 발생한다. 이 현상을 공동 현상 또는 캐비테이션이라 한다

스크루형 추진기를 예를 들면 추진기가 엔진에 의해 회전하면 물을 뒤로 밀어내게 되고 그 반작용으로 추진력이 생겨 선박을 전진시킨다. 프로펠러는 여러 개의 날개를 갖고 있고, 이 날개들이 회전하면 한쪽 면은 물을 뒤로 밀어내고 다른 면은 앞쪽의 물을 빨아들이게 된다. 물을 밀어내는 면은 압력이 높아지고, 빨아들이는 면은 압력이 낮아지게되어 앞뒤간의 압력차가 발생하게 되고 전진 방향으로 추진력을 받게 된다. 위와 같은 방식으로 프로펠러가 움직일 때에 프로펠러 주위에서 압력이 급강하하게 되면 온도의 변화가 아닌 압력 변화에서 기인하는 물의 상변화가 발생하게 되는데 이를 캐비테이션 현상이라 한다.

아래의 실험 비교는, FLOW-3D에서 수행한 시뮬레이션이 planar-Laval nozzle을 통한 유동 실험과 잘 일치가 된 것을 볼 수 있습니다.


Helium flow through a rectangular convergent-divergent Laval nozzle is simulated using FLOW-3D. Helium at room temperature is forced through the convergent section of the nozzle using an inlet pressure of 6.9E5 N/m2 while maintaining a low outlet pressure of 0.1N/m2.

Roll Coating

Roll Coating

롤 코팅 공정은 직물, 접착제 및 실란트를 다루는 산업을 포함한 다양한 산업에서 일반적으로 많이 사용하는 공정입니다. FLOW-3D는 공정 엔지니어와 과학자에게 다양한 재료 특성과 코팅 방식을 평가하여 결함의 원인을 식별하고 롤 코팅 공정 매개 변수를 최적화 할 수있는 기능을 제공합니다.

1-D Gradient generator with de-coupled convection and diffusion

이러한 예에서 속도 유선은 롤 코팅 공정에서 흔히 볼 수있는 전방 (상단), 후방 (중간) 및 고갈 (하단) 작동 방식에 대해 플롯됩니다. FLOW-3D는 연구자들에게 롤 속도 및 재료 특성과 같은 요소와 동적 접촉 라인의 안정성에 미치는 영향뿐만 아니라 공기 혼입, 리브 및 비 균일 에지 프로파일과 같은 결함에 대한 기여도를 분석 할 수있는 기능을 제공합니다.

인쇄 공정 중 산업에서는 종종 인쇄면에 잉크를 전달하고 적용하는 롤 코팅(roll coating) 이라고 불리는 기술을 사용합니다. 이 공정에서 통상적으로 잉크 유액은 두 개의 회전하는 실린더 사이의 좁은 갭(gap)으로 흘러 들어갑니다.

FLOW-3D를 사용하는 이 1D microfluidic palette 시뮬레이션에서 주 중앙 마이크로 채널에서 대류 Cells의 clean decoupling을 플롯된 유선을 통해 확인할 수 있습니다. 이 흐름은 모두 대류 장치에만 제한되며 단일 장치조차도 마이크로 채널로 누출되지 않아 대류 및 확산의 탁월한 분리를 나타냅니다. 소스 농도의 변화는 플롯에서 볼 수 있으며 애니메이션이 끝날 때까지 시각적으로 일정해집니다.

Ribbing Instabilities

아래에 표시된 전 방향 롤 코팅 시뮬레이션에서 FLOW-3D는 Lee, et al [1]에 설명 된대로 증가 된 롤 속도와 관련된 리브 불안정성의 시작을 정확하게 포착합니다. 이 모델은 단일 유체 VOF, 표면 장력 및 점도를 구현하여 생산에서 볼 수있는 이러한 불안정성의 복잡한 특성을 포착합니다.

Cascade Defects

아래 시뮬레이션에서 FLOW-3D는 포워드 롤 코팅 공정에서 cascade defect을 포착합니다. 상단 웹 롤러의 증가된 롤 속도로 인해, 동적 접촉 라인이 불안정해져 공기가 코팅액에 유입 될 수 있습니다.

Reference

[1] Lee, J. H., Han, S. K., Lee, J. S., Jung, H. W., & Hyun, J. C. (2010). Ribbing instability in rigid and deformable forward roll coating flows. Korea Australia Rheology Journal, 22(1), 75-80.

Gravure Coating

Gravure Coating

그라비아 코팅(Gravure coating)은 그라비아 롤이라고하는 홈이 새겨진 실린더에서 움직이는 기판으로 유체를 전달합니다. 그라비아 롤은 표면에 새겨진 작은 홈 또는 cells로 패턴이 지정됩니다. 실린더는 유체의 소스 주위를 회전하고, 마지막으로 doctor blade에 의해 불필요하게 남겨진 잉크가 제거되게 됩니다. 각 cell의 컵 모양은 실린더가 닥터 블레이드를 지나갈 때 유체를 제자리에 고정합니다. cell의 패턴, 깊이 및 모양은 기판에 코팅의 무게와 모양을 결정합니다.

아래에 표시된 FLOW-3D 시뮬레이션은 증착에 대한 셀 깊이의 영향을 보여줍니다. 이 모델은 30 미크론과 53.3 미크론의 두 셀 깊이를 비교합니다. 30 마이크론 셀 깊이는 훨씬 더 균일한 증착을 가능하게 하여 결과적인 코팅으로 전달됩니다.

Gravure Printing Example

아래의 예는 하나의 사각형 셀과 하나의 피라미드 모양의 그라비아 셀의 3D 이미지를 시간 배열로 보여줍니다. 주의해서 보면 코팅 비드(coating bead)가 컨텍 라인이 셀 안으로 움직일 수 있는 것보다 빠르게 블레이드(brade)의 움직임으로 인해 진행되는 것을 볼 수 있습니다. 그 결과로 공기 기포가 포획되며 이는 셀 안이 부분적으로는 유체로 체워지고, 부분적으로는 공기로 채워지는 현상을 나타나게 됩니다.

Reference

[1] Lee, J. H., Han, S. K., Lee, J. S., Jung, H. W., & Hyun, J. C. (2010). Ribbing instability in rigid and deformable forward roll coating flows. Korea Australia Rheology Journal, 22(1), 75-80.

FLOW-3D/MP Performance Benchmarks

HPC Benchmarks

HPC벤치 마크

아래에는 물 및 환경, 금속 주조, 미세 유체 역학, 항공 우주 등 소프트웨어의 일반적인 응용 분야에 대한 HPC지원 FLOW-3D v12.0의 성능 분석 및 최대 2560개 코어까지 확장되는 것으로 나타난 lid-drived캐비티 시뮬레이션에 대한 전형적인 CFD벤치 마크 검증이 나와 있다.

하드웨어 정보

Skylake – Intel® Xeon® Gold 6148 CPU @ 2.40GHz, 40 Cores/Node, 384GB/Node RAM
Interconnect – Intel Omni-Path®

물과 환경–HYDRAULICJUMP

이 시뮬레이션에서 유압 점프와 레일 위의 전체 흐름이 연구되었습니다.
메쉬:146만개 셀
실제 모델: 동적으로 계산된 최대 난류 혼합 길이의 자유 표면 추적, 중력, 공기 침투 및 RNG난류 모델
수치 모델:GMRERE

고압 분사–엔진 블록

이 시뮬레이션에서는 엔진 블록의 중력 주조를 연구했습니다.
메쉬:360만개 셀
물리적 모델: 자유 표면 추적, 중력, 열 전달, 응고 및 점성 층류
수치 모델:GMRERE

마이크로 데이터–PrinterNOZ내의 INKDROP LE

이 시뮬레이션에서 프린터 노즐의 잉크 방울의 형성과 배출을 연구했습니다.
메쉬:200만개 셀
물리적 모델: 자유 표면 추적, 층류 점성 및 표면 장력
수치 모델:GMRERE

AEROspace–항공기 연료 탱크 부싱

이 시뮬레이션에서는 다양한 비행 조건에서 F-16항공기 연료 탱크에서 연료 슬로싱을 연구했다.
메쉬:0.7만개 셀
물리적 모델: 동적으로 계산된 최대 난류 혼합 길이를 가진 자유 표면 추적, 비이상적 기준 프레임, 중력, 전기 전위 및 RNG난류 모델
수치 모델: ImplicitAdvection, GMrrs 및 분할 LagrangianVOF

BestCaseSCENARIO–LiDDrivenCavity

표준 뚜껑 구동 공동 문제는 FLow-3D의 스케일링 잠재력을 보여 주기 위해 시뮬레이션되었다. 이 시뮬레이션은 표준 CFD코드 검증에 자주 사용되는 완전하게 채워진 완벽한 부하 분산 시뮬레이션입니다.
메쉬:10.0만 셀
물리적 모델: 점성과 RNG난류.
수치 모델:GMRERE

자세한 내용은 STI C&D 솔루션팀에 문의하시기 바랍니다.
flow3d@stikorea.co.kr or 02-2026-0455, 02-2026-0450.

항공/우주 분야

Aerospace

항공 우주 분야에서 연구하는 엔지니어를 위해 FLOW-3D는 정확한 액체/가스 인터페이스(자유 표면) 모델링, 열 솔루션을 사용하여 연료 안정성 확보, 극저온 온도 조절, PMD(Propellent management devices), 캐비테이션 및 전하 분포에 대한 귀중한 통찰력을 제공합니다. 위상 및 정전기 물리 모델을 사용합니다.

항공 우주 분야에서 FLOW-3D의 성공적인 사용을 보여주는 기술 문서로 이동하기

Aerospace Simulations

FLOW-3D sloshing, 무중력 유체역학(zero gravity fluid dynamics), 다상유동(multi-phase fluids), 탄성 멤브레인(elastic membranes), 음속 및 초음속 상태에서 노즐(nozzles in subsonic and supersonic conditions), 유체구조의 상호 작용(fluid structure interactions) 등 항공분야에서 볼 수 있는 자연현상을 정확하게 표현하기 위해 자유표면 알고리즘을 고려하고 있습니다.

Bibliography

Models

  • Air Entrainment
  • Turbulence
  • Surface Tension
  • More Modeling Capabilities

Conference Proceedings


관련 기술자료

The Fastest Laptops for 2024

FLOW-3D 수치해석용 노트북 선택 가이드

2024년 가장 빠른 노트북 PCMag이 테스트하는 방법 소개 : 기사 원본 출처: https://www.pcmag.com/picks/the-fastest-laptops CFD를 수행하기 위한 노트북 선정 기준은 별도로 ...
재사용 무인 우주비행체 고도화기술(ReUSV) 심포지엄 2023

재사용 무인 우주비행체 고도화기술(ReUSV) 심포지엄 안내

아래와 같이 재사용 무인 우주비행체 고도화기술(ReUSV) 특화연구센터 센터에서 금년 첫 회를 맞이하는 ReUSV 심포지엄을 개최한다고 합니다. 아래에 초대장 전문을 소개합니다 ...
Experiments and analysis of dynamic characteristics of liquid sloshing in horizontal Cassini tank

수평 Cassini 탱크에서 액체 슬로싱의 동적 특성에 대한 실험 및 분석

Experiments and analysis of dynamic characteristics of liquid sloshing in horizontal Cassini tank Houlin Luo1, Wenjun Wu2, Bingchao Jiang3, Shouyi ...
Fig. 1 Oscillation of a free surface due to the step reduction of gravity acceleration from kzi ≈ 9.81 to kz ≈ 0

Reorientation of Cryogenic Fluids Upon Step Reduction of Gravity

단계적 중력 감소 시 극저온 유체의 방향 전환 Malte Stief∗, Jens Gerstmann∗∗, and Michael E. Dreyer∗∗∗ZARM, Center of Applied Space ...
Figure 1: Drawing of the experimental set-up, Figure 2: Experimental tank with locations of temperature sensors

실험 및 수치 시뮬레이션에 기반한 극저온 추진제 탱크 가압 분석

Analyses of Cryogenic Propellant Tank Pressurization based upon Experiments and Numerical SimulationsCarina Ludwig? and Michael Dreyer***DLR - German Aerospace Center, ...
Temperature contours& velocity vectors just after spray off

NASA Perspectives on Cryo H2 Storage

Cryo H2 저장에 대한 NASA의 관점 DOE Hydrogen Storage WorkshopMarriott Crystal GatewayArlington, VAFebruary 15, 2011David J. ChatoNASA Glenn Research CenterMichael ...
Fig. 6 LH2 isotherms at 1020 s.

액체-수소 탱크를 위한 결합된 열역학-유체-역학 솔루션

Coupled thermodynamic-fluid-dynamic solution for a liquid-hydrogen tank G. D. Grayson Published Online:23 May 2012 https://doi.org/10.2514/3.26706 Read Now Tools Share Introduction ...
Prediction of the ullage gas thermal stratification in a NASP vehicle propellant tank experimental simulation using FLOW-3D

Prediction of the ullage gas thermal stratification in a NASP vehicle propellant tank experimental simulation using FLOW-3D

As part of the National Aero-Space Plane (NASP) project, the multi-dimensional effects of gravitational force, initial tank pressure, initial ullage ...
Fig. 2 Modeling of bubble point test apparatus (left) and computational grid (righ

Flow-3d를 이용한 표면장력 탱크용메시스크린모델링

Modeling of Mesh Screen for Use in Surface TensionTankUsing Flow-3d Software Hyuntak Kim․ Sang Hyuk Lim․Hosung Yoon․Jeong-Bae Park*․Sejin Kwon† ABSTRACT ...
Fig. 1. A typical Boiling Water Reactor (BWR) and selected segment of study for simulation

Understanding dry-out mechanism in rod bundles of boiling water reactor

끓는 물 원자로 봉 다발의 건조 메커니즘 이해 Liril D.SilviaDinesh K.ChandrakercSumanaGhoshaArup KDasbaDepartment of Chemical Engineering, Indian Institute of Technology, Roorkee, ...

FlowSight

FlowSight

FlowSight는 FLOW-3DFLOW-3D CAST결과의 정교한 시각화를 제공하도록 설계된 고급 후 처리 도구입니다. FlowSight는 직관적인 후처리 인터페이스 내에서 우수한 결과 분석 기능을 갖춘 모델을 제공합니다. 스플 라인 경로를 따라 임의의 2D클립, 3D클립 및 투명도, 볼륨 렌더링, 고급 데이터 타임 시리즈 플로팅, 간소화 및 벡터 플롯은 사용 가능한 놀라운 도구의 일부에 불과합니다. FlowSight를 사용하면 여러 뷰 포트와 동적 객체 시각화 도구로 구성된 풍부한 기능 세트와 결합되어 있으므로 엔지니어는 분석 및 프레젠테이션 요구 사항에 맞게 CFD결과를 최대한 활용할 수 있습니다.

FlowSight는 모든 FLOW-3DFLOW-3D CAST라이센스에 포함되어 추가비용 없이 사용할 수 있습니다.

새로운–스플 라인 클립!

FlowSight의 스플라인 클립 기능을 사용하면 복잡한 곡면을 따라 클립을 생성할 수 있습니다. ogee weir 위로 물이 흐르는 시뮬레이션에서, 스플 라인은 ogee weir의 표면을 따라 형성됩니다. 그런 다음 스플 라인이 돌출되어 웨어 표면을 따라 물의 자유 표면 높이에 의해 색상이 지정된 클립을 생성합니다.

키 프레임 기능

크고 복잡한 시뮬레이션을 분석 할 때 매우 일반적인 문제는 관심 영역이 형상에 의해 가려지거나 시뮬레이션이 시간이 지남에 따라 변경됨에 따라 관심 영역이 변경 될 수 있다는 것입니다. 키 프레임은 분석 중에 형상을 “분리되도록”허용하고 시점이 시간과 공간을 통해 이동할 수 있도록 하여 이 문제를 해결합니다.

이 애니메이션은 FlowSight의 키 프레임 기능을 사용하여 충전하는 동안 다이 반쪽을 “시각적으로”열고 다이를 채우는 금속을 표시하면서 다이 표면에 고체 온도를 표시하는 방법을 보여줍니다.

Particle Visualization

FlowSight는 파티클(입자) 시각화 기능을 완벽하게 갖추고 있습니다. 입자는 입자 직경, 입자 밀도, 입자 수명, 속도 및 관련성이 있는 기타 변수에 의해 색상이 지정될 수 있습니다. 이 경우, 입자는 각각의 직경의 크기에 의해 착색됩니다.

속도 벡터 필드

FlowSight는 사용자에게 평면 또는 도메인 전체에 걸친 전체 볼륨 속도 및 방향 분석에 속도 벡터 필드를 시각화하는 옵션을 제공합니다. 사용자 지정 가능한 벡터 필드를 사용하면 다양한 색상 지정 및 밀도 조정이 가능하여 선명도를 높일 수 있습니다.

Streamlines & Pathlines

FlowSight의 유선(Streamlines) 기능은 복잡한 동적 패턴을 완전한 충실도로 시각화하여 유동장 속도 방향에 대해 실시간 스냅 샷을 제공합니다. 경로 선(Pathlines)은 시간을 따른 유체 입자의 궤적을 시뮬레이션하는 동안, 히스토리 라인은 유동장에서 유체 입자를 애니메이션 합니다.

Iso-surfaces

Iso-surfaces 은 유체 및 고체 표면을 시각화하는 강력하고 빠른 방법으로, 일정한 난류 에너지 영역을 표시하는 데 적합합니다.

Volume Render

iso-surface에서만 변수를 표시하는 대신 사용자 지정 가능한 볼륨 맵을 사용하여 볼륨 전체에 걸쳐 변수를 표시합니다. 그림에 표시된 바와 같이 각 기포와 주변 액체의 변형률 크기는 볼륨 렌더링과 함께 표시됩니다.


Multiple Data Views

숫자 및 다양한 그래프 등의 시각적 형식으로 분석하기

Visualizing Non-inertial Reference Frame Motion

Non-inertial reference frame visualization는 편리한 시뮬레이션 설정을 제공하고 계산 시간을 단축하며 사용자가 사실적인 방식으로 모델을 시각화 할 수 있게합니다.

2D Clips

2D 클립은 모든 단면 평면에서 유체 매개 변수를 시각화하는 데 사용됩니다.

3D Clipping

3D 클리핑 도구를 사용하면 사용자가 6 개 방향 모두에서 등면을 동시에 슬라이스 할 수 있으며, 높은 결함 영역을 감지하고 유체 및 고체 영역 내부의 온도, 압력, 속도 프로파일을 시각화하는 데 유용합니다.

  • 특정 방향의 범위 사이에 애니메이션 제공
  • 한 번에 한 방향으로 스왑
  • 양방향 애니메이션 : 앞으로 및 뒤로

Arbitrary Clips

평면, 원통형, 상자, 원뿔형, 구형 및 간소화된 표면에 대한 시각화를 포함하여 광범위한 유연성으로 표면 뷰를 분석할 수 있습니다. 유체 흐름이 평면이 아닌 표면에 대한 시각화가 필요한 경우 유용합니다. 임의 클립을 사용하면 연속적으로 여러 클립을 만들 수도 있습니다.

Probe Data

포인트 프로브는 시간에 따른 변수의 진화를 보여주고, 라인 프로브는 거리에 따른 변수 값의 변화를 반환합니다. 오른쪽, 프로브는 유체의 응고 비율을 보여줍니다.

Vortex Cores

와류 코어 식별에 사용할 수있는 두 가지 옵션인 와류 및 고유 분석을 통해 코어 강도에 따라 필터링 가능한 결과 생성이 가능합니다.

엔지니어들은 연구를 위해 다양한 시각화 방법을 사용합니다. 유체 흐름에서 와류 코어의 분석은 중요한 문제로, 와류 코어는 속도 필드 내에 와류 구조 (중앙 트레이스)를 나타내는 선 입니다. 기술적으로, FlowSight는 와류 방법 및 고유치 분석에서 속도 벡터와 소용돌이 벡터의 속도장에서의 식별위치는 평행합니다. FlowSight는 사용자에게 와류 코어 식별을 위한 두 가지 옵션을 제공합니다. 코어는 특정 강도 이상 또는 이하로 FlowSight에서 필터링 될 수 있습니다. 코어는 일반적으로 코어 주위에 회전 또는 단순히 순환 강도의 비율에 의해 채색됩니다. 아래의 예에서는, 와류 코어 고유치 값 분석을 이용하여 생성됩니다. 강한 코어는 소용돌이의 중심에 형성되어있는 것을 알 수 있습니다. 이를 통해 사용자는 펌프로 공기 흡입의 가능성을 연구 할 수 있습니다. 코어가 너무 강한 경우, 공기는 강한 와류로 인해 야기되는 열린 통로로부터 흡입될 수 있습니다.

History Data

그래프 도구는 일반적인 히스토리, 진단 및 메시 종속 데이터에 강력한 수준의 분석을 제공하여 서로 다른 시뮬레이션 데이터를 상대적으로 보여줍니다.