Microstructural defects in laser powder bed fusion (LPBF) metallic materials are correlated with processing parameters. A multi-physics model and a crystal plasticity framework are employed to predict microstructure growth in molten pools and assess the impact of manufacturing defects on plastic damage parameters. Criteria for optimising the LPBF process are identified, addressing microstructural defects and tensile properties of LPBF Hastelloy X at various volumetric energy densities (VED). The results show that higher VED levels foster a specific Goss texture {110} <001>, with irregular lack of fusion defects significantly affecting plastic damage, especially near the material surface. A critical threshold emerges between manufacturing defects and grain sizes in plastic strain accumulation. The optimal processing window for superior Hastelloy X mechanical properties ranges from 43 to 53 J/mm3 . This work accelerates the development of superior strengthductility alloys via LPBF, streamlining the trial-and-error process and reducing associated costs.
Figure 3. The simulated temperature distribution and single-layer multi-track isothermograms of LPBF Hastelloy X, located at the bottom of the powder bed, are presented for various laser energy densities. (a) depicts the single-point temperature distribution at the bottom of the powder bed, followed by the isothermograms corresponding to laser energy densities of (b) 31 J/mm3 , (c) 43 J/mm3 , (d) 53 J/mm3 , (e) 67 J/mm3 , and (f) 91 J/mm3 .
References [1] DebRoy T, Wei HL, Zuback JS, et al. Additive manufacturing of metallic components – process, structure and properties. Prog Mater Sci. 2018;92:112–224. doi:10. 1016/j.pmatsci.2017.10.001 [2] Mostafaei A, Ghiaasiaan R, Ho IT, et al. Additive manufacturing of nickel-based superalloys: A state-of-the-art review on process-structure-defect-property relationship. Prog Mater Sci. 2023;136:101108. doi:10.1016/j.pmatsci. 2023.101108 [3] Akande IG, Oluwole OO, Fayomi OSI, et al. Overview of mechanical, microstructural, oxidation properties and high-temperature applications of superalloys. Mater Today Proc. 2021;43:2222–2231. doi:10.1016/j.matpr. 2020.12.523 [4] Sanchez S, Smith P, Xu Z, et al. Powder bed fusion of nickel-based superalloys: a review. Int J Machine Tools Manuf. 2021;165:103729. doi:10.1016/j.ijmachtools.2021. 103729 [5] Xie Y, Teng Q, Shen M, et al. The role of overlap region width in multi-laser powder bed fusion of Hastelloy X superalloy. Virtual Phys Prototyp. 2023;18(1):e2142802. doi:10.1080/17452759.2022.2142802 [6] Yuan W, Chen H, Cheng T, et al. Effects of laser scanning speeds on different states of the molten pool during selective laser melting: simulation and experiment. Mater Des. 2020;189:108542. doi:10.1016/j.matdes.2020. 108542 [7] He X, Kong D, Zhou Y, et al. Powder recycling effects on porosity development and mechanical properties of Hastelloy X alloy during laser powder bed fusion process. Addit Manuf. 2022;55:102840. doi:10.1016/j. addma.2022.102840 [8] Sanaei N, Fatemi A. Defects in additive manufactured metals and their effect on fatigue performance: a stateof-the-art review. Prog Mater Sci. 2021;117:100724. doi:10.1016/j.pmatsci.2020.100724 [9] Pourbabak S, Montero-Sistiaga ML, Schryvers D, et al. Microscopic investigation of as built and hot isostatic pressed Hastelloy X processed by selective laser melting. Mater Charact. 2019;153:366–371. doi:10.1016/j. matchar.2019.05.024 [10] He X, Wang L, Kong D, et al. Recrystallization effect on surface passivation of Hastelloy X alloy fabricated by laser powder bed fusion. J Mater Sci Technol. 2023;163:245–258. doi:https://doi.org/10.1016j.jmst. 2023.06.003. [11] Sabzi HE, Maeng S, Liang X, et al. Controlling crack formation and porosity in laser powder bed fusion: alloy design and process optimisation. Addit Manuf. 2020;34:101360. doi:10.1016/j.addma.2020.101360 [12] Yu C, Chen N, Li R, et al. Selective laser melting of GH3536 superalloy: microstructure, mechanical properties, and hydrocyclone manufacturing. Adv Powder Mater. 2023:
doi:10.1016/j.apmate.2023.100134 [13] Ye C, Zhang C, Zhao J, et al. Effects of post-processing on the surface finish, porosity, residual stresses, and fatigue performance of additive manufactured metals: a review. J Mater Eng Perform. 2021;30(9):6407–6425. doi:10. 1007/s11665-021-06021-7 [14] Zhang W, Zheng Y, Liu F, et al. Effect of solution temperature on the microstructure and mechanical properties of Hastelloy X superalloy fabricated by laser directed energy deposition. Mater Sci Eng A. 2021;820:141537. doi:10. 1016/j.msea.2021.141537 [15] Lehmann T, Rose D, Ranjbar E, et al. Large-scale metal additive manufacturing: a holistic review of the state of the art and challenges. Int Mater Rev. 2021;67(4):410–459. doi:10.1080/09506608.2021.1971427
[16] Wu S, Hu Y, Yang B, et al. Review on defect characterization and structural integrity assessment method of additively manufactured materials. J Mech Eng. 2021;57 (22):3–34. doi:10.3901/JME.2021.22.003
[17] Keller C, Mokhtari M, Vieille B, et al. Influence of a rescanning strategy with different laser powers on the microstructure and mechanical properties of Hastelloy X elaborated by powder bed fusion. Mater Sci Eng A. 2021;803:140474. doi:10.1016/j.msea.2020.140474
[18] Keshavarzkermani A, Marzbanrad E, Esmaeilizadeh R,et al. An investigation into the effect of process parameters on melt pool geometry, cell spacing, and grain refinement during laser powder bed fusion. Optics & Laser Technol. 2019;116:83–91. doi:10.1016/j.optlastec. 2019.03.012
[19] Watring DS, Benzing JT, Hrabe N, et al. Effects of laserenergy density and build orientation on the structureproperty relationships in as-built Inconel 718 manufactured by laser powder bed fusion. Addit Manuf. 2020;36:101425. doi:10.1016/j.addma.2020.101425
[20] Xiao H, Liu X, Xiao W, et al. Influence of molten-pool cooling rate on solidification structure and mechanical property of laser additive manufactured Inconel 718. J Mater Res Technol. 2022;19:4404–4416. doi:10.1016/j. jmrt.2022.06.162
[21] Wang J, Zhu R, Liu Y, et al. Understanding melt pool characteristics in laser powder bed fusion: An overview of single- and multi-track melt pools for process optimization. Adv Powder Mater. 2023;2(4):100137. doi:10.1016/j. apmate.2023.100137
[22] Li Z, Deng Y, Yao B, et al. Effect of laser scan speed on pool size and densification of selective laser melted CoCr alloy under constant laser energy density. Laser Optoelectronics Progress. 2022;59(7):0736001. doi:10. 3788/LOP202259.0736001
[23] Zhang J, Yuan W, Song B, et al. Towards understanding metallurgical defect formation of selective laser melted wrought aluminum alloys. Adv Powder Mater. 2022;1 (4):100035. doi:10.1016/j.apmate.2022.100035
[24] Rui H, Meiping W, Chen C, et al. Effects of laser energy density on microstructure and corrosion resistance of FeCrNiMnAl high entropy alloy coating. Optics & Laser Technol. 2022;152:108188. doi:https://doi.org/10.1016j. optlastec.2022.108188.
[25] Zhao Y, Sun W, Wang Q, et al. Effect of beam energy density characteristics on microstructure and mechanical properties of nickel-based alloys manufactured by laser directed energy deposition. J Mater Process Technol. 2023;319:118074. doi:10.1016/j.jmatprotec.2023.118074
[26] Tan P, Zhou M, Tang C, et al. Multiphysics modelling of powder bed fusion for polymers. Virtual Phys Prototyp. 2023;18(1):e2257191. doi:10.1080/17452759.2023. 2257191
[27] Tan P, Shen F, Shian Tey W, et al. A numerical study on the packing quality of fibre/polymer composite powder for powder bed fusion additive manufacturing. Virtual Phys Prototyp. 2021;16(sup1):S1–S18. doi:10.1080/17452759. 2021.1922965
[28] Kusano M, Watanabe M. Microstructure control of Hastelloy X by geometry-induced elevation of sample temperature during a laser powder bed fusion process. Mater Des. 2022;222:111016. doi:10.1016/j.matdes.2022. 111016
[29] Lee YS, Zhang W. Modeling of heat transfer, fluid flow and solidification microstructure of nickel-base superalloy fabricated by laser powder bed fusion. Addit Manuf. 2016;12:178–188. doi:10.1016/j.addma.2016.05.003
[30] Lv F, Liang HX, Xie DQ, et al. On the role of laser in situ remelting into pore elimination of Ti-6Al-4V components fabricated by selective laser melting. J Alloys Compd. 2021;854:156866. doi:10.1016/j.jallcom.2020.156866
[31] Prithivirajan V, Sangid MD. The role of defects and critical pore size analysis in the fatigue response of additively manufactured IN718 via crystal plasticity. Mater Des. 2018;150:139–153. doi:10.1016/j.matdes.2018.04.022
[32] Huang Y. A user-material subroutine incroporating single crystal plasticity in the ABAQUS finite element program. Cambridge: Harvard University Press; 1991.
[33] Pilgar CM, Fernandez AM, Lucarini S, et al. Effect of printing direction and thickness on the mechanical behavior of SLM fabricated Hastelloy-X. Int J Plasticity. 2022;153:103250. doi:10.1016/j.ijplas.2022.103250
[34] Garlea E, Choo H, Sluss CC, et al. Variation of elastic mechanical properties with texture, porosity, and defect characteristics in laser powder bed fusion 316L stainless steel. Mater Sci Eng A. 2019;763:138032. doi:10.1016/j. msea.2019.138032
[35] Sanchez-Mata O, Wang X, Muñiz-Lerma JA, et al. Dependence of mechanical properties on crystallographic orientation in nickel-based superalloy Hastelloy X fabricated by laser powder bed fusion. J Alloys Compd. 2021;865:158868. doi:10.1016/j.jallcom.2021. 158868
[36] Gu H, Wei C, Li L, et al. Multi-physics modelling of molten
pool development and track formation in multi-track, multi-layer and multi-material selective laser melting. Int J Heat Mass Transf. 2020;151:119458. doi:10.1016/j. ijheatmasstransfer.2020.119458
[37] Johnson L, Mahmoudi M, Zhang B, et al. Assessing printability maps in additive manufacturing of metal alloys. Acta Mater. 2019;176:199–210. doi:10.1016/j.actamat. 2019.07.005
[38] Wang S, Ning J, Zhu L, et al. Role of porosity defects in metal 3D printing: formation mechanisms, impacts on properties and mitigation strategies. Mater Today. 2022;59:133–160. doi:10.1016/j.mattod.2022.08.014
[39] Guo Y, Collins DM, Tarleton E, et al. Measurements of stress fields near a grain boundary: exploring blocked arrays of dislocations in 3D. Acta Mater. 2015;96:229–doi:10.1016/j.actamat.2015.05.041 [40] Kong D, Dong C, Ni X, et al. Hetero-deformation-induced stress in additively manufactured 316L stainless steel. Mater Res Lett. 2020;8(10):390–397. doi:10.1080/ 21663831.2020.1775149
This study aims to investigate the impact of laser beam shaping on metal mixing and molten pool dynamics during laser beam welding of Cu-to-steel for battery terminal-to-casing connections. Four beam shapes were tested during LBW of 300 µm Cu to 300 µm nickel-plated steel. Both experiments and simulations were used to study the underlying physics. A CFD model was firstly calibrated against experiments and then deployed to explore the effect of the increasing ring-to-core diameter, as well as a tandem laser spot configuration. The study showed that metal mixing is influenced by the keyhole dynamics and collapse events, but also there is an intricate interplay between keyhole geometry, fluid dynamics via Marangoni forces and buoyancy forces. Notably, the buoyance forces due to the different densities of steel and Cu, along with the recoil pressure contribute to the upward flow of steel towards Cu, and hence impact meaningfully the material mixing. The study pointed-out that the selection of a custom ring-to-core diameter and ring-to-core power is a decision with a trade-off between the need of stabilising the keyhole dynamics and the need to reduce the mixing. Findings indicated that 350 µm ring and 90 µm core with 30% of ring power (weld configuration C3) resulted in more stable dynamics of the keyhole, with significant reduction of collapse events, and ultimately controlled migration of steel towards Cu. Additionally, the pre-heating approach with the tandem beam only led to local fusion of Cu and no significant improvement in keyhole stability was observed.
1. Introduction
The push towards net-zero mobility is globally influencing industrial strategies in the automotive sector as reported by IEA (2022). Manufacturers are introducing new vehicles by replacing internal combustion engines with hybrid or fully electric powertrains. The battery pack is a critical component for un-interrupted supply of electricity to e-drives and other electrical systems in electric vehicles (EV). A battery pack typically consists of several battery modules that are electrically connected in series and parallel based on the desired power and capacity requirements (Zwicker et al., 2020). Battery modules hold the battery cells that store the electrical charge and supply it on-demand to the electrical systems. Electrical connections play a critical role in the entire process of battery pack manufacturing since joints with different electrical resistance may result in uneven current loads that can affect the overall performances of the battery system (Kumar et al., 2021). Joining of dissimilar materials is the most deemed since it complements the properties of the individual materials and allows to develop functionally efficient connections. Joints in EV battery pack involve low-thickness materials (typically 0.3–1 mm) and the welding process is normally performed in lap or fillet configuration. Depending upon design and functional requirements as well as manufacturing costs, research has shown that the following combinations of materials are the most regarded: aluminium (Al) to copper (Cu), steel to Al, Al to steel, Cu to steel (Das et al., 2018). Connections between Cu and steel have gained much attention in EV applications for joining cells in battery modules. For example, in the cylindrical format, the negative terminals are made of Cu and are generally connected to the steel casing of the cell (Sadeghian and Iqbal, 2022). Several joining processes have been studied for Cu-to-steel welding and they include wire bonding, micro-spot welding, ultrasonic welding, micro-TIG welding, electron beam welding and Laser Beam Welding (LBW) (Zwicker et al., 2020). LBW is an attractive option and has recently gained popularity due to advances in versatile methods for laser beam delivery and associated sensors technology for quality control and process monitoring that make LBW comparatively affordable (Kogel-Hollacher, 2020). Brand et al. (2015) demonstrated that LBW is a suitable process for joining battery terminals since it allows the lowest electrical resistance and the highest joint strength, when compared to micro-spot welding and ultrasonic welding; also, it is potentially applicable to any cell configuration and dissimilar metal combinations. Despite the benefits of LBW, opening and maintaining a stable molten pool on the Cu-side is challenging when using LBW with infrared sources. The absorptivity of Cu at ambient temperature is approximate 5% and increases with rising temperature, and it suddenly jumps up when the melting temperature is reached. A problem with this is that when fusion of the material does happen, a surplus of energy flows through it, which can vaporise the material and create spatters, as well as pores inside the joint. These defects can reduce the electrical conductivity of the joint. At first sight, the solution to the low coupling efficiency of Cu is to switch from infrared sources to visible sources. The absorption increases drastically up to 60% when using visible sources. Green (515 nm) or blue (450 nm) lasers have been investigated by Kogel-Hollacher et al. (2022) and proved that lower power needed for same penetration achievable with infrared lasers and less thermal damage to enamel and insulators. Hummel et al. (2020) experimentally evaluated and proved the beneficial effects of blue laser during laser micro-welding of Cu, and achieved high welding speed with low input power. Nonetheless, compared to infrared lasers, the higher cost, lower plug efficiency and lower beam quality of visible lasers, push practitioners towards the use of multi-kW infrared sources at very high brightness for Cu welding. In addition to the challenge posed by the laser beam coupling to the Cu, the welding of Cu to steel presents a series of problems. First, they are quite different in terms of physical properties such as density, melting points and thermal expansion and make defect-free welding difficult. Second, although Cu-Fe alloys are completely miscible in the stable liquid state and do not form brittle intermetallic compounds, the system shows a wide metastable miscibility gap at an undercooling level. The liquid phase separation occurs as the liquid cools in the miscibility gap resulting in the supersaturation of one or both liquids. Jeong et al. (2020) has shown that increasing the content of Fe tends to improve the mechanical properties of alloys but reduce electrical conductivity and ductility. Chen et al. (2013) proved that the toughness and fatigue strength of the joint decreases with the increase in the amount of molten Cu into the steel. Thus, melting of Cu was suggested to be kept at a minimum. Third, excessive penetration of Cu in grain boundaries of steel may result in cracks in the heat affected zone and fusion zone, and ultimately reducing structural performance of the joint. Therefore, to reduce these issues, controlling the mixing of Cu and steel in the molten pool is quite important for producing sound joints. Laser beam shaping is gaining popularity since it holds the promise to control cooling rates and thermal gradients in and around the molten pool. This theoretically leads to a tailored material response to the heat input both spatially and temporally. A tailored power density profile (Fig. 1 shows typical power density profiles obtained via adjustable ring-mode laser) is generated via adequate insertion of optical components (specially coated lenses of silica substrate) in the optical chain of the welding head; or by electro-optical switching multiple laser beams generated in the laser source itself and enabled by beam combiners with optical phased array. Research has confirmed a positive effect of the laser beam shaping on the control of the weld profile and keyhole stabilization with suppression of spatters and significant reduction of porosity in the weldments. Caprio et al. (2023) investigated the use of beam shaping and beam oscillation to weld 0.2 mm Ni-plated steel sheets in lap joint configuration, which are materials commonly involved in cell to busbar connections. Sokolov et al. (2021) employed the ARM laser coupled with Optical Coherent Tomography (OCT) in Al-to-Cu thin sheets and observed that the use of combined core and ring-shaped laser beams reduced the fluctuations of the keyhole, improved the stability, and ultimately the accuracy of OCT measurements. Rinne et al. (2022) studied the effect of different power distributions between the inner core and outer ring-shaped laser beams on spatter ejection and penetration depth during welding of Cu sheets. Wagner et al. (2022) investigated and proved the influence of dynamic beam shaping on the geometry of the keyhole during welding of Cu by varying the patterns of the intensity distribution in longitudinal and transversal direction. Prieto et al. (2020) implemented dynamic laser beam shaping with infinite pattern and assessed quality of weld seam in 0.8 mm Al thin-sheet and observed that tailored beam with shape frequency over 10 kHz enables welding speed up to 18 m/min with stable keyhole.
Fig. 1. Example of laser beam shapes obtained via an adjustable ring-mode laser.
Despite the benefits, laser beam shaping introduces new set of parameters and finding the optimal combination of number of beams, shape of beams (multiple spots, C-spot, ring-core spots, pyramid, infinity, spiral shapes, etc. (Prieto et al., 2020)) can be expensive and time consuming since it may require dedicated equipment, expertise and experimental setups. In this context, multi-physics computational fluid dynamics (CFD) enable simulations of the process to reproduce mechanisms which are difficult to observe with in-situ investigations. With the raise of computational power and multi-core computing on high performance clusters, advanced simulations of LBW processes are now a close reality. Huang et al. (2020) developed a CFD model in FLOW-3D WELD® to study the metal mixing during linear laser welding of 200 µm Al to 500 µm Cu with different levels of laser power and velocity of the laser spot. They analysed the contribution of recoil pressure and Marangoni effect on the overall mixing process. Chianese et al. (2022) developed a multi-physics model using FLOW-3D and FLOW-3D WELD® to investigate the effect of part-to-part gap in LBW of Cu-to-steel thin sheets with beam wobbling. They showed that the presence of part-to-part gap and mixing mechanism between parent metals are linked, and the occurrence of part-to-part gap influences the temperature and velocity fields in the molten pool resulting in different mixing mechanisms. However, they did not implement any strategies for weld improvement. Drobniak et al. (2020) and Buttazzoni et al. (2021) implemented CFD multi-physics simulations of 1 mm-thick stainless steel plates with adaptive mesh refinement to predict the shape of the weld seam in presence of part-to-part gap, and they predicted the effect on the process of secondary laser beams with different shapes to optimize the weld quality. Recently, Huang et al. (2023) combined experimental approach and CFD simulations in FLOW-3D WELD® to reveal the effect of oscillation frequency and amplitude on fluid-flow and metal mixing during laser welding of 200 µm Al to 500 µm Cu with circular beam wobbling implemented. Additionally, they implemented a Scheil solidification model to predict the phase distributions in the welds based on the predicted thermo-solute conditions. While significant research has been already developed using linear laser welding or laser welding with wobbling for joining of dissimilar materials, a clear understanding of metal mixing and dynamics of the keyhole during Cu-to-steel welding with beam shaping are not clearly reported. Research into application of beam shaping for Cu-to-steel welding entails a promising prospect for further development and investigation. Furthermore, the use of advanced CFD models is a viable approach to complement experimental investigations and explore weld configurations with different beam shaping profiles that would be difficult to achieve only with experimental work. Therefore, this paper aims to study the impact of laser beam shaping on metal mixing and dynamics of the keyhole during LBW of Cu-to-steel for battery terminal-to-casing connections. Four beam shapes were tested during LBW of 300 µm Cu to 300 µm nickel-plated steel. Both experiments and CFD simulations were used to study the underlying physics. A CFD model was firstly calibrated against experiments and then deployed to explore the effect of the increasing ring-to-core diameter, as well as a tandem laser spot configuration.
2. Experimental design and model description
2.1. Experimental design
Materials used in this work are Copper SE-Cu58 2.0070 and Nickel-plated steel (commercial name: Hilumin TATA STEEL). Experiments consisted of 25 mm long welds in lap joints configuration with 300 µm Cu on top of 300 µm nickel-plated steel. Dimensions of the specimens were 65 mm × 30 mm. The laser source used was the Lumentum CORELIGHT, having 55 µm core diameter and 220 µm ring diameter, and BPP 1.4 mm·mrad and 11 mm·mrad for core and ring, respectively. The laser fiber was coupled to the Scout-200 (Laser and Control K-lab, South Korea) scanner to deliver the laser power to the specimens via 2D F-theta scanner with telecentric lenses. Fig. 2 shows the welding setup and specifications of the equipment are in Table 1. Caustic parameters were measured using PRIMES GmbH measurement system.
Fig. 2. (a) Welding setup with aluminium fixture; (b) schematical representation of the welding setup; (c) definition of weld features: top weld width, Wtop; width at the interface, Wi; weld penetration depth, Dpen.
Table 1. Specifications of the welding equipment.
Each weld seam was cut and prepared to obtain two cross sections for each experiment – cross sections were positioned at 10 mm and 15 mm away from the weld start. Three replicates were performed for each weld configuration. Sectioned samples were mounted in Bakelite resins and standard metallography procedure was performed for grinding and polishing to reveal weld profile under Nikon Eclipse LV150N optical microscope. To evaluate and characterize metal mixing with parent metals, elemental mapping of cross-sections was performed with an FEI Versa 3D dual beam scanning electron microscope using Energy Dispersive X-ray Spectroscopy (EDS mapping). Welding experiments were performed in continuous power mode without power modulation. The laser beam was focussed perpendicularly on the upper surface of the Cu sheet, and the motion of the laser was linear (no wobbling). Although the use of shielding gas tends to avoid oxidation in the process and reduce hydrogen entrapment, when using scanners to deliver the laser beam, the gas nozzle cannot be positioned in proximity of the beam. Therefore, in this work, all experiments were conducted with no shielding gas. Part-to-part gap was manually checked and set to a nominal zero. To study the impact of laser beam shaping on metal mixing and molten pool dynamics, 5 weld configurations (C1 to C5) were designed as shown in Table 2, with 4 beam shapes presented in Fig. 3. LBS#1 is single gaussian spot of 90 µm; LBS#2 super-imposes an inner core of 90 µm with an outer ring-shaped profile of 350 µm, with the ring accounting 30% of the total power. LBS#1 and LBS#2 were experimentally tested and enabled by the static beam shaping system of the Lumentum CORELIGHT source. LBS#3 follows the hollow sinh-Gaussian beam profile as defined in Liu et al. (2019), with 90 µm core and 500 µm ring, with 72% of the total power assigned to the ring. LBS#4 is a tandem beam with primary (90 µm) and secondary beam (150 µm) at a centre-to-centre distance of 300 µm, and 50% split of the power between primary and secondary beams – LBS#4 was introduced with the aim to increase the absorption rate by the pre-heating action of the secondary beam. LBS#3 and LBS#4 were only simulated since the laser beam shaping of the Lumentum CORELIGHT was only capable to work with fixed core-to-ring diameter ratio. Therefore, only a simulation-based approach (with the model pre-validated and calibrated in C1, C2 and C3) was deemed appropriate in this case to explore the effect of the increasing ring-to-core diameter and tandem laser spot configuration on material mixing.
Table 2. Process parameters used for the four selected laser beam shapes in Fig. 3.
Fig. 3. Normalized power density distribution for LBS#1, LBS#2, LBS#3 and LBS#4.
The power and speed of C1, C3, C4 and C5 were selected with an iterative process to ensure weld penetration depth, Dpen, ranging 400 – 500 µm. The choice of this penetration depth is based on the requirement that the temperature at the lower end of the steel sheet remains below 550 K. This precautionary measure aims to prevent any potential damage to the battery cell. Additionally, to minimise the effect of the weld depth on the metal mixing, a uniform depth of penetration was adopted across the different beam shapes for comparative analysis. Welding speeds were kept between 250 mm/s and 375 mm/s which is in line with the experimental work in (Perez Zapico et al., 2021). C2 is a variant of C1 and corresponds to a fully penetrated weld. Although fully penetrated welds must be avoided during LBW of battery terminals due to the risk of fire ignition, this work presents this variant for two reasons: first, to generate an additional weld configuration to validate the simulation; second, to discuss how the metal mixing behaves when transitioning from partial penetration to full penetration.
2.2. Model description
A multi-physics model was developed using the commercial CFD code FLOW-3D® (solver version: 12.0.2.01) and its module FLOW-3D® WELD (release: 7, update: 1). In order to develop a numerical model representing the essential physics during LBW of Cu-to-steel, the following assumptions were considered: (i) the liquid flow is considered Newtonian and incompressible; (ii) volumetric thermal expansion of the liquid metal due to temperature-dependent mass density is accounted; (iii) the air and vaporized metal are modelled as “void” type, with ambient temperature and pressure assigned to model the heat exchange with the metal as a natural convective flux (irradiance is neglected); (iv) the heat sinking effect of the clamping mask is neglected due to the clearance between the weld seam and the mask itself as already presented in (Chianese et al., 2022); (v) the effect of plasma plume on laser absorption is not directly modelled but is accounted in the calibration process as also proposed in previous studies by Lin et al. (2017) and Hao et al. (2021); furthermore, the laser absorption is assumed temperature dependent for Cu, constant for steel, and independent of the incidence angle. This assumption is in-line with the work presented by Huang et al. (2020), where they used the build-in ray-tracing function in FLOW-3D® WELD to predict the laser absorption in the keyhole.
2.2.1. Governing equations, boundary conditions and material properties
To reduce the computational cost of the simulations, the computational domain was divided in two zones (Fig. 4): (1) a process zone which was interested by phase change, and, (2) a thermal diffusion zone that models heat transmission in the sheets. A finer mesh size was used for cells in the process zone, and a mesh size 5 times greater than in the process zone was used for cells in the thermal diffusion zone.
Fig. 4. Top view (a) and side view (b) of a schematic representation of the computational domain and modelling approach with nested meshes (process zone and thermal diffusion zone).
Dimensions of the process zone are 2 mm × 0.8 mm× 0.775 mm. The length (2 mm) of the process zone was chosen to enable the simulation of approx. 1.8 mm weld length, which was experimentally evaluated to be sufficient for reaching the steady-state regime. The width (0.8 mm) of the process zone was selected to ensure that the molten pool was contained in it; the height of the computational domain was chosen equal to 0.8 mm so that, beside the stacked thickness of the processed sheets (0.6 mm), 0.2 mm of air (void type) are included in the computational domain. Extension of the thermal diffusion zone is calculated according to the Eq. (1), where k is the thermal conductivity, cp the specific heat at constant pressure, ρ the mass density, tend the simulation time, T the temperature, and Tamb= 20 °C the ambient temperature. The simulation time, tend, is function of the welding speed and the weld length (1.5 mm).
Four different values of the mesh size in the process zone were considered during sensitivity analysis, namely 40 µm, 20 µm, 15 µm, and 10 µm, that resulted in mesh independent solution for mesh size equal to or below 15 µm, which therefore is the selected size. This led to total number of cells approximatively equal to 528 thousand. The geometry of the thin sheets has been modelled in the computational domain, so that in-plane dimensions were parallel to X and Y axis, as shown in the top and side view in Fig. 4(a) and (b). Welding direction was parallel to X axis. The following physics have been accounted to model the welding process: continuity, fluid flow via Navier-Stokes equations, energy conservation, evaporation, keyhole formation and evolution, solidification, species conservation and tracking, surface tension with Marangoni and Laplace forces and multiple reflections. Phase change – Eq. (2) governs the evaporation phenomena which are modelled as mass transfer between the liquid phase and the void type and are proportional to the difference between the saturation pressure Psat and the partial pressure Pvap. In this equation, α is the accommodation coefficient, R is the gas constant, and T is the temperature. The saturation pressure is calculated as a function of the temperature according to the Clapeyron equation (Eq. (3)), in which the couple (Pv, Tv) represents a point on the saturation curve; γ, cv, and ΔHv are the specific heats ratio, the specific heat at constant volume, the latent heat of vaporization, respectively.
Recoil pressure – during laser welding process, intense localised heating of substrate material causes vaporization which results in recoil pressure. This pressure is proportional to the saturated vapor pressure. The relationship between the recoil pressure, Precoil, and the saturated vapor pressure, Psat, depends on the material properties and laser-to-material interaction. Eq. (4) is derived from Eq. (3) with the introduction of two coefficients, Ar and B, that will be calibrated using experimental data.
Tracking of the keyhole – surface of the keyhole is tracked by the volume of fluid (VOF) method (Daligault et al., 2022), which enables the calculation of the interface between the liquid metal and the void type, according to Eq. (5).
The interface between the cell is tracked using a scalar value f that indicates the fraction of fluid in it. A value of f=0 indicates that the cell has only void, conversely, f=1 corresponds to the case of a cell full of liquid, whereas the case of 0<f<1 indicates that the cell has both the liquid and the void type, and therefore the interface between the two falls in it. Similarly, metals involved in the welding process with fluid flow and mixing are tracked in each cell by means of a scalar value f2, which indicates the fraction of second material within the cells. Values of the generic material property ̅φ̅ in each cell is evaluated as weighted sum of the properties φ1 and φ2 of parent metals based on their mixing, as in Eq. (6).
Multiple reflections – Multiple reflections are implemented using a discrete grid cell system through the ray tracing technique. The laser beam is divided into a finite number of rays, which move in the laser beam irradiation direction. When the ray encounters the surface of the material, it is reflected according to vector Eq. (7), in which R→ is the direction of the reflected vector, I→ the direction of the incoming ray, and nˆ the normal direction of the material surface.
Laplace pressure and Marangoni effect – Recoil pressure contributes to the formation of the keyhole and mainly contributes to the velocity field in the fluid; however, surface tension-related phenomena such as Laplace pressure LP and the Marangoni force SM have great influence on the overall welding process. Laplace pressure and the Marangoni force are modelled according to (8), (9) which, σ is the surface tension, RI and RII are the principal curvature radii, and operator ∇t indicates the gradient along the tangent direction at the interface. Eq. (9) explicitly indicates the dependence of the Marangoni effect on the gradient of the surface tension, which in assumed temperature-dependent of the surface tension.
2.2.2. Boundary conditions and material properties
As shown in Fig. (4), the following boundary condition were assigned: wall in the X and Y direction (with constant ambient temperature); assigned pressure and temperature at the boundaries of the computational domain in the Z directions, with natural convective heat flux between the metallic sheets and the air. The heat source was directly imported from the power profiles defined in Fig. 3. Material properties were imported from the JMATPRO® material database. Fig. 5 shows the temperature-dependent plots.
Fig. 5. Temperature-dependent material properties defined in the model.
3. Results and discussion
3.1. Model validation
The model has been applied to simulate all the cases listed in Table 2. Model validation was conducted for the weld configurations C1, C2 and C3 by comparing the weld profile in cross sections and Fe concentration line profiles against the experimental results as shown in Fig. 6. Experimental and simulation results show that welding is done through keyhole mode. The generation of a keyhole is significantly influenced by recoil pressure. In the simulation, the recoil pressure is adjusted through the calibration of coefficients Ar and B, as indicated in Eq. 4. During the model calibration process, a value of Ar was determined to be 55,715 Pa, and the parameter B was set to 4, resulting in comparative results with those obtained in experiments. Five different mesh sizes were tested: 20 µm, 15 µm, 10 µm and 5 µm. The choice of the mesh size was driven by the need to have a minimum of 4 cells to discretise the smallest laser spot (i.e., LSB#1 has the smallest beam diameter of 90 µm among the tested beam shapes in Fig. 3). Mesh-independent solution was achieved with mesh size of 15 µm and this led to approximate a million cells in the whole computational domain.
Fig. 6. Comparison of the experimental and modelling results of the molten pool geometry and elemental maps for weld configurations C1 (a), C2 (b) and C3 (c).
The correlation was conducted looking at two cross-Section (10 mm 15 mm away from the weld start and end) – this was motivated by the need to take into account the experimental errors during the calibration and validation process.
Fig. 6 shows cross sections and elemental maps for experiments C1, C2, and C3, and corresponding simulations. Two representative cross-sections from the same weld seam are shown in each sub-figure to demonstrate the capability of the model to reproduce the geometric shape and the mixing phaenomena at different longitudinal positions along the weld seam. The fusion zones are marked in each cross section and show good correlation with predictions from simulations, as the cases with partial penetration are successfully predicted in for C1 and C3, along with full penetration in C2.
Elemental maps that were measured with EDS, and species concentration that were predicted with simulations, are reported for comparison to show capability of the model to reproduce the mixing mechanism. For each case, plots of the concentration of Fe along with line-scans are reported to quantitatively demonstrate the capability of the model to simulated diffusion of the molten metal from the bottom sheet to the upper one. They show that diffusion of Fe in Cu is well predicted in C1 and C3, as well as presence of Fe-rich clusters in the Cu near the interface between parent materials is reproduced in C2.
Good correlation between measurements and predictions of the weld geometry and metal mixing demonstrates capability of the model to simulate welding scenarios with different laser beam shapes, and weld penetration depth spanning from partial penetration to full penetration. This allows to confidently deploy the simulation model in conjunction with experiments to study the impact of laser beam shaping on metal mixing and molten pool dynamics.
3.2. Keyhole dynamics and impact on metal mixing
As keyhole instabilities have a significant impact on weld quality (Lu et al., 2015), this section highlights the impact of the laser beam shapes on the keyhole dynamics, which ultimately contributes to metal mixing. The discussion is presented by linking the laser power profile to the velocity field within the molten pool and ultimately to the metal mixing between the parent metals and the occurrence of collapse events of the keyhole.
Fig. 7 shows consecutive time frames in each weld configuration and reflects keyhole dynamic mechanisms. The keyhole’s shape and size vary, exhibiting irregularities, asymmetry and fluctuations. These shapes are directly correlated to the laser beam shape profile. The following observations are made:
Collapse events terminate in formation of pores and metal mixing. This is visible in the experimental results presented in Fig. 6(a) and (b), where relatively large pores are observed in the experimental cross-section. With a narrow beam profile (weld configuration C1, C2, C3 and C5) and high energy density, once fusion of the Cu does happen, a surplus of energy flows through the keyhole, increasing the temperature at the keyhole bottom. This generates a recoil pressure that pushes the fluid upwards. At the top surface and rear side of the keyhole, the opposing movements of the fluid, both clockwise and counter-clockwise, and driven by the Marangoni force, have an important consequence: they restrict the size of the molten pool. This restriction creates a high viscosity mushy layer that forms a barrier that limits the expansion of the molten pool. As result, closure or narrowing the top neck of the keyhole restricts the ejection of vapours out of keyhole which leads to increase in pressure within keyhole and creates a high-pressure lob. This ultimately results in pores formed to the toe of the keyhole as seen in Fig. 7(a) and (b). Although a collapse event is observed in C3 as shown Fig. 7(c), it does not necessarily create porosity in the solid front as sufficient room is available for gas vapours to escape from the bottom of the keyhole. The introduction of a pre-heat heating beam in weld configuration C5 does not produce any significant change to the keyhole dynamics as observed in Fig. 7(d). In partial penetration, narrow and deep keyhole is more unstable as slight fluctuations in fluid pressure, velocity and temperature on the rear wall of keyhole can create a collapse event. Additionally, the collapse of the keyhole in partial penetration creates a narrower fluid channel, resulting in localized increase of fluid velocity, which, in turn, affects metal mixing.
Weld configuration C4 leads to wider opening of the keyhole with greater stability as shown in Fig. 7(e). With the super-imposition of the core beam with the wider ring-shaped beam, the core beam penetrates the steel sheet, while the larger ring keeps the keyhole open at the Cu surface. This weld configuration drastically reduces the collapse events and the development of bubbles. It can be observed that the lower depth-to-width aspect ratio of the melt pool correlates to fewer number of collapse events.
Metal mixing is not only influenced by keyhole dynamics and collapse events, but there is an intricate interplay between keyhole geometry, fluid dynamics and buoyancy forces that are dependent upon density which varies with temperature in molten pool, and from top to bottom due to differences in density between Cu and steel. To test the influence of buoyancy forces, a simulation test was performed where the density of Cu and steel were artificially set to be equal. Fig. 8 shows the simulation results and confirm that buoyancy forces have an impact on the metal mixing especially at the interface between the two metals and in the Cu side of the weld. For example, the line-scan B-B in Fig. 8 shows an increase on average of the Fe vol% in the Cu side by 10%, when comparing results with same densities.
Fig. 8. Impact of buoyancy forces on the metal mixing for weld configuration C3. Sections taken at Y= 0.
Fig. 7. Consecutive time steps of the molten pool dynamics for configuration C1 (a), C2 (b), C3 (c) C5 (d) and C4 (e). The plot shows the fluid velocity (both direction and magnitude) visualized by black arrows. Cross sections taken at Y= 0.
The introduction of a ring beam (weld configuration C4 with LBS#3) in the laser welding process alters the shape of the keyhole compared to a single beam scenario (weld configuration C1 with LBS#1). In the single beam case, the keyhole walls develops predominantly in Z direction (schematically illustrated in Fig. 9(a)). The inclusion of a ring beam results in the critical change of the keyhole wall’s curvature, with a pronounced arc-like shape at the rear (Fig. 9(b)). The change of keyhole wall’s curvature plays a critical role and is explained by the complex equilibrium between the fluid pressure, the recoil pressure and the gravity load. A collapse event is associated with the non-equilibrium of the forces in the X direction. To explain this, it is first worth noting that with an idealised static molten pool (no fluid velocity) the fluid pressure would be higher at the bottom and would be governed by the hydrostatic law – with this, the pressure variation occurs linearly downwards and would be a function of the molten pool depth. Under this ideal condition, the keyhole would exhibit a stable equilibrium regime driven by the balanced effect of recoil pressure and fluid flow. With the actual molten pool, the equilibrium state is, however, perturbated by the non-linear variation of the fluid pressure due to the fast upwards motion generated by the recoil pressure itself. A near-equilibrium state is eventually achieved with the change of keyhole wall’s curvature with the resultant of the forces acting predominantly in the Z direction. The shallow angle of the keyhole wall observed at LBS#3 (θ3 < θ1) effectively decomposes the combined forces exerted by the fluid towards the Z direction, hence moving to the near-equilibrium state, with the fluid pushed downwards in Z rather than sidewise in X. It can be observed that the ring-to-core diameter and the ring-to-core power are essential to control the keyhole wall’s curvature and ultimately influence of the stability of the keyhole.
Fig. 9. Schematic representation of forces and pressures acting on the melt pool in case of welding with single laser beam (LBS#1) and ring-core configuration (LBS#3). Arrows represent forces/pressures, and the thickness is proportional of the intensity of the forces/pressures. Arrows are only shown to the rear-side of the keyhole since the physics involved there are more relevant for the dynamics of the keyhole.
3.3. Impact of beam shaping on metal mixing
Cu and steel are generally immiscible as studied by other researchers, such as Shi et al. (2013). This separation means the material solidifies as two separate phases from the liquid state. At this immiscible region a Cu-rich (α phase) and iron-rich (β phase) form FCC and BCC crystal structures, respectively. For the compositional data shown in Fig. 6, the highest amount of mixing for each of the three examples is 60%, 80% and 50% of Fe in the weld pool. When studying the Cu-Fe binary phase diagram, as performed by Chen et al. (2007), these compositions fall within the miscibility gap range. For which no IMCs are expected to form, but instead separate (α and β) phases. However, it is still clear that the formation of these separate phases still creates a mismatch in mechanical properties of the welded joint, both at the interface and enriched regions, which can lead to crack initiation, as reported by Rinne et al. (2020). For this reason, analysing the metal-mixing in dissimilar metals is an important step toward understanding and prevention of cracking mechanisms that can affect the performance of the weld. Influence of the beam shapes on the metal mixing, can be investigated by analysing velocity fields and fluid flow which are predicted with the validated model. Fig. 10(a) and (b) show that in the weld configuration C1 and C2 (corresponding to LBS#1 – single beam with circular spot and gaussian distribution) the increase in laser power leads to more steel mixing with Cu due to greater recoil pressure and to a larger melt pool with more liquid metal involved. When comparing the parameters in Fig. 11, the increased melting of the bottom steel sheet leads to a greater region of keyhole necking with collapse; this can be due to the increased laser absorption, for which steel has a greater absorptivity than the more reflective Cu (Rinne et al., 2020). The lower density of steel creates an upward buoyancy force which allows the migration of more steel into the Cu-rich region. Fig. 11(c) and (d) show weld configurations C3 and C4 respectively, with combined secondary ring-shaped and primary laser beam (LBS#2 and LBS#3, respectively). They can be compared based on similar levels of weld penetration but different width at the interface between parent metals and at the top of the weld seam. Spread of the laser power over a wider surface due to the use of a ring results in a wider weld pool compared to simulations C1 and C2, which is consistent with results found by Jabar et al. (2023). However, one difference between these two cases is that, due to different power density distributions, to achieve adequate weld penetration depth, different laser power is provided leading to different thermal fields and time that the metal stays liquid. Line-scans of the temperature profiles in the melt pool can be observed in Fig. 12, with higher peak temperature in C4, compared to simulations C1 and C2, and C5; whereas a smaller secondary ring-shaped laser beam in simulation C3 results in intermediate behaviour.
Fig. 10. Plots of metal mixing in the longitudinal and a cross sections predicted with simulations C1 (a), C2 (b), C3 (c), C4 (d) and C5 (e).
Fig. 11. (a) Temperature, (b) velocity, (c) Fe concentration and (d) actual melt pool for all the tested weld configurations C1 to C5. Cross sections taken at Y= 0.
Fig. 12. Temperature profiles for weld configurations C1 (a), C2 (b), C3 (c), C4 (d) and C5 (e). Measurements were taken at X = 1.3 mm (just behind the keyhole wall) and Z = −300 µm (interface between Cu and steel).
The higher peak temperature in C4 eventually leads to a significant thermal gradient that promotes significant upward buoyancy forces and ultimately more migration of steel towards the Cu matrix. Similarity of simulation C5 with C1 can be explained considering that the secondary laser beam pre-heats the metal without widening the keyhole. Additionally, the higher peak temperature and larger size of the melt pool in C4 lead to longer time in which the steel stays in the liquid phase with more time available to migrate toward the Cu matrix due to recoil pressure and buoyancy forces and to diffuse. For these reasons, if use of larger spot helps with keyhole stabilisation, higher laser power required to establish sound connection enhances mixing between parent metal. Therefore, selection of custom ring-to-core diameter and ring-to-core power is a decision with a trade-off between the need of stabilising the keyhole dynamics and the need to reduce the mixing. Velocity fields in Fig. 11 show also that the use of the ring-shaped secondary beam (C4), results in lower recoil pressure due to less localised laser power and vaporization. For this reason, the fluid flow and velocity of the liquid movements in considerably lower, as shown by contour plots, where regions of the molten pool in red are those in which the flow of the liquid metal is faster. The metal mixing in the molten pool of C3 weld is more homogeneous than in C1 and C2, due to the localised heat input of the ring laser beam. Rinne et al. (2020) found the addition of the ring laser produced a more homogeneous distribution of Cu and steel in the solidified structure. The lower density of the steel can also be used to explain the more even distribution of steel throughout the weld pool of C3. This is also confirmed by the EDS line-scans in Fig. 6(c) that show a significant drop of Fe into the Cu matrix compared to C1 (Fig. 6(a)). The result of metal mixing has a significant effect on the crack formation in the weld pool and heat-affected zone (HAZ). Two main types of cracking are often referred to as “hot cracking” (Rinne et al., 2020) or “liquation cracking” (Li et al., 2019). During any fusion welding process of Cu to steel the miscibility gap can be identified in the binary phase diagram of Cu-Fe (Chen et al., 2013). When both Cu and steel are melted, there is separation of the liquids during cooling, once the mixture enters the miscibility gap seen on the phase diagram the primary separation of the α and β phases occurs. The secondary separation occurs in the miscibility gap because of a lack of diffusion and a supersaturation of the α and/or β phases. The solidified weld microstructure is found inhomogeneous, consisting of the α and β phases. The difference in the thermal expansion properties of both Cu and steel can create locations of stress concentrations where cracks are often initiated, ad observed by Chen et al. (2013) and Sadeghian and Iqbal (2022). Li et al. (2019) proposed a three-stage mechanism for the formation of liquation cracks in Cu to steel laser welds. The first stage was the penetration of Cu liquid into the grain boundaries of the steel, secondly, the Cu liquid surrounds the Cu phase creating a “film” of liquid in the grain boundary. This drastically reduces the cohesive forces between the grain boundaries due to the presence of the α phase. Cracking can then be initiated in a similar manner to that detailed earlier.
4. Conclusions
A combination of multi-physics CFD modelling results and experiments have been presented to study the impact of laser beam shaping on metal mixing and molten pool dynamics during LBW of Cu-to-steel for battery terminal-to-casing connections. The multi-physics model has been validated with ex-situ EDS element mapping and weld profile’s features. The model has provided useful insights about temperature and velocity fields, mixing mechanisms and dynamics of the keyhole, all of which are difficult to access via experiments due to technological difficulties. The major findings of the work are summarized below:
Metal mixing is largely influenced by the fluid dynamics via the Marangoni, buoyancy forces and recoil pressure. With a greater laser power, recoil pressure is increased, and this leads to more weld penetration and melting of steel. Additionally, spread of the laser power results in higher width of the fusion zone. Subsequently, the buoyance forces due to the different densities of steel and Cu contribute to the upward flow of steel towards Cu, and hence impact meaningfully to the mixing. This can be clearly observed in weld configurations C1 and C2.
Due to the collapse events of the keyhole wall, porosity formation was found in welds C1, C2 and C5. Furthermore, the collapse events create a narrow fluid channel, which results in localised surges in fluid velocity, therefore, promoting metal mixing. All in all, simulations revealed that increasing depth-to-width aspect ratio is correlated to higher frequency of collapse events in the keyhole. Therefore, stabilisation of the melt pool can be achieved with tailored laser beam shapes.
The study has pointed-out that the use of larger ring beam (configuration C4) helps with keyhole stabilisation, but at the same time leads to more laser power and higher temperature that contribute to the enhancement of mixing between parent metals. This poses a trade-off in the definition of a tailored ring-to-core diameter and the ring-to-core power. Analysis of the results showed that ring-to-core diameter (350–90 µm) and 30% of ring power (weld configuration C3) resulted in more stable dynamics of the keyhole, with significant reduction of collapse events, and ultimately controlled migration of steel towards Cu. Furthermore, compared to C4 (2500 W total power), the lower thermal gradient in C3 (1530 W total power) eventually leads to a reduction in the upward buoyancy forces.
The pre-heating approach with the tandem beam (C5) only led to local fusion of Cu and no significant improvement in keyhole stability was observed.
The combination of experiments and numerical modelling provides a powerful approach to understand complex fluid flow and metal mixing processes during laser keyhole welding. This helps to study mixing behaviour along with weld pool dynamics for selection of laser welding strategies with beam shaping in case of dissimilar material welding, especially in presence of miscibility gap at higher temperature as in case of Cu and steel.
References
M.J. Brand, P.A. Schmidt, M.F. Zaeh, A. JossenWelding techniques for battery cells and resulting electrical contact resistancesJ. Energy Storage, 1 (2015), pp. 7-14
M. Buttazzoni, C. Zenz, A. Otto, R. Gómez Vázquez, G. Liedl, J.L. AriasA numerical investigation of the laser beam welding of stainless steel sheets with a gapAppl. Sci., 11 (2021), p. 2549
L. Caprio, B. Previtali, A.G. DemirEffect of in-source beam shaping and laser beam oscillation on the electromechanical properties of Ni-plated steel joints for e-vehicle battery manufacturingJ. Laser Appl., 35 (2023), Article 042030
S. Chen, J. Huang, J. Xia, H. Zhang, X. ZhaoMicrostructural characteristics of a stainless steel/copper dissimilar joint made by laser weldingMetall. Mater. Trans. A, 44 (8) (2013), pp. 3690-3696
Y.Z. Chen, F. Liu, G.C. Yang, X.Q. Xu, Y.H. ZhouRapid solidification of bulk undercooled hypoperitectic Fe–Cu alloyJ. Alloy. Compd., 427 (1–2) (2007), pp. L1-L5
G. Chianese, P. Franciosa, T. Sun, D. Ceglarek, S. PatalanoUsing photodiodes and supervised machine learning for automatic classification of weld defects in laser welding of thin foils copper-to-steel battery tabsJ. Laser Appl., 34 (2022), Article 042007
G. Chianese, S. Jabar, P. Franciosa, D. Ceglarek, S. PatalanoA multi-physics CFD study on the part-to-part gap during remote laser welding of copper-to-steel battery tab connectors with beam wobblingProcedia CIRP, 111 (2022), pp. 484-489
J. Daligault, M. Dal, C. Gorny, F. Coste, R. FabbroCombination of Eulerian and ray-tracing approaches for copper laser welding simulationJ. Laser Appl., 34 (2022), Article 042042
A. Das, D. Li, D. Williams, D. GreenwoodJoining Technologies for Automotive Battery Systems ManufacturingWorld Electr. Veh. J., 9 (2) (2018), p. 22
P. Drobniak, A. Otto, R.G. Vázquez, R.M. Arias, J.L. AriasSimulation of keyhole laser welding of stainless steel plates with a gapProcedia CIRP, 94 (2020), pp. 731-736
Y. Hao, N. Chen, H. Wang, B.E. Carlson, F. LuEffect of zinc vapor forces on spattering in partial penetration laser welding of zinc-coated steelsJ. Mater. Process. Technol., 298 (2021), Article 117282
W. Huang, H. Wang, T. Rinker, W. TanInvestigation of metal mixing in laser keyhole welding of dissimilar metalsMater. Des., 195 (2020), Article 109056
W. Huang, W. Cai, T.J. Rinker, J. Bracey, W. TanEffects of laser oscillation on metal mixing, microstructure, and mechanical property of Aluminum–Copper weldsInt. J. Mach. Tools Manuf., 188 (2023), Article 104020
M. Hummel, C. Schöler, A. Häusler, A. Gillner, R. PopraweNew approaches on laser micro welding of copper by using a laser beam source with a wavelength of 450 nmJ. Adv. Join. Process., 1 (2020), Article 100012
IEA , 2022: Global EV Outlook 2022 – Securing supplies for an electric future, 2022.
S. Jabar, A.B. Barenji, P. Franciosa, H.R. Kotadia, D. CeglarekEffects of the adjustable ring-mode laser on intermetallic formation and mechanical properties of steel to aluminium laser welded lap jointsMater. Des., 227 (2023), Article 111774
Y.B. Jeong, H.R. Jo, H.J. Park, H. Kato, K.B. KimMechanical properties and microstructural change in (Cu–Fe) immiscible metal matrix composite: Effect of Mg on secondary phase separationJ. Mater. Res. Technol., 9 (6) (2020), pp. 15989-15995
M. Kogel-HollacherThe full potential of Photonics in e-mobility: an overwievLaser Use, 97 (2020), pp. 22-23
Kogel-Hollacher, M., Nicolay, T., Reiser, J., 2022, Going Green – Laser Welding and Advanced Sensor Technology for Electric Vehicles.
N. Kumar, I. Masters, A. DasIn-depth evaluation of laser-welded similar and dissimilar material tab-to-busbar electrical interconnects for electric vehicle battery packJ. Manuf. Process., 70 (2021), pp. 78-96
J. Li, Y. Cai, F. Yan, C. Wang, Z. Zhu, C. HuPorosity and liquation cracking of dissimilar Nd:YAG laser welding of SUS304 stainless steel to T2 copperOpt. Laser Technol., 122 (2019), Article 105881
R. Lin, H. Wang, F. Lu, J. Solomon, B.E. CarlsonNumerical study of keyhole dynamics and keyhole-induced porosity formation in remote laser welding of Al alloysInt. J. Heat. Mass Transf., 108 (A) (2017), pp. 244-256
Z. Liu, X. Wang, K. HangEnhancement of trapping efficiency by utilizing a hollow sinh-Gaussian beamSci. Rep., 9 (2019), Article 10187
F. Lu, X. Li, Z. Li, X. Tang, H. CuiFormation and influence mechanism of keyhole-induced porosity in deep-penetration laser welding based on 3D transient modelingInt. J. Heat. Mass Transf., 90 (2015), pp. 1143-1152
E. Perez Zapico, A. Ascari, V. Dimatteo, A. FortunatoLaser dissimilar welding of copper and steel thin sheets for battery productionJ. Laser Appl., 33 (1) (2021), Article 012016
C. Prieto, E. Vaamonde, D. Diego-Vallejo, J. Jimenez, B. Urbach, Y. Vidne, E. ShekelDynamic laser beam shaping for laser aluminium welding in e-mobility applicationsProcedia CIRP, 94 (2020), pp. 596-600
J. Rinne, S. Nothdurft, J. Hermsdorf, S. Kaierle, L. OvermeyerAdvantages of adjustable intensity profiles for laser beam welding of steel copper dissimilar jointsProcedia CIRP, 94 (2020), pp. 661-665
J. Rinne, S. Nothdurft, J. Hermsdorf, S. Kaierle, L. OvermeyerMultivariate parametric study on laser beam welding of copper lap joints using adjustable intensity profilesProcedia CIRP, 111 (2022), pp. 415-419
A. Sadeghian, N. IqbalA review on dissimilar laser welding of steel-copper, steel-aluminum, aluminum-copper, and steel-nickel for electric vehicle battery manufacturingOpt. Laser Technol., 146 (2022), Article 107595R.P. Shi, C.P. Wang, D. Wheeler, X.J. Liu, Y. WangFormation mechanisms of self-organized core/shell and core/shell/corona microstructures in liquid droplets of immiscible alloysActa Mater., 61 (4) (2013), pp. 1229-1243
M. Sokolov, P. Franciosa, T. Sun, D. Ceglarek, V. DimatteoApplying optical coherence tomography for weld depth monitoring in remote laser welding of automotive battery tab connectorsJ. Laser Appl., 33 (1) (2021), Article 012028
J. Wagner, A. Heider, R. Ramsayer, R. Weber, F. Faure, A. Leis, N. Armon, R. Susid, O. Tsiony, E. Shekel, T. GrafInfluence of dynamic beam shaping on the geometry of the keyhole during laser beam weldingProcedia CIRP, 111 (2022), pp. 448-452
M.F.R. Zwicker, M. Moghadam, W. Zhang, C.V. NielsenJournal of Advanced Joining Processes Automotive battery pack manufacturing – a review of battery to tabJ. Adv. Join. Process., 1 (2020), Article 100017
인텔 : 모델명이 ‘2’로 시작하고 ‘V’로 끝나는 코어 울트라 시리즈 2(Core Ultra Series 2). 예를 들면 인텔 코어 울트라 5 226V(시리즈2)가 있다.
AMD : 라이젠 AI 300 시리즈. 예시로 AMD 라이젠 AI 7 프로 360.
퀄컴 : 스냅드래곤 X 시리즈의 플러스(Plus) 또는 엘리트(Elite) 제품
이 세 가지 프로세서는 성능과 배터리 수명 면에서 애플 맥북의 M 시리즈와 경쟁하도록 설계됐다. 그러나 노트북을 선택할 때는 프로세서뿐 아니라 다양한 요소를 함께 고려해야 한다.
인텔 프로세서
인텔의 최신 프로세서는 다음 세 가지 범주로 나뉜다.
인텔 코어 울트라(Intel Core Ultra) : 프리미엄 칩으로, AI 전용 프로세서를 탑재했다(예 : 인텔 코어 울트라 7 155U).
인텔 코어(Intel Core) : 주류 노트북에 사용되는 칩으로, 코어 울트라보다 한 단계 아래다(예 : 인텔 코어 7 150U).
인텔 프로세서(Intel Processor) : 과거 펜티엄과 셀러론 브랜드를 대체하는 저가형 PC 칩이다(예 : 인텔 프로세서 N200).
인텔은 프로세서를 성능 등급에 따라 ‘3’, ‘5’, ‘7’, ‘9’로 세분화했다. 숫자가 높을수록 더 많은 코어를 가지고 있다는 의미이며, 이미지 처리 및 비디오 작업 속도가 향상된다. 코어 5와 코어 울트라 5 칩은 웹 브라우징 및 오피스 작업에 적합하다.
Intel
모델명 뒤에 붙는 접미사도 중요하다. 이 글자는 프로세서가 어떻게 최적화되었는지를 나타낸다. 긴 접미사 목록 중에 알아두어야 할 주요 단어는 ‘U’와 ‘H’다. U는 배터리 수명을, H는 성능을 강조한다. 코어 울트라 5 226V의 ‘V’는 코어 울트라 제품 라인에만 적용되는 접미사다.
구형 모델은 12세대 코어 i5 1235U처럼 이름에 ‘i’와 세대 번호가 포함되어 있다. 14세대에 이르러 인텔은 모든 것을 재설정하고 이제 ‘시리즈 1’부터 세기 시작했다(예 : 코어 울트라 155U). 즉, 최신 인텔 칩의 모델명은 구형 모델보다 짧다. 가격이 적당한 경우라면 구형 모델도 여전히 고려해 볼만하다.
AMD 프로세서
AMD는 인텔만큼 브랜딩 개편에 적극적이지는 않다. 애플 및 퀄컴과 경쟁하는 AI 300 시리즈 칩 외에 나머지 프로세서는 2023년 도입된 더 길고 혼란스러운 명명 체계를 따르고 있다.
AMD
예시로 AMD 라이젠 5 8640HS를 살펴본다.
첫 번째 숫자 ‘8’은 세대를 의미하며, 2024년에 출시된 칩을 나타낸다(7735HS는 2023년 제품).
‘5’는 성능 등급을 나타내며, 인텔과 마찬가지로 숫자가 높을수록 성능이 좋다는 의미다. 인텔 코어 5와 코어 7 체계와 유사하게 홀수로 계산된다.
마지막 글자는 프로세서의 최적화 방식이다. ‘U’는 배터리 수명, ‘H’는 성능을 우선시한다.
이 명명 체계를 따르는 칩은 AMD의 구형 젠 4(Zen 4) 아키텍처를 기반으로 하지만, 최신 AI 300 시리즈는 젠 5 아키텍처를 사용한다. AMD가 프로세서 라인 대부분을 최신 아키텍처로 전환함에 따라 이에 맞는 새로운 브랜드가 등장할 것으로 예상된다.
퀄컴 프로세서
퀄컴은 올해 초 전력 효율성에 중점을 두고 PC CPU 경쟁에 합류했다. 퀄컴의 스냅드래곤 X 칩은 휴대폰, 태블릿, 애플의 M 시리즈 프로세서에서 볼 수 있는 것과 동일한 Arm 기반 아키텍처를 사용하며, 우수한 PC 성능과 긴 배터리 수명을 제공한다. 무엇보다 퀄컴의 직관적인 브랜드 전략이 신선하게 다가온다.
스냅드래곤 X 엘리트(Snapdragon X Elite) : 최고급 모델
스냅드래곤 X 플러스(Snapdragon X Plus) : 그보다 한 단계 낮은 모델
마이크로소프트 서피스 노트북에 탑재된 스냅드래곤 X 플러스를 사용해 본 경험에 따르면, 충분한 성능과 하루 종일 지속되는 배터리 수명을 제공했다.
다만, Arm 기반 프로세서가 모든 윈도우 소프트웨어와 호환되는 것은 아니다. 스냅드래곤 PC에서 Arm이 아닌 앱을 실행하는 마이크로소프트의 에뮬레이션 엔진에서도 호환성 문제가 발생할 수 있다. 에뮬레이션 개선과 Arm 버전의 소프트웨어를 출시하는 개발자가 늘어나면서 상황이 점점 개선되고 있지만, 인텔과 AMD 노트북에서는 겪지 않아도 될 골칫거리가 여전히 남아 있다.
CPU 시장의 긍정적인 변화
복잡한 이름을 살펴보는 것이 혼란스러울 수 있고 AI에 대한 강조가 다소 과장된 면이 있지만, PC 프로세서 분야에서 3가지 업체가 경쟁하는 덕분에 상황은 개선되고 있다. 지난 4년간 애플은 전력 효율성 측면에서 독보적인 성과를 보여줬다. 그러나 인텔, AMD, 퀄컴이 새로운 프로세서를 내놓으며 애플의 수준에 도달하고 있다.
물론 복잡한 브랜드와 명명 체계는 단점이지만, 이런 경쟁 덕분에 더 나은 성능과 배터리 수명을 갖춘 제품이 등장하고 있다. 사용자에게 긍정적인 변화다. dl-itworldkorea@foundryco.com
아래 과거 자료도 선택에 큰 도움이 됩니다.
2023년 01월 11일
본 자료는 IT WORLD에서 인용한 자료입니다.
일반적으로 수치해석을 주 업무로 사용하는 경우 노트북을 사용하는 경우는 그리 많지 않습니다. 그 이유는 CPU 성능을 100%로 사용하는 해석 프로그램의 특성상 발열과 부품의 성능 측면에서 데스크탑이나 HPC의 성능을 따라 가기는 어렵기 때문입니다.
그럼에도 불구하고, 이동 편의성이나 발표, Demo 등의 업무 필요성이 자주 있는 경우, 또는 계산 시간이 짧은 경량 해석을 주로 하는 경우, 노트북이 주는 이점이 크기 때문에 수치해석용 노트북을 고려하기도 합니다.
보통 수치해석용 컴퓨터를 검토하는 경우 CPU의 Core수나 클럭, 메모리, 그래픽카드 등을 신중하게 검토하게 되는데 모든 것이 예산과 직결되어 있기 때문입니다. 따라서 해석용 컴퓨터 구매 시 어떤 것을 선정 우선순위에 두는지에 따라 사양이 달라지게 됩니다.
해석용으로 노트북을 고려하는 경우, 보통 CPU의 클럭은 비교적 선택 기준이 명확합니다. 메모리 또한 용량에 따라 가격이 정해지기 때문에 이것도 비교적 명확합니다. 나머지 가격에 가장 큰 영향을 주는 것이 그래픽카드인데, 이는 그래픽 카드의 경우 일반적인 게임용이나 포토샵으로 일반적인 이미지 처리 작업을 수행하는 그래픽카드와 3차원 CAD/CAE에 사용되는 업무용 그래픽 카드는 명확하게 분리되어 있고, 이는 가격 측면에서 매우 차이가 많이 납니다.
통상 게임용 그래픽카드는 수치해석의 경우 POST 작업시 문제가 발생하는 경우가 종종 발생하기 때문에 일반적으로 선택 우선 순위에서 충분한 확인을 한 후 구입하는 것이 좋습니다.
FLOW-3D는 OpenGL 드라이버가 만족스럽게 수행되는 최신 그래픽 카드가 적합합니다. 최소한 OpenGL 3.0을 지원하는 것이 좋습니다. FlowSight는 DirectX 11 이상을 지원하는 그래픽 카드에서 가장 잘 작동합니다. 권장 옵션은 NVIDIA의 Quadro K 시리즈와 AMD의 Fire Pro W 시리즈입니다.
특히 엔비디아 쿼드로(NVIDIA Quadro)는 엔비디아가 개발한 전문가 용도(워크스테이션)의 그래픽 카드입니다. 일반적으로 지포스 그래픽 카드가 게이밍에 초점이 맞춰져 있지만, 쿼드로는 다양한 산업 분야의 전문가가 필요로 하는 영역에 광범위한 용도로 사용되고 있습니다. 주로 산업계의 그래픽 디자인 분야, 영상 콘텐츠 제작 분야, 엔지니어링 설계 분야, 과학 분야, 의료 분석 분야 등의 전문가 작업용으로 사용되고 있습니다. 따라서 일반적인 소비자를 대상으로 하는 지포스 그래픽 카드와는 다르계 산업계에 포커스 되어 있으며 가격이 매우 비싸서 도입시 예산을 고려해야 합니다.
MSI가 새로운 노트북 CPU 벤치마크, 그리고 그 CPU가 내장돼 있는 신제품 노트북 제품군을 모두 CES 2023에서 공개했다. CES에서 인텔은 노트북용 13세대 코어 칩, 코드명 랩터 레이크와 핵심 제품인 코어 i9-13980HX를 발표했다.
새로운 노트북용 13세대 코어 칩이 게임 플레이에서 12% 더 빠르다는 정도의 약간의 정보는 이미 알려져 있다. 사용자가 기다리는 것은 실제 CPU가 탑재된 노트북에서의 성능이지만 보통 벤치마크는 제품 출시가 임박해서야 공개되는 것이 보통이다. 올해는 다르다.
CES 2023에서 MSI는 인텔 최고급 제품군인 코어 i9-13980HX 프로세서가 탑재된 타이탄 GT77 HX과 레이더 GE78 HX를 공개했다. 이례적으로 여기에 더해 PCI 익스프레서 5 SSD의 실제 성능을 측정하는 크리스털디스크마크, 모바일 프로세서 실행 속도를 측정하는 시네벤치 벤치마크 점수도 함께 제공했다. 다음 영상의 결과부터 말하자면 인텔 최신 프로세서를 큰 폭으로 따돌릴 만한 수치다.
MSI는 레이더 GE78 HX 외에도 레이더 GE68 HX 그리고 게이밍 노트북 같지 않은 외관의 스텔스 16 스튜디오, 스텔스 14, 사이보그 14 등 2023년에 출시될 다른 노트북도 전시했다. 오래된 PC 애호가라면 MSI 노트북 전면을 장식한 화려한 복고풍의 라이트 브라이트(Lite Brite) LED를 반가워할지도 모른다. 바닥면 섀시가 투명한 플라스틱 소재로 MSI 로고가 새겨져 있는 제품도 있다. 상세한 가격, 출시일, 사양 등은 추후 공개 예정이다. editor@itworld.co.kr
고성능 노트북을 구매할 때는 코어 i7과 코어 i9 사이에서 선택의 갈림길에 서게 된다. 코어 i7 CPU도 강력하지만 코어 i9는 최고의 성능을 위해 만들어진 CPU이며 보통 그에 상응하는 높은 가격대로 판매된다.
CPU에 초점을 둔다면 관건은 성능이다. 성능을 좌우하는 두 가지 주요소는 CPU의 동작 클록 속도(MHz), 그리고 탑재된 연산 코어의 수다. 그러나 노트북에서 한 가지 중요한 제약 요소는 냉각이다. 냉각이 제대로 되지 않으면 고성능도 쓸모가 없다. 가장 적합한 노트북 CPU를 결정하는 데 도움이 되도록 인텔의 지난 3개 세대 CPU의 코어 i7과 i9에 대한 정보를 모았다. 최신 세대부터 시작해 역순으로 살펴보자.
11세대: 코어 i9 vs. 코어 i7
인텔의 11세대 타이거 레이크(Tiger Lake) H는 한 가지 큰 이정표를 달성했다. 인텔이 2015년부터 H급 CPU에 사용해 온 14nm 공정을 마침내 최신 10nm 슈퍼핀(SuperFin) 공정으로 바꾼 것이다. 오랫동안 기다려온 변화다.
인텔이 자랑할 만한 10nm 고성능 칩을 내놓자 타이거 레이크 H를 장착한 노트북도 속속 발표됐다. 얇고 가볍고 예상외로 가격도 저렴한 에이서 프레데터 트라이톤(Acer Predator Triton) 300 SE를 포함해 일부는 벌써 매장에 출시됐다. 모든 타이거 레이크 H 칩이 8코어 CPU라는 점도 달라진 부분이다. 이전 세대의 경우 같은 제품군 내에서 코어 수에 차이를 둬 성능 기대치를 구분했다.
클록 차이도 크지 않다. 코어 i7-11800H의 최대 클록은 4.6GHz, 코어 i9-11980HK는 5GHz로, 클록 속도 증가폭은 약 8.6% 차이다. 나쁘지 않은 수치지만 둘 다 8코어 CPU임을 고려하면 대부분의 사용자에게 코어 i9는 큰 매력은 없다.
다만 코어 i9에 유리한 부분을 하나 더 꼽자면 코어 i9-11980HK가 65W의 열설계전력(TDP)을 옵션으로 제공한다는 점이다. 높은 TDP는 최상위 코어 i9에만 제공되는데, 이는 전력 및 냉각 요구사항을 충족하는 노트북에서는 코어 i7 버전보다 더 높은 지속 클록 속도를 제공할 수 있음을 의미한다.
대신 이런 노트북은 두껍고 크기도 클 가능성이 높다. 따라서 두 개의 얇은 랩톱 중에서(하나는 코어 i9, 하나는 코어 i7) 고민하는 사람에겐 열 및 전력 측면의 여유분은 두께와 크기를 희생할 만큼의 가치는 없을 것이다.
*11세대의 승자: 대부분의 사용자에게 코어 i7
10세대: 코어 i9 vs. 코어 i7
인텔은 10세대 코멧 레이크(Comet Lake) H 제품군에서 14nm를 고수했다. 그 대신 코어 i9 CPU 외에 코어 i7에도 8코어 CPU를 도입, 사용자가 비싼 최상위 CPU를 사지 않고도 더 뛰어난 성능을 누릴 수 있게 했다.
11세대 노트북이 나오기 시작했지만 10세대 CPU 제품 중에서도 아직 괜찮은 제품이 많다. 예를 들어 MSI GE76 게이밍 노트북은 빠른 CPU와 고성능 155W GPU를 탑재했고, 전면 모서리에는 RGB 라이트가 달려 있다.
11세대 칩과 마찬가지로 코어와 클록 속도의 차이가 크지 않으므로 대부분의 사용자에게 코어 i7과 코어 i9 간의 차이는 미미하다. 코어 i9-10980HK의 최대 부스트 클록은 5.3GHz, 코어 i7-10870H는 5GHz로, 두 칩의 차이는 약 6%다. PC를 최대 한계까지 사용해야 하는 경우가 아니라면 더 비싼 비용을 들여 10세대 코어 i9를 구매할 이유가 없다.
*10세대 승자: 대부분의 사용자에게 코어 i7
9세대: 코어 i9 대 코어 i7
인텔은 9세대 커피 레이크 리프레시(Coffee Lake Refresh) 노트북 H급 CPU에서 14nm 공정을 계속 유지했다. 코어 i9는 더 높은 클록 속도(최대 5GHz)를 제공하며 8개의 CPU 코어를 탑재했다. 물론 이 칩은 2년 전에 출시됐지만 인텔이 설계를 도운 XPG 제니아(Xenia) 15 등 아직 괜찮은 게이밍 노트북이 있다. 얇고 가볍고 빠르며 엔비디아 RTX GPU를 내장했다.
8코어 4.8GHz 코어 i9-9880HK와 4.6GHz 6코어 코어 i7-9850의 클록 속도 차이는 약 4%로, 실제 사용 시 유의미한 차이로 이어지는 경우는 극소수다. 두 CPU 모두 기업용 노트북에 많이 사용됐다. 대부분의 소비자용 노트북에는 8코어 5GHz 코어 i9-9880HK와 6코어 4.5GHz 코어 i7-9750H가 탑재됐다. 이 두 CPU의 클록 차이는 약 11%로, 이 정도면 유의미한 차이지만 마찬가지로 대부분의 경우 실제로 체감하기는 어렵다.
그러나 코어 수의 차이는 멀티 스레드 애플리케이션에서 큰 체감 효과로 이어지는 경우가 많다. 3D 모델링 테스트인 씨네벤치(Cinebench) R20에서 코어 i9-9980HK를 탑재한 구형 XPS 15의 점수는 코어 i7-9750H를 탑재한 게이밍 노트북보다 42% 더 높았다. 8코어 코어 i9의 발열을 심화하는 무거운 부하에서는 성능 차이가 약 7%로 줄어들었다. 여기에는 노트북의 설계가 큰 영향을 미칠 것이다. 어쨌든 일부 상황에서는 8코어가 6코어보다 유리하다.
또한 수치해석의 경우 결과를 분석하는 작업중의 많은 부분이 POST 작업으로 그래픽처리가 필요하다. 따라서 아래 영상편집을 위한 노트북에 대한 자료도 선택에 도움이 될것으로 보인다.
영상 편집을 위한 최고의 노트북 9선
Brad Chacos, Ashley Biancuzzo, Sam Singleton | PCWorld
영상을 편집하다 보면 컴퓨터의 여러 리소스를 집약적으로 사용하기 마련이다. 그래서 영상 편집은 대부분 데스크톱 PC에서 하는 경우가 많지만, 노트북에서 영상을 편집하려 한다면 PC만큼 강력한 사양이 뒷받침되어야 한다.
영상 편집용 노트북을 구매할 때 가장 비싼 제품을 선택할 필요는 없다. 사용 환경에 맞게 프로세서, 디스플레이의 품질, 포트 종류 등을 다양하게 고려해야 한다. 다음은 영상 편집에 최적화된 노트북 제품이다. 추천 제품을 확인한 후 영상 편집용 노트북을 테스트하는 팁도 참고하자.
1. 영상 편집용 최고의 노트북, 델 XPS 17(2022)
장점 • 가격 대비 강력한 기능 • 밝고 풍부한 색채의 대형 디스플레이 • 썬더볼트 4 포트 4개 제공 • 긴 배터리 수명 • 시중에서 가장 빠른 GPU인 RTX 3060
단점 • 무겁고 두꺼움 • 평범한 키보드 • USB-A, HDMI, 이더넷 미지원
델 XPS 17(2022)이야말로 콘텐츠 제작에 최적화된 노트북이다. 인텔 12세대 코어 i7-12700H 프로세서 및 엔비디아 지포스 RTX 3060는 편집을 위한 뛰어난 성능을 제공한다. 1TB SSD도 함께 지원되기에 데이터를 옮길 때도 편하다.
XPS 17은 SD카드 리더, 여러 썬더볼트 4 포트, 3840×2400 해상도의 17인치 터치스크린 패널, 16:10 화면 비율과 같은 영상 편집자에게 필요한 기능을 포함한다. 무게도 2.5kg 대로 비교적 가볍다. 배터리 지속 시간은 한번 충전 시 11시간인데, 이전 XPS 17 버전보다 1시간 이상 늘어난 수치다.
2. 영상 편집에 최적화된 스크린, 델 XPS 15 9520
장점 • 뛰어난 OLED 디스플레이 • 견고하고 멋진 섀시(Chassis) • 강력한 오디오 • 넓은 키보드 및 터치패드
단점 • 다소 부족한 화면 크기 • 실망스러운 배터리 수명 • 시대에 뒤떨어진 웹캠 • 제한된 포트
델 XPS 15 9520은 놀라운 OLED 디스플레이를 갖추고 있으며, 최신 인텔 코어 i7-12700H CPU 및 지포스 RTX 3050 Ti 그래픽이 탑재되어 있다. 컨텐츠 제작 및 영상 편집용으로 가장 선호하는 제품이다. 시스템도 좋지만 투박하면서 금속 소재로 이루어진 외관이 특히 매력적이다.
15인치 노트북이지만 매일 갖고 다니기에 다소 무거운 것은 단점이다. XPS 17 모델에서 제공되는 포트도 일부 없다. 그러나 멋진 OLED 디스플레이가 단연 돋보이며, 3456X2160 해상도, 16:10 화면 비율, 그리고 매우 선명하고 정확한 색상을 갖추고 있어 좋다.
3. 최고의 듀얼 모니터 지원, 에이수스 젠북 프로 14 듀오 올레드
장점 • 놀라운 기본 디스플레이와 보기 쉬운 보조 디스플레이 • 탁월한 I/O 옵션 및 무선 연결 • 콘텐츠 제작에 알맞은 CPU 및 GPU 성능
단점 • 생산성 노트북 치고는 부족한 배터리 수명 • 작고 어색하게 배치된 트랙패드 • 닿기 어려운 포트 위치
에이수스 젠북 프로 14 듀오(Asus Zenbook Pro 14 Duo OLED)는 일반적이지 않은 노트북이다. 일단 사양은 코어 i7 프로세서, 지포스 RTX 3050 그래픽, 16GB DDR5 메모리, 빠른 1TB NVMe SSD를 포함해 상당한 성능을 자랑한다. 또한 초광도의 547니트로 빛을 발하는 한편 DCI-P3 색영역의 100%를 커버하는 14.5인치 4K 터치 OLED 패널을 갖추고 있다. 사실상 콘텐츠 제작자를 위해 만들어진 제품이라 볼 수 있다.
가장 흥미로운 부분은 키보드 바로 위에 위치한 12.7인치 2880×864 스크린이다. 윈도우에서는 해당 모니터를 보조 모니터로 간주하며, 사용자는 번들로 제공된 에이수스 소프트웨어를 사용해 트랙패드로 사용하거나 어도비 앱을 위한 터치 제어 패널을 표시할 수 있다. 어떤 작업이든 유용하게 써먹을 수 있다.
젠북 프로 14 듀오 올레드는 기본적으로 휴대용이자 중간급 워크스테이션이다. 단, 배터리 수명은 평균 수준이기 때문에 중요한 작업 수행이 필요한 경우, 반드시 충전 케이블을 가지고 다녀야 한다. 그럼에도 불구하고 젠북 프로 14 듀오 올레드는 3D 렌더링 및 인코딩과 같은 작업에서 탁월한 성능을 보여 콘텐츠 제작자들에게 맞춤화 된 컴퓨터이다. 듀얼 스크린은 역대 최고의 기능이다.
4. 영상 편집하기 좋은 포터블 노트북, 레이저 블레이드 14(2021)
장점 • AAA 게임에서 뛰어난 성능 • 훌륭한 QHD 패널 • 유난히 적은 소음
단점 • 700g으로 무거운 AC 어댑터 • 비싼 가격 • 썬더볼트 4 미지원
휴대성이 핵심 고려 사항이라면, 레이저 블레이드 14(Razer Blade 14) (2021)를 선택해 보자. 노트북 두께는 1.5cm, 무게는 1.7kg에 불과해 비슷한 수준의 노트북보다 훨씬 가볍다. 사양은 AMD의 8-코어 라이젠 9 5900HX CPU, 엔비디아의 8GB 지포스 RTX 3080, 1TB NVMe SSD, 16GB 메모리를 탑재하고 있어 사양도 매우 좋다.
그러나 휴대성을 대가로 몇 가지 이점을 포기해야 할 수 있다. 일단 14인치 IPS 등급 스크린은 공장에서 보정된 상태로 제공되지만, 최대 해상도는 2560×1440다. 또 풀 DCI-P3 색영역을 지원하지만 4K 영상 편집은 불가능하다. 거기에 레이저 블레이드 14는 SD 카드 슬롯도 없다. 다만 편집 및 렌더링을 위한 강력한 성능을 갖추고 있고 가방에 쉽게 넣을 수 있는 제품인 것은 분명하다.
5. 배터리 수명이 긴 노트북, 델 인스피론 16
장점 • 넉넉한 16인치 16:10 디스플레이 • 긴 배터리 수명 • 경쟁력 있는 애플리케이션 성능 • 편안한 키보드 및 거대한 터치패드 • 쿼드 스피커(Quad speakers)
단점 • GPU 업그레이드 어려움 • 512GB SSD 초과 불가 • 태블릿 모드에서는 어색하게 느껴질 수 있는 큰 스크린
긴 배터리 수명을 가장 최우선으로 고려한다면, 델 인스피론 16(Dell Inspiron 16)을 살펴보자. 콘텐츠 제작 작업을 하며테스트해보니, 인스피론 16은 한 번 충전으로 16.5시간 동안 이용할 수 있다. 외부에서 작업을 마음껏 편집할 수 있는 시간이다. 그러나 무거운 배터리로 인해 무게가 2.1 kg에 달하므로 갖고 다니기에 적합한 제품은 아니다.
가격은 저렴한 편이나 몇 가지 단점이 있다. 일단 인텔 코어 i7-1260P CPU, 인텔 아이리스 Xe 그래픽, 16GB 램, 512GB SSD 스토리지를 탑재하고 있다. 이 정도 사양으로 영상 편집 프로젝트 대부분을 작업할 수 있으나, 스토리지 용량이 부족하기 때문에 영상 파일을 저장할 경우 외장 드라이브가 필요하다. 그러나 델 인스피론 16이 진정으로 빛을 발하는 부분은 단연 배터리 수명이다. 또한 강력한 쿼드 스피커 시스템도 사용해 보면 만족할 것이다. 포트의 경우, USB 타입-C 2개, USB-A 3.2 Gen 1 1개, HDMI 1개, SD 카드 리더 1개, 3.5mm 오디오 잭 1개가 제공된다.
6. 게이밍과 영상 편집 모두에 적합한 노트북, MSI GE76 레이더
장점 • 뛰어난 성능을 발휘하는 12세대 코어 i9-12900HK • 팬 소음을 크게 줄이는 AI 성능 모드 • 1080p 웹캠과 훌륭한 마이크 및 오디오로 우수한 화상 회의 경험 제공
단점 • 동일한 유형의 세 번째 버전 • 어수선한 UI • 비싼 가격
사양이 제일 좋은 제품을 찾고 있을 경우, 크고 무거운 게이밍 노트북을 선택해 보자. MSI GE76 레이더(Raider)는 강력한 14-코어 인텔 코어 i9-12900HK 칩, 175와트의 엔비디아 RTX 3080 Ti가 탑재됐고, 충분한 내부 냉각 성능 덕분에 UL의 프로시온(Procyon) 벤치마크의 어도비 프리미어 테스트에서 다른 노트북보다 훨씬 뛰어난 성능을 보였다. MSI GE76 레이더는 심지어 고속 카드 전송을 위해 PCle 버스에 연결된 SD 익스프레스(SD Express) 카드 리더도 갖추고 있다.
동일한 제품의 작년 모델은 게이머 중심의 360Hz 1080p 디스플레이를 지원한다. 영상 편집 과정에서는 그닥 이상적이지 않은 사양이다. 그러나 2022년의 12UHS 고급 버전은 4K, 120Hz 패널을 추가했는데, 이 패널은 콘텐츠 생성에 맞춰 튜닝 되지는 않았으나 17.3인치의 넓은 스크린 크기이기에 영상 편집자에게 꽤 유용하다.
7. 가성비 좋은 노트북, HP 엔비 14t-eb000(2021)
장점 • 높은 가격 대비 우수한 성능 • 환상적인 배터리 수명 • 성능 조절이 감지되지 않을 정도의 저소음 팬 • 썬더볼트 4 지원
단점 • 약간 특이한 키보드 레이아웃 • 비효율적인 웹캠의 시그니처 기능
가장 빠른 영상 편집 및 렌더링을 원할 경우 하드웨어에 더 많은 비용을 들여야 하지만, 예산이 넉넉하지 않을 때가 있다. 이때 HP 엔비(Envy) 14 14t-eb000) (2021)를 이용해보면 좋다. 가격은 상대적으로 저렴한 편이고 견고한 기본 컨텐츠 제작에 유용하다.
엔트리 레벨의 지포스 GTX 1650 Ti GPU 및 코어 i5-1135G7 프로세서는 그 자체로 업계 최고 제품은 아니다. 하지만 일반적인 편집 작업을 충분히 수행할 수 있는 사양이다. 분명 가성비 좋은 제품이다. 14인치 1900×1200 디스플레이는 16:10 화면 비율로 생산성을 향상하고, 공장 색 보정과 DCI-P3는 지원하지 않지만 100% sRGB 지원을 제공한다. 그뿐만 아니라, HP 엔비 14의 경우 중요한 SD 카드 및 썬더볼트 포트가 포함되며, 놀라울 정도로 조용하게 실행된다.
8. 컨텐츠 제작에 알맞은 또다른 게이밍 노트북, 에이수스 ROG 제피러스 S17
장점 • 뛰어난 CPU 및 GPU 성능 • 강력하고 혁신적인 디자인 • 편안한 맞춤형 키보드
단점 • 약간의 압력이 필요한 트랙패드 • 상당히 높은 가격
에이수스 ROG 제피러스(Zephyrus) S17은 영상 편집자의 궁극적인 꿈이다. 이 노트북은 초고속 GPU 및 CPU 성능과 함께 120Hz 화면 재생률을 갖춘 놀라운 17.3인치 4K 디스플레이를 탑재하고 있다. 견고한 전면 금속 섀시, 6개의 스피커 사운드 시스템 및 맞춤형 키보드는 프리미엄급 경험을 더욱 향상한다. 거기다 SD 카드 슬롯 및 풍부한 썬더볼트 포트가 포함되어 있어 더욱 좋다. 그러나 이를 위해 상당한 비용을 지불해야 한다. 예산이 넉넉하고 최상의 제품을 원한다면 제피루스 S17을 선택하면 된다.
9. 강력한 휴대성을 가진 노트북, XPG 제니아 15 KC
장점 • 가벼운 무게 • 조용함 • 상대적으로 빠른 속도
단점 • 중간 수준 이하의 RGB • 평범한 오디오 성능 • 느린 SD 카드 리더
사양이 좋은 노트북의 경우, 대부분 부피가 크고 무거워서 종종 2.2kg 또는 2.7kg를 넘기도 한다. XPG 제니아 15 KC(XPG Xenia 15 KC)만은 예외다. XPG 제니아 15 KC의 무게는 1.8kg가 조금 넘는 수준으로, 타제품에 비해 상당히 가볍다. 또한 소음도 별로 없다. 원래 게이밍 노트북 자체가 소음이 크기에 비교해보면 큰 장점이 될 수 있다. 1440p 디스플레이와 상대적으로 느린 SD 카드 리더 성능으로 인해 일부 콘텐츠 제작자들이 구매를 주저할 수 있으나, 조용하고 휴대하기 좋은 제품을 찾고 있다면 제니아 15 KC가 좋은 선택지다.
영상 편집 노트북 구매 시 고려 사항
영상 편집 노트북 구매 시 고려해야 할 가장 중요한 사항은 CPU 및 GPU다. 하드웨어가 빨라질수록 편집 속도도 빨라진다. 필자는 UL 프로시온 영상 편집 테스트(UL Procyon Video Editing Test)를 통해 속도를 테스트해보았다. 이 벤치마크는 2개의 서로 다른 영상 프로젝트를 가져와 색상 그레이딩 및 전환과 같은 시각적 효과를 적용한 다음, 1080p와 4K 모두에서 H.264, H.265를 사용해 내보내는 작업을 어도비 프리미어가 수행하도록 한다.
성능은 인텔의 11세대 프로세서를 실행하는 크고 무거운 노트북에서 가장 높았고, AMD의 비피 라이젠 9(beefy Ryzen 9) 프로세서를 탑재한 노트북이 바로 뒤를 이었다. 10세대 인텔 칩은 여전히 상당한 점수를 기록하고 있다. 위의 차트에는 없으나 새로운 인텔 12세대 노트북은 더 빨리 실행된다. 최고 성능의 노트북은 모두 최신 인텔 CPU 및 엔비디아의 RTX 30 시리즈 GPU를 결합했는데, 두 기업 모두 어도비 성능 최적화에 많은 시간 및 리소스를 투자했기 때문에 놀라운 일은 아니다.
GPU는 어도비 프리미어 프로에서 CPU보다 더 중요하지만, 매우 빠르게 수확체감 지점에 다다른다. 최고급 RTX 3080 그래픽을 사용하는 노트북은 RTX 3060 그래픽을 사용하는 노트북보다 영상 편집 속도가 더 빠르나, 속도 차이가 크지는 않다. 델 XPS 17 9710의 점수를 살펴보면, 지포스 RTX 3060 노트북 GPU는 MSI GE76 레이더의 가장 빠른 RTX 3080보다 14% 더 느릴 수 있다. 특히 GE76 레이더가 델 노트북에 비해 얼마나 더 크고 두꺼운지를 고려할 때 수치가 크지는 않다.
일반적으로 그래픽과 영상 편집을 위해 적어도 RTX 3060을 갖추는 것을 권장한다. 그러나 영상 편집은 워크플로에 크게 의존한다. 특정 작업 및 도구는 CPU 집약적이거나 프리미어보다 GPU에 더 의존할 수 있다. 이 경우 원하는 요소의 우선순위를 조정하길 바란다. 앞서 언급한 목록은 기본적으로 여러 요소를 종합적으로 고려해서 만든 내용이다.
인텔 및 엔비디아는 각각 퀵 싱크(Quick Sync) 및 쿠다(CUDA)와 같은 도구를 구축하는 데 수년을 보냈고, 이로 인해 많은 영상 편집 앱의 속도는 크게 향상될 수 있다. AMD 하드웨어는 영상 편집에 적합하나 특히 워크플로가 공급업체별 소프트웨어 최적화에 의존하는 경우, 특별한 이유가 없는 한 인텔 및 엔비디아를 사용하는 것을 추천한다.
그러나 내부 기능만 신경 써서는 안된다. PC월드의 영상 디렉터인 아담 패트릭 머레이는 “영상 편집에 이상적인 노트북에는 카메라로 촬영 중 영상 파일을 저장하는 SD 카드 리더가 포함되어 있다”라고 강조한다. 또한 머레이는 영상 편집에 이상적인 게임용 노트북에서 흔히 볼 수 있는 초고속 1080p 패널보다 4k, 60Hz 패널을 갖춘 노트북을 선택할 것을 추천한다.
4K 영상을 잘 편집하려면 4K 패널이 필요하며, 초고속 화면 재생률은 게임에서처럼 영상 편집에는 아무런 의미가 없다. 예를 들어, 개인 유튜브 채널용으로 일상적인 영상만 만드는 경우 색상 정확도가 중요하지 않을 수 있다. 그러나 색상 정확도가 중요할 경우, 델타 E < 2 색상 정확도와 더불어 DCI-P3 색 영역 지원은 필수적이다.
게임용 노트북은 사양이 좋지만 콘텐츠 제작용으로는 조금 부족해 보일 수 있다. 게임용과 콘텐츠 제작용으로 함께 쓰는 노트북을 원한다면, 게임용으로 노트북 한 대를 구매하고, 색상을 정확히 파악하기 위한 모니터를 추가로 구매하는 것도 방법이다. editor@itworld.co.kr
코어가 많은 그래픽카드의 경우 가격이 상상 이상으로 높습니다. 빠르면 빠를수록 좋겠지만 어디까지나 예산에 맞춰 구매를 해야 하는 현실을 감안할 수 밖에 없는 것 같습니다.
한가지 유의할 점은 엔비디아의 GTX 게이밍 하드웨어는 모델에 따라 다르기는 하지만, 볼륨 렌더링의 속도가 느리거나 오동작 등 몇 가지 제한 사항이 있습니다. 일반적으로 노트북에 내장된 통합 그래픽 카드보다는 개별 그래픽 카드를 강력하게 추천합니다. 최소한 그래픽 메모리는 512MB 이상이어야 하고 1GB이상을 권장합니다.
2021-12-15 현재 그래픽카드의 성능 순위는 위와 다음과 같습니다. 출처: https://www.videocardbenchmark.net/high_end_gpus.html
주요 Notebook
출시된 모든 그래픽 카드가 노트북용으로 장착되어 출시되지는 않기 때문에, 현재 오픈마켓 검색서비스를 제공하는 네이버에서 Lenovo Quadro 그래픽카드를 사용하는 노트북을 검색하면 아래와 같습니다. 검색 시점에 따라 상위 그래픽카드를 장착한 노트북의 대략적인 가격을 볼 수 있을 것입니다.
<검색 방법> 네이버 쇼핑 검색 키워드 : 컴퓨터 제조사 + 그래픽카드 모델 + NoteBook 형태로 검색 Lenovo quadro notebook or HP quadro notebook 또는 Lenovo firepro notebookorHP firepronotebook
( 2021-12-15기준)
대부분 검색 시점에 따라 최신 CPU와 최신 그래픽카드를 선택하여 검색을 하면 예산에 적당한 노트북을 자신에게 맞는 최상의 노트북을 어렵지 않게 선택할 수 있습니다.
알루미늄 6061의 초음파 용융 처리 중 용융 풀 역학에 대한 고속 동기화된 X선 영상 촬영
Lovejoy Mutswatiwa, Lauren Katch, Nathan J Kizer, Judith A Todd, Tao Sun, Samuel J Clark, Kamel Fezzaa, Jordan S Lum, David M Stobbe, Griffin Jones, Kenneth C Meinert Jr., Andrea P Argüelles, Christopher M Kube
Abstract
Ultrasonic processing of solidifying metals in additive manufacturing can provide grain refinement and advantageous mechanical properties. However, the specific physical mechanisms of microstructural refinement relevant to laser-based additive manufacturing have not been directly observed because of sub-millimeter length scales and rapid solidification rates associated with melt pools. Here, high-speed synchrotron X-ray imaging is used to observe the effect of ultrasonic vibration directly on melt pool dynamics and solidification of Al6061 alloy. The high temporal and spatial resolution enabled direct observation of cavitation effects driven by a 20.2 kHz ultrasonic source. We utilized multiphysics simulations to validate the postulated connection between ultrasonic treatment and solidification. The X-ray results show a decrease in melt pool and keyhole depth fluctuations during melting and promotion of pore migration toward the melt pool surface with applied sonication. Additionally, the simulation results reveal increased localized melt pool flow velocity, cooling rates, and thermal gradients with applied sonication. This work shows how ultrasonic treatment can impact melt pools and its potential for improving part quality.
Introduction
Laser-based metal additive manufacturing (AM), a three-dimensional printing technique, can manufacture single components and structures with highly complex geometries, functionally graded alloys1, tailored microstructures2, and enhanced mechanical properties3. However, for most alloys, thermal cracking, porosity, and columnar grains4 reduce mechanical properties and prevent the widespread adoption of AM parts5. Establishing techniques for influencing solidification toward grain refinement could lead to parts with better mechanical properties and, ultimately, improve the reliability and quality of AM components6. The variation of AM process parameters, such as laser power, scan speed, and energy density7 allows control of thermal gradients and cooling rates, resulting in location-specific microstructural refinement2. However, process parameter optimization can be challenging, especially for alloys that are difficult to print. In addition to process parameter adjustment, inoculants can be added to the AM process to promote heterogeneous nucleation in the melt pool, resulting in grain refinement8. However, inoculants unavoidably change the chemical composition of the material, which can impact the mechanical strength of AM components9. In addition, inoculants can cause inclusions due to settlement and agglomeration10.
Other techniques for solidification control can be achieved by applying external fields such as electromagnetic11, mechanical12, or acoustic13 fields. In casting, electromagnetic fields were reported to increase cooling rates14, which resulted in reduced alloying element segregation and a more homogeneous macrostructure. Low-frequency mold vibration also succeeded in solidification manipulation during casting, resulting in a refined as-cast grain structure15. The application of high-intensity ultrasound on solidifying metals for molten metal processing during welding resulted in grain refinement and improved weld joint strength16. Nonetheless, using these techniques in laser-based metal AM is challenging because of the short length and time scales involved in melt pool dynamics and solidification17.
Following the work of Eskin18 and Abramov19, and applying successful grain refinement techniques in welding20, Todaro et al.21 recently demonstrated that high-intensity ultrasound can promote columnar to equiaxed grain transitions (CET) in laser AM fabricated Ti-6Al-4V and Inconel 625. As a result, components built with a fine, equiaxed grain structure exhibited increased yield and tensile strengths. One form of ultrasonic melt processing in AM involves laser metal powder consolidation on a substrate vibrating at ultrasonic frequencies (i.e., sonicated substrates). An applied ultrasonic frequency of 20 kHz on an AM-fabricated 316L stainless steel plate resulted in a noticeable decrease in grain sizes and an increase in random grain orientations22. Similarly, a reduction in mechanical property anisotropy and grain refinement along the build direction in wire arc AM was recently observed after ultrasonic treatment23. Ivanov et al.24 and Yoon et al.25 leveraged high-frequency pulsed laser irradiation to introduce high-intensity ultrasonic waves in the melt pool, resulting in microstructural refinement. Wang et al.26 used ultrasonic vibration-assisted AM to fabricate Inconel 718 parts and investigated the influence of four ultrasonic frequencies (i.e., 0, 25, 33, and 41 kHz) on microstructural refinement and mechanical properties. While ultrasonic melt processing at 25 kHz increased mechanical strength, the use of higher ultrasonic frequencies was observed to increase porosity and hardness. Wang et al.26 elucidated the effects of frequency, yet the effect of other ultrasonic wave parameters, such as vibration amplitude and acoustic intensity, on grain refinement, remained unclear.
The observed microstructural refinement in AM ultrasonic melt processing reported in the literature is hypothesized to result from increased nucleation rates and sites caused by acoustic cavitation and streaming induced in the melt pool. Acoustic cavitation and streaming have been suggested to compete with Marangoni convection, recoil pressure, and surface tension forces in the melt pool27, influencing solidification rates and thermal gradients and promoting columnar to fine equiaxed grain transitions28. Cavitation was observed in high-speed synchrotron X-ray imaging experiments within a controlled casting with ultrasonic treatment by Wang et al.29. They observed acoustic cavitation bubbles imploding in a Bi-8%Zn alloy on the solid-liquid interface, causing fragmentation of the solid phase in the mushy zone. Moreover, acoustic streaming was observed to disperse solid particles in the liquid, which have been reported to later act as solidification nuclei30. In AM, however, the melting and solidification processes occur rapidly, presenting spatial and temporal resolution challenges in direct cavitation observation. In their study focused on observing grain refinement mechanisms in ultrasound-assisted AM, Ji et al.31 stated that because of extremely high temperature, opacity, and short survival time, it is hardly possible to directly observe the process of ultrasound effect on the molten metal pool in AM through experiments. While direct observation of dendrite fracture would be challenging, recent high-speed X-ray imaging of keyhole dynamics in AM32 allows observation of cavitation bubbles directly during ultrasound-assisted AM.
In this work, high-speed synchrotron X-ray imaging at the Advanced Photon Source, Argonne National Laboratory was used to capture acoustic cavitation in high-temperature, viscous, and opaque sub-millimeter scale melt pools within an Al6061 sample. Ultrasonic treatment was observed to alter keyhole morphology, which could potentially reduce or eliminate porosity generated from keyhole tip collapse, in addition to reducing dynamic keyhole instabilities. Ultrasonic treatment influenced bubble dynamics, causing pore migration toward the melt pool surface. The reported results demonstrated the existence and influence of cavitation on laser-generated melt pool dynamics during ultrasonic melt processing, which was previously hypothesized by Todaro et al.21,22, Feilong et al.23, and Wang et al.26. The multiphysics Computational fluid dynamics (CFD) simulations using the Flow-3DⓇ platform showed an increase in melt pool flow velocity, thermal gradients, and cooling rates with applied ultrasonic treatment. This study provides direct evidence that acoustic cavitation effects are present in laser-generated melt pools and can be studied using high-speed X-ray imaging and CFD simulations. Thus, controlling acoustic cavitation, microstructure, and, henceforth, mechanical properties and part quality is now a closer reality33.
Results
In-situ synchrotron X-ray imaging of acoustic cavitation in melt pools
Figure 1 shows the primary features of the experimental setup. The experiment consisted of a continuous-wave ytterbium fiber laser with user set powers ranging from 100 to 560 W, the high-speed X-ray imaging system (see details in29), and an Al6061 sample mounted vertically on top of a Langevin transducer driven at its lowest order extensional resonance frequency of 20.2 kHz. Single-pulse X-ray images were collected at a rate of 50 kHz to observe melt pool dynamics, cavitation bubble dynamics, and solidification. X-ray computed tomography (CT) and electron backscattered diffraction (EBSD) were used to further characterize the pore structure ex-situ.
Fig. 1: Experimental setup. Schematic diagram illustrating the experimental setup for high-speed X-ray imaging of melt pools on a vibrating substrate.
A representative X-ray image showing annotated melt pool features and vibration direction is shown in Fig. 2. X-ray absorption and phase contrast allowed easy identification of the solid/liquid transition region, vapor depression area, and microscale bubbles from cavitation. Supplementary Movie 1 shows the entire single-point melt pool and solidification process when the 350 W laser is applied for 3.34 ms without sonication. In addition, the video shows highly dynamic features such as bubble motion, melt pool size fluctuation, and keyhole initiation, growth, and fluctuation. The high spatial (i.e., 2 μm/pixel) and temporal (i.e., 50,000 frames per second) resolutions afforded by the high-energy synchrotron facility enabled direct quantifiable observation of the microscale bubble dynamics within the melt pool. The effect of the vibration could then be easily observed by conducting measurements with and without the active ultrasonic transducer. While the vibration was active, the X-ray imaging allowed direct measurement of the vibration amplitude of approximately 8 μm (more details on image processing and measurements are provided in the “Methods” section).
Fig. 2: Melt pool X-ray frame. An X-ray frame showing the melt pool boundary at the solid/liquid interface, the keyhole or vapor depression morphology, the keyhole rim, hot spatter, a microbubble, and vibration direction. The video from which this frame was extracted is found in Supplementary Movie 1.
Figure 3a, b depict real-time X-ray image sequences of stationary laser-generated molten Al6061 pool dynamics without and with sonication, respectively. Supplementary Movie 2 is the associated high-speed videos containing the frames seen in Fig. 3a, b. In Fig. 3a, a narrow and deep vapor depression or keyhole can be observed in melt pools without sonication. Keyhole melt pools with these characteristics are known to be susceptible to keyhole porosity in AM when the tip of the vapor depression pinches off and forms a bubble32,34. Without sonication, bubbles were observed to settle at the bottom of the melt pool, where the solidification front could quickly freeze them, resulting in porosity. Figure 3a also shows strong fluctuations in keyhole depth, which is a characteristic of keyhole instability35.
Fig. 3: X-ray image sequences showing laser-generated molten Al6061 pools. Melt pools (a) without and (b) with sonication. The six X-ray frames were taken at 0.02 ms intervals, beginning at 2.96 ms after the laser was turned on. The video from which these frames were extracted is found in Supplementary Movie 2.
The bubble density is shown to increase due to sonication as depicted in Fig. 3b and Supplementary Movie 2, proving the sonication leads to bubble nucleation in the liquid phase separate from the keyhole region. The bubbles in the melt pool with sonication rapidly nucleate, grow, oscillate, and sometimes implode, demonstrating cavitation bubble behavior. In addition, acoustic streaming effects were observed, where the molten metal flows in the vibration direction36,37. Sonication increased the average bubble diameter and promoted bubble migration towards the melt pool surface (Supplementary Movie 2). Bubbles with larger diameters were observed to implode at the melt pool surface, demonstrating degassing characteristics. In conventional AM, the melt flow-induced drag force dominates bubble dynamics38. Based on the observed bubble dynamics in melt pools with sonication, it can be pointed out that bubble growth due to cavitation increases the buoyancy force, overcoming the drag force that usually traps pores38, steering the bubbles toward the melt pool surface, and promoting degassing39. In addition, we speculate that primary and secondary Bjerknes acoustic radiation forces may exist in the melt pool, facilitating bubble translation toward the melt pool surface and causing degassing40. The concentration of porosity toward the melt pool surface induced by sonication might be convenient in metal AM because the remelting between successive layers could eliminate the residual porosity from previous layers.
Figure 3b also shows a reduction in the keyhole depth fluctuations and an increase in the keyhole tip radius with sonication. These phenomena resulted in the elimination of the keyhole tip pinch-off porosity32. However, sonication was observed to eject molten metal from the melt pool, as shown in the X-ray frame at 2.96 ms with sonication in Fig. 3b. Further investigation on the influence of substrate vibration directions (i.e., in-plane or out-of-plane vibration) and vibration amplitudes and frequencies could help minimize potential spatter in laser-based AM with ultrasonic melt processing and will be explored in our future research.
Influence of ultrasonic treatment on melt pool geometry and dynamics
The variations in the keyhole and melt pool depths, with and without sonication, are illustrated in Fig. 4. The melt pool depths, keyhole depths, and melt pool widths were measured from the point where sizable contrast difference between the liquid/solid and gas/liquid phases could be observed in the X-ray images. From Fig. 4a, it can be observed that the keyhole depth without sonication was larger than the sonicated keyhole. Melt pool and keyhole depths were shown to fluctuate at constant laser power41, indicative of instabilities34. The depth fluctuations were quantified as one standard deviation about the mean of the measured depths. With sonication, the melt pool depth standard deviation was 66.3 μm, whereas it was 111.6 μm without. Similarly, the keyhole depth standard deviation was 31.6 μm compared to 57.6 μm with and without sonication, respectively. This indicates ultrasonic treatment reduces fluctuations, leading to more stable dynamics. Without sonication, the melt pool began in conduction mode as shown in Fig. 4c from 2.8 to 4.25 ms, after which the melt pool transitioned into the keyhole mode. Conversely, with sonication, the melt pool started directly in keyhole mode. In both cases, the transition from conduction to keyhole mode occurred rapidly until stabilizing after about 5.5 ms.
Fig. 4: Influence of ultrasonic treatment on melt pool and keyhole geometry. a Keyhole depth, b Keyhole aspect ratios (keyhole depth divided by fixed laser beam diameter of 80 μm), c Melt pool depths, and d Melt pool aspect ratios (melt pool width divided by depth based on measurements from X-ray images) with and without sonication. Red plain line shows measurements without sonication while black line with circular markers shows measurements with sonication.
Keyhole morphology also plays a role in melt pool dynamics and defect formation during laser-based metal AM processes. Fig. 4b shows the Keyhole aspect ratios calculated from measured depths divided by the 80 μm laser diameter35. These results show lower keyhole aspect ratios in sonicated melt pools. A high aspect ratio represents a deep and narrow keyhole with a needle-like tip, while a low keyhole aspect ratio represents a wide keyhole with an observable tip radius. A deep and narrow keyhole traps laser beam reflections at the bottom, leading to a J-shaped keyhole in moving laser scenarios32, which are susceptible to keyhole tip pinch-off porosity38,42. Therefore, ultrasonic treatment in metal AM can potentially eliminate one of the major keyhole porosity driving mechanisms by decreasing the keyhole aspect ratio and increasing keyhole-tip radius. Figure 4 d depicts the melt pool aspect ratio with and without sonication. In the absence of sonication, a high melt pool aspect ratio was observed when the melt pool was in conduction mode (i.e., from 2.7 to 4.4 ms) compared to the keyhole mode. There was not a significant difference in the melt pool aspect ratio due to sonication.
Laser energy absorptivity is known to be influenced by melt pool and keyhole depths43. Thus, the difference in melt pool geometries in ultrasonically treated melt pools relative to non-ultrasonically treated melt pools could result from the variation in the position of the laser focal point relative to the melt surface caused by the back-and-forth motion of the vibrating sample, promoting multiple laser beam reflections, resulting in improved laser energy absorptivity. This is possible at high vibration amplitudes to laser spot size ratios. However, in our case, a 16 μm peak-to-peak vibration amplitude and a laser spot size of 80 μm will not significantly influence laser energy absorptivity. Therefore, we speculate that the increased absorptivity could be due to the raised melt pool surface above the sample due to ultrasonic vibration causing the keyhole rim to rise while the recoil pressure keeps the bottom of the keyhole stationary. Hence, it results in deeper keyholes that promote multiple laser beam reflections on the vapor/liquid interface and increased absorptivity. In addition, the melt pool temperature could have increased because of bubble implosions, resulting in a larger melt region with applied ultrasound. Improved laser energy absorptivity and large melt pools are advantageous in metal AM to potentially reduce component build time. To investigate these claims further, CFD simulations were conducted to explain the impact of sonication on thermal gradients and cooling rates.
Multiphysics modeling of melt pool dynamics and solidification in ultrasound-assisted AM
High-speed X-ray imaging was able to provide real-time evidence of acoustic cavitation and melt pool dynamics in laser-generated melt pools driven by an external ultrasonic field. Additional insight into pressure distributions, thermal gradients, and cooling rate information is available through bridging the experiments with CFD simulations. In particular, CFD offers the ability to connect thermal properties to microstructural development. To further investigate the influence of ultrasonic treatment on solidification, we conducted multiphysics simulations of single-spot laser-generated melt pools with and without ultrasonic vibration using Flow-3DⓇ. Identical laser and ultrasonic parameters and substrate material used in the X-ray imaging experiments were adopted in the simulations. To reduce the simulation time, the laser duration was set to 0.8 ms compared to 3.4 ms in the experiments. The X-ray images were used to validate the simulations by directly observing melt pool and keyhole morphologies, cavitation bubbles, and solidification structures. Fig. 5a, b compare CFD simulated melt pools to melt pool geometries directly captured in X-ray imaging for the cases of without and with sonication. Deep and narrow keyholes observed with high-speed X-ray imaging in melt pools without sonication were replicated in the simulations. Similarly, an increased keyhole tip radius observed with X-ray imaging in melt pools with sonication was captured in the Flow-3DⓇ simulation. Supplementary Movies 3 and 4 show simulated keyhole dynamics for the two cases. Furthermore, Supplementary Movies 5 and 6 show the results of simulated melt pool dynamics. Similar to the melt pool dynamics undergoing sonication captured by X-ray imaging (i.e., Supplementary Movie 2), the simulated melt pools (i.e., Supplementary Movie 5) showed acoustic cavitation-driven bubble nucleation and implosion caused by pressure variation in the melt pool. Furthermore, the simulated solidification structure with ultrasonic treatment shows frozen cavitation-induced pores like those observed in X-ray imaging and X-ray CT. To further validate the simulations, the measured melt pool aspect ratios (width/depth) from X-ray images were compared with the simulated melt pool aspect ratios. Figs. 5c, d show melt pool aspect ratios, which were found to be closely consistent between simulations and experiments. The close agreement in aspect ratios speaks to the simulations accurately representing the laser energy transfer into the pool
Fig. 5: CFD melt pool simulation comparison with X-ray results. a Melt pool simulation without and with sonication, b comparable experimental results without and with sonication, c Aspect ratios (depth/width) observed in the simulations, and d corresponding experimental aspect ratios.
Melt pool flow dynamics are primarily driven by surface tension, Marangoni convection, and recoil pressure. The application of ultrasound introduces acoustic streaming as an additional driving force. Simulations allowed us to quantify acoustic streaming by comparing velocity vectors at points in the fluid with and without applied ultrasonic treatment. Fig. 6a shows melt pool speed contours and velocity vectors with and without sonication. Supplementary Movies 7 and 8 show additional melt pool dynamics. The higher melt pool velocities in melt pools with sonication confirm that acoustic streaming is a major factor in fluid flow. Figure 6b shows the pressure distribution. Large pressure fluctuations are observed in the presence of sonication. The frames shown in Fig. 6b were taken from the simulation results during solidification and when the laser was switched off. This was done to decouple the sonication from thermal energy input. Supplementary Movies 9 and 10 show animations of pressure distribution in solidifying melt pools with and without sonication, respectively. It can be seen from Fig. 6b that the pressure variation in the melt pool with sonication promoted bubble nucleation. In addition, the influence of ultrasonic vibration can be observed in Fig. 6b with sonication, as ripples of high and low-pressure regions captured by the solidification. Without sonication, no significant pressure variation was observed during solidification. Acoustic cavitation bubble nucleation occurs when the localized pressure within a liquid drops below the vapor pressure of that liquid. Therefore, in Al6061 laser-generated melt pools, it can be seen that if the localized pressure within the melt pool drops below the vapor pressure of molten Al6061, nucleation of bubbles will occur. To investigate the influence of pressure variation on bubble nucleation during melting, the image sequence in Fig. 6c shows the pressure contours at a bubble nucleation site within the melt pool. A decrease in melt pool pressure was observed to result in bubble nucleation, while an increase in pressure promoted bubble implosion.
Fig. 6: CFD melt pool simulation results with and without sonication. a Simulation frames showing velocity vectors of points in the liquid, b pressure distributions, c pressure field at the nucleation of a cavitation bubble and after the collapse.
Microstructure development is directly linked to solidification rates and thermal gradients. To investigate the influence of ultrasonic treatment on solidification conditions, we collected time history temperature gradients and cooling rates at a point within the melt pools with and without sonication. Figure 7a shows the point data probing location at which the time history of parameters that can be related to microstructural development was collected. Figure 7b shows the time history of pressure, cooling rate, thermal gradient, and velocity at the data probing point, with and without sonication. It can be observed that high pressure was observed in melt pools without compared to those with sonication. Conversely, higher cooling rates were observed in melt pools with sonication. Similarly, higher thermal gradients and fluid velocities were observed in melt pools with compared to those without sonication. Figure 7c shows the overall cooling rates and thermal gradients at each simulation time frame over the entire simulation. It can be observed that the overall thermal gradient did not respond to ultrasonic treatment. However, the overall melt pool cooling rate increased with the applied ultrasonic treatment.
Fig. 7: Melt pool thermal history from CFD simulation. a Point data probing location. b The time history of fluid pressure, cooling rates, thermal gradients, and fluid velocities at the data probing point with and without sonication. c Melt pool thermal gradients and cooling rates at each time frame during the entire simulation with (red line plain line) and without sonication (black line with circular markers).
Acoustic cavitation characterization and influence on microstructural development
The primary aim of this article is to unveil the physics associated with ultrasonically driving the melt pool. A secondary aim and a topic of future work is to unveil conditions that lead to refined or tailored microstructures toward improved quality and performance of AM parts. Nevertheless, the solidification microstructures formed in melt pools with and without sonication were characterized using electron backscatter diffraction (EBSD). Fig. 8 a, b show the microstructures and crystallographic orientations of the grains in melt pools without and with sonication, respectively. Since EBSD is destructive, it is noted that the non-sonicated case is a different sample having a single point melt with the same laser power and duration as the sonicated melt pool case. For both samples, the melt pool boundary was traced using standard optical images, in which the melt region was clear (see Supplementary Figs. 6 and 7) and then superimposed on the EBSD grain map. Epitaxial grain growth and cracking along grain boundaries were evident in both cases. A qualitative reduction in grain size is observed in the sonication case but is difficult to ascertain because of the large pore structure as seen by the dark features in Fig. 8b.
Fig. 8: Melt pool EBSD and X-ray computed tomography analysis results. EBSD grain map showing the solidification microstructure (a) without and (b) with sonication. c High-speed X-ray frame showing the final solidification structure and corresponding X-ray computed tomography visualization showing the porosity features and indications of the sonication-driven vibrations (seen by the red arrows).
Moreover, X-ray computed tomography analysis was performed on the final solidification structure (prior to EBSD) to characterize the influence of cavitation and acoustic streaming in sonicated laser-generated melt pools. An X-ray frame from the high-speed imaging showing the final solidification structure and a 3D isosurface of cavitation-induced porosity in the melt pool is shown in Fig. 8c. The X-ray computed tomography reveals evidence of frozen cavitation bubbles and ultrasonic vibration-induced-ripples in the melt pool (i.e., labeled by arrows in the X-ray computed tomography scan image). The ultrasonic wavelength in Al6061 at a frequency of 20.2 kHz was calculated to be 0.32 m, which is orders of magnitude higher than the melt pool depth and width. Thus, the micron scale ripples observed resulted from the sinusoidal variation in pressure from the ultrasonic vibration, which we have also observed in CFD simulations. This discovery calls attention to the influence of vibration amplitudes on cavitation in laser-based AM with ultrasonic treatment, which has not been previously explored. Figure 8c also shows a higher concentration of pores near the sample surface relative to the bottom of the melt pool. Thus, it is further corroborated that ultrasonic treatment causes bubble migration toward the melt pool surface.
Cavitation in ultrasonic molten metal processing has been explored by several researchers28,39,44,45, who conducted casting experiments on light metallic alloys. High-temperature cavitometry46,47 and high-speed imaging48 were used to establish a cavitation threshold in terms of acoustic intensity49. The first-order linear approximation of ultrasonic intensity, I, in an acoustic field is44
where ρ is the fluid density, c is the speed of sound in the fluid, A is the wave amplitude and f is the ultrasonic frequency. An acoustic intensity cavitation threshold of 100 W/cm2 was established for light metal alloys through casting experiments with ultrasonic melt processing44. In the experiments described in the literature29,45, an ultrasonic transducer horn was immersed in molten metal to introduce a propagating wave directly into the solidifying metal. Hence, the cavitation threshold could be established for sizable molten metal pools, and solidification rates would be significantly lower than those in AM processes. Nevertheless, the 100 W/cm2 cavitation threshold has been proposed for laser-based AM printing of light metallic alloys on sonicated substrates21,22,23,31,37,50,51,52,53,54,55,56. However, laser AM fundamentally differs from casting because of the submillimeter-size melt pools that exist for milliseconds owing to the associated rapid solidification rates. In casting, metal melting and solidification are separate processes, whereas melting, molten metal agitation, and solidification occur simultaneously in laser AM with sonication to generate acoustic cavitation. In addition, ultrasonic melt processing in casting involves wave propagation in a solidifying molten metal, while in AM, it involves local vibration of the molten metal. Such factors indicate different physical environments for cavitation in casting and AM. Therefore, validation of acoustic cavitation thresholds in laser-generated melt pools is needed, underpinning the importance of our technique.
Using a wave speed of 4718 m/s, density of 2586 kg/m3, wave amplitude of 8 μm, and frequency of 20.2 kHz in Equation (1) resulted in an acoustic intensity of 628.9 W/cm2. Our calculated acoustic intensity is above the established 100 W/cm2 cavitation threshold. However, cavitation was observed in the CFD simulations at an average acoustic intensity of 10 W/cm2, which is much lower than the established cavitation intensity threshold and the calculated intensity from Equation (1). Therefore, the established cavitation threshold from casting light metals with sonication overestimates the acoustic intensity required to induce cavitation in laser-generated melt pools on vibrating substrates. In the future, we will explore the influence of acoustic intensity on cavitation, porosity, and microstructure refinement.
Discussion
The application of ultrasound in solidifying melt pools in laser-based AM has been shown to promote columnar to equiaxed grain transition57,58 resulting in improved and homogenized mechanical properties and random crystallographic orientations50. By adopting observed microstructural refinement mechanisms in casting with ultrasonic treatment, acoustic cavitation and streaming28 have been hypothesized as the primary driving mechanisms of microstructural refinement in laser-based AM. Unambiguous evidence of cavitation in sub-millimeter scale and opaque laser-generated melt pools has been elusive until now. Here, the real-time influence of ultrasonic vibration on melt pool, keyhole, and bubble dynamics and the solidification of laser-generated melt pools was revealed. We also elucidated the impact of ultrasonic vibration at 20.2 kHz on melt pool and keyhole morphologies. Furthermore, we explained the potential influence of ultrasonic vibration on laser energy absorptivity and its benefits in AM. EBSD and XCT techniques were used to analyze the microstructures and solidification structures with and without applied sonication. The influence of ultrasonic vibration on melt pool flow velocity, pressure distribution, and solidification conditions with and without sonication was investigated using Flow-3DⓇ multiphysics CFD simulation software.
Melt pool and keyhole dynamics in laser-based AM processes influence porosity formation mechanisms38 and dictate the resulting solidification microstructures59 and mechanical properties60 of AM components. Marangoni flow, recoil pressure, and surface tension are some of the major driving forces governing melt pool and keyhole dynamics27. Generating melt pools on a substrate vibrating at ultrasonic frequencies introduces an additional force that drives melt pool flow in the wave propagation direction (i.e., acoustic streaming)37, which competes with existing forces in the melt pool. We used high-speed synchrotron X-ray imaging and Flow-3DⓇ simulations to show that acoustic streaming dominates the melt pool and keyhole dynamics in the laser-generated melt pool with sonication. Moreover, physical evidence of real-time acoustic cavitation in submillimeter-sized laser-generated melt pools was revealed in situ using high-speed X-ray imaging. Ultrasonic vibration was observed to increase bubble density in the melt pool and promote bubble migration toward the melt pool surface. X-ray computed tomography scan of the final solidification structure further demonstrated that ultrasonic vibration drives pores toward the melt pool surface and that vibration amplitude influences molten metal flow rather than ultrasonic wavelength.
Keyhole morphology analysis from high-speed X-ray images revealed a wide and shallow keyhole with applied sonication. A deep and narrow keyhole was observed in the case without sonication. Deep and narrow keyhole geometries are susceptible to keyhole tip collapse porosity32; therefore, by changing the keyhole morphology, ultrasonic treatment could potentially eliminate one of the major porosity formation mechanisms in laser AM. It is important, however, to note that sonication-induced cavitation resulted in porosity, as revealed by post-process EBSD and X-ray computed tomography scan results Therefore, these observations spark interest in further investigations on ultrasonic wave parameter optimization to leverage cavitation for porosity reduction and location-specific microstructural refinement. Furthermore, cavitation-induced porosity in AM ultrasonic melt processing could be used to manufacture porous structures for biomedical applications. Frequency modulation and the use of multiple ultrasound sources could potentially provide a certain degree of control over cavitation in laser-generated metal pools.
The application of ultrasonic vibration in laser-based AM was considered to increase the laser beam reflection from the liquid/gas interface in the melt pool because of increased keyhole depth caused by the raised keyhole rim. Increased laser beam reflection can potentially improve laser energy absorptivity61, resulting in larger melt volumes. On the other hand, applying ultrasonic treatment through out-of-plane vibration increased hot spattering due to the molten metal droplets pinching off the melt pool at peak positive and negative vibration amplitudes. Further optimizing vibration frequency, amplitudes, and direction can help mitigate hot spattering.
To investigate the influence of ultrasonic treatment on solidification and microstructural development, we utilized Flow-3DⓇ multiphysics simulations validated with real-time high-speed synchrotron X-ray images of melt pool dynamics. Flow-3DⓇ simulation results showed pressure variation-driven acoustic cavitation in melt pools with applied ultrasonic treatment. The pressure variation in melt pools with and without applied ultrasound was analyzed during the solidification phase (i.e., after the laser was switched off) using color maps. Ultrasonic treatment was also observed to promote high melt pool velocities, cooling rates, and thermal gradients. Higher thermal gradients and melt pool velocities create stronger cooling effects and promote heterogeneous nucleation and grain refinement.
In summary, we provided evidence of acoustic cavitation in laser-generated molten metal pools on sonicated substrates using both high-speed X-ray imaging and CFD simulations. We further showed that ultrasonic treatment influenced melt pool and keyhole dynamics and could potentially eliminate some major keyhole porosity driving mechanisms. We also demonstrated through simulations that ultrasonic treatment creates favorable conditions for heterogeneous nucleation and grain refinement. These results facilitate further investigation into the influence of ultrasonic treatment on microstructural refinement and mechanical property improvement in laser-based AM processes.
Methods
Materials and sample preparation
Al6061 alloy was chosen as the material of interest because of its widespread usage in lightweight material industries such as automotive, aerospace, and many others. Unfortunately, Al6061 is extremely challenging to use in welding or AM because of thermal cracking. Thus, this research has a broader goal of investigating techniques to improve the printability of such alloys. Moreover, manufacturing methods, processes, and conditions highly influence Al6061 grain sizes and mechanical properties, as demonstrated by Eskin44 in the ultrasonic treatment of light metallic alloys. Secondly, applications of Al6061 as an additive manufacturing material have been limited because of residual stress build-up62. Lastly, Al6061 has liquidus and solidus temperatures of 660 °C and 595 °C, respectively, enabling sizable mushy zones necessary for effective and efficient ultrasonic treatment. Al6061 samples with a length of 20 mm, a height of 12 mm, and a thickness of 1.5 mm were used in our experiments. A thickness of 1.5 mm allowed adequate X-ray absorption contrast between the solid, liquid, and gaseous phases during laser melting, making it easy to identify melt pool features (i.e., vapor/gas depression, bubbles, solid-liquid interfaces.).
Ultrasonic wave generation system
Al6061 specimens were adhered to an ultrasonic transducer horn using an adhesive, as illustrated in Supplementary Fig. 1. A 20.2 kHz high-power ultrasonic transducer by Hangzhou Altrasonic Technology Co., Ltd., with a maximum power of 2000 W, was used in this study. The ultrasonic system consisted of a horn, piezoelectric elements, and an ultrasonic generator. The ultrasonic generator converts the power source into high-frequency and high-voltage alternating current and transmits it to the piezoelectric elements, which convert the input electrical energy into mechanical energy (i.e., ultrasonic waves). In our experiments, the transducer generated a continuous longitudinal wave and was operated at the horn’s resonant frequency of 20.2 kHz, with a power of 600 W and vibration amplitude of 8 μm. The transducer power and short time intervals of ultrasonic wave application were chosen to prevent the transducer horn overheating, which may influence melt pool solidification rates and thermal gradients. A custom-designed relay apparatus operated from outside the experimental hutch controlled the transducer on/off switching and the duration of ultrasonic vibration.
X-ray imaging and laser melting system
Experiments were conducted using the high-energy ultrafast synchrotron X-ray imaging system available at the Advanced Photon Source, Argonne National Laboratory, USA. The 32-ID-B beamline at the Advanced Photon Source offers a state-of-the-art high-speed X-ray imaging technique. The intense undulator white beam allows ultrafast image acquisition rates of 50 kHz with a spatial resolution of 2 μm/pixel in a field of view of 1.8 × 1 mm. In addition, a continuous-wave ytterbium fiber laser (IPG YLR-500-AC, IPG Photonics, Oxford, USA, wavelength of 1070 nm, maximum output power of 560 W) and a galvanometer scanner (IntelliSCANde 30, SCANLAB GmbH., Germany)38 were integrated to perform stationary laser melting on bare Al6061 samples. A laser power of 350 W was used in the experiments. Experiments were conducted in the following sequence: the X-ray shutter and camera were first opened to initiate image acquisition. Secondly, the ultrasonic transducer was switched on, and lastly, the laser was turned on. The experimental setup and sequence allowed the sample melting, vapor depression development, and melt pool solidification occurring in an acoustic field to be captured via X-ray imaging. The laser was switched on for 3.34 ms for both cases with and without ultrasonic treatment.
EBSD and X-ray computed tomography analysis
Electron backscattered diffraction patterns (EBSPs) were obtained in the Oxford scanning electron microscope (SEM) instrument by focusing an electron beam on the Al6061 sample. The final polishing of the Al6061 sample was conducted using the Final A polishing pad with 0.04-micron colloidal silica suspension for 12 h. The sample was tilted to approximately 70 degrees with respect to the horizontal, and the diffraction patterns were imaged on a phosphor screen. The images were captured using a low-light CMOS camera. A 1.5-micron step size was used for both samples with and without ultrasonic treatment. The X-ray computed tomography scan was conducted with a Zeiss Xradia Versa 620 CT system using a source accelerating voltage of 80 kV. Images were acquired over 2 h at a voxel size of 1.5 μm and reconstructed using Zeiss proprietary software. The dicom image files were then processed using MATLAB to reveal the influence of ultrasonic vibration on the final solidification structure of the melt pools. A 3D view of sonication-induced pores showing the influence of ultrasonic vibration amplitude on the melt pool solidification was captured using the 3D volume viewer tool in MATLAB.
Image processing
MATLAB image processing toolkit and ImageJ were utilized in the X-ray image analysis. MATLAB codes were developed to normalize a sequence of X-ray images with their average pixel values. To create an X-ray image sequence with a uniform gray value, images within a 5% range of gray values were grouped together. A normalization operation was applied to each distinct group, which allowed enhanced visualization of melt pool features, keyhole dynamics, and bubble motion. Measurements of the melt pool and keyhole depth changes and bubble motion characterization were conducted using ImageJ. Maximum depths and widths on each X-ray frame measured in ImageJ were used to characterize melt pool and keyhole dynamics. The peak-to-peak vibration amplitude on the Al6061 sample surface was also measured as 16 μm using ImageJ.
A 1 mm2 domain with a 4-μm mesh size was used in the CFD simulations on the Flow-3DⓇ platform. The simulation finish time was set at 1.3 ms, and the laser on time was set at 0.8 ms. Similar to our experiments, the laser power used in the simulations was 350 W, with a laser spot size of 80-μm. Ultrasonic vibration was introduced by defining a non-inertial reference frame with harmonic oscillations on the melt volume (i.e., substrate). The oscillation frequency was set at 20.2 kHz and an amplitude of 8-μm. The execution time for each simulation with and without ultrasonic treatment was one day and 16 h, with each model generating a 2.5 TB output data file (More details on the simulation setup, boundary conditions, and governing equations are provided in Supplementary Material Section 2).
References
Zhang, C. et al. Additive manufacturing of functionally graded materials: a review. Mat. Sci. Eng. A-Struct.764, 138209 (2019).
Dehoff, R. R. et al. Site specific control of crystallographic grain orientation through electron beam additive manufacturing. Mater. Sci. Tech.31, 931–938 (2015).
Lewandowski, J. J. & Seifi, M. Metal additive manufacturing: a review of mechanical properties. Annu. Rev. Mater. Res.46, 151–186 (2016).
Arísoy, Y. M., Criales, L. E. & Özel, T. Modeling and simulation of thermal field and solidification in laser powder bed fusion of nickel alloy IN625. Opt. Laser Technol.109, 278–292 (2019).
Sames, W. J., List, F. A., Pannala, S., Dehoff, R. R. & Babu, S. S. The metallurgy and processing science of metal additive manufacturing. Int. Mater. Rev.61, 315–360 (2016).
Mohammadpour, P. & Phillion, A. B. Solidification microstructure selection maps for laser powder bed fusion of multicomponent alloys. IOP Conf. Ser.: Mater. Sci. Eng. 861, 012005 (2020).
Okugawa, M., Furushiro, Y. & Koizumi, Y. Effect of rapid heating and cooling conditions on microstructure formation in powder bed fusion of al-si hypoeutectic alloy: a phase-field study. Mater. 12, 17 (2022).
Martin, J. H. et al. 3D printing of high-strength aluminium alloys. Nature 549, 365–369 (2017).
Spierings, A. B., Dawson, K., Voegtlin, M., Palm, F. & Uggowitzer, P. J. Microstructure and mechanical properties of as-processed scandium-modified aluminium using selective laser melting. CIRP Annals 65, 213–216 (2016).
Xu, J., Li, R. & Li, Q. Effect of agglomeration on nucleation potency of inoculant particles in the al-nb-b master alloy: modeling and experiments. Metall. Mater. Trans. A 52, 1077–1094 (2021).
Y, W., Zhang, L., Yang, W., Ji, S. & Ren, Y. Effect of mold electromagnetic stirring and final electromagnetic stirring on the solidification structure and macrosegregation in bloom continuous casting. Steel Res. Int. 92, 1–8 (2021).
Colegrove, P. A. et al. Application of bulk deformation methods for microstructural and material property improvement and residual stress and distortion control in additively manufactured components. Scripta Mater. 135, 111–118 (2017).
Eskin, G. Influence of cavitation treatment of melts on the processes of nucleation and growth of crystals during solidification of ingots and castings from light alloys. Ultrason. Sonochem. 1, S59–S63 (1994).
Wang, X. et al. Experimental investigation of heat transport and solidification during low frequency electromagnetic hot-top casting of 6063 aluminum alloy. Mat. Sci. Eng. A-Struct. 497, 416–420 (2008).
Kisasoz, A., Guler, K. & Karaaslan, A. Influence of orbital shaking on microstructure and mechanical properties of A380 aluminium alloy produced by lost foam casting. Russ. J. Non-ferrous Metals 58, 238–243 (2017).
Krajewski, A., Wlosinski, W., Chmielewski, T. & Kolodziejczak, P. Ultrasonic-vibration assisted arc-welding of aluminum alloys. B. Pol. Acad. Sci-Tech. 60, 841–852 (2012).
Yang, M., Wang, L. & Yan, W. Phase-field modeling of grain evolutions in additive manufacturing from nucleation, growth, to coarsening. npj Comput. Mater. 7, 56 (2021).
Eskin, G. I. Broad prospects for commercial application of the ultrasonic (cavitation) melt treatment of light alloys. Ultrason. Sonochem 8, 319–325 (2001).
Abramov, O. V. Action of high-intensity ultrasound on solidifying metal. Ultrasonics. 25, 987 (1986).
Sui, C., Liu, Z., Ai, X., Liu, C. & Zou, Z. Effect of ultrasonic vibration on grain size and precipitated phase distribution of 6061 aluminum alloy welded joint. Crystals 12, 841–852 (2022).
Todaro, C. et al. Grain structure control during metal 3D printing by high-intensity ultrasound. Nat. Commun. 11, 142 (2020).
Todaro, C. et al. Grain refinement of stainless steel in ultrasound-assisted additive manufacturing. Addit. Manuf. 37, 101632 (2021).
Feilong, J. et al. Improving microstructure and mechanical properties of thin-wall part fabricated by wire arc additive manufacturing assisted with high-intensity ultrasound. J. Mater. Sci. 58, 012005 (2023).
Ivanov, I. A. et al. Effect of laser-induced ultrasound treatment on material structure in laser surface treatment for selective laser melting applications. Sci. Rep. 11, 1–12 (2021).
Yoon, H. et al. Pulsed laser-assisted additive manufacturing of Ti-6Al-4V for in-situ grain refinement. Sci. Rep. 12, 22247 (2022).
Wang, H., Hu, Y., Ning, F. & Cong, W. Ultrasonic vibration-assisted laser engineered net shaping of Inconel 718 parts: Effects of ultrasonic frequency on microstructural and mechanical properties. J. Mater. Process Tech. 276, 116395 (2020).
Leung, C. L. A. et al. In situ X-ray imaging of defect and molten pool dynamics in laser additive manufacturing. Nat. Commun. 9, 1355 (2018).
Eskin, D. G. et al. Fundamental studies of ultrasonic melt processing. Ultrason. Sonochem. 52, 455–467 (2019).
Wang, B. et al. Ultrafast synchrotron X-ray imaging studies of microstructure fragmentation in solidification under ultrasound. Acta Mater. 144, 505–515 (2018).
Wang, G., Dargusch, M. S., Eskin, D. G. & StJohn, D. H. Identifying the stages during ultrasonic processing that reduce the grain size of aluminum with added Al3Ti1B master alloy. Adv. Eng. Mater. 19, 8 (2017).
Ji, F. et al. Grain refinement and mechanism of steel in ultrasound-assisted wire and arc additive manufacturing. Int. Commun. Heat Mass 143, 106724 (2023).
Zhao, C. et al. Critical instability at moving keyhole tip generates porosity in laser melting. Science 370, 1080–1086 (2020).
Zhang, W., Xu, C., Li, W. & Yang, B. The strengthening effect of high-energy ultrasound treatment on the additively manufactured ZL114A aluminum alloy. Mater. Today Commun. 37, 107254 (2023).
Cunningham, R. et al. Keyhole threshold and morphology in laser melting revealed by ultrahigh-speed X-ray imaging. Science 363, 849–852 (2019).
Gan, Z. et al. Universal scaling laws of keyhole stability and porosity in 3D printing of metals. Nat. Commun. 12, 2379 (2021).
Balasubramani, N., StJohn, D., Dargusch, M. & Wang, G. Ultrasonic processing for structure refinement: An overview of mechanisms and application of the interdependence theory. Mater. 12, 3187 (2019).
Yang, Z. et al. Manipulating molten pool dynamics during metal 3D printing by ultrasound. Appl. Phys. Rev. 9, 2 (2020).
Hojjatzadeh, S. et al. Pore elimination mechanisms during 3D printing of metals. Nat. Commun. 10, 3088 (2019).
Eskin, D. G & Tzanakis, I. High-Frequency Vibration and Ultrasonic Processing. (Springer International Publishing: Cham, 2018).
Supponen, O. et al. The effect of size range on ultrasound-induced translations in microbubble populations. J. Acoust. Soc. Am 147, 3236 (2020).
Guo, Q. et al. In-situ characterization and quantification of melt pool variation under constant input energy density in laser powder bed fusion additive manufacturing process. Addit. Manufact. 28, 600–609 (2019).
Huang, Y. et al. Keyhole fluctuation and pore formation mechanisms during laser powder bed fusion additive manufacturing. Nat. Commun. 13, 1170 (2022).
Khairallah, S. A., Anderson, A. T., Rubenchik, A. & King, W. E. Laser powder-bed fusion additive manufacturing: Physics of complex melt flow and formation mechanisms of pores, spatter, and denudation zones. Acta Mater. 108, 36–45 (2016).
Eskin, G. et al. Ultrasonic Treatment of Light Alloy Melts. 1st edn, (CRC Press, 1998).
Tzanakis, I. & Eskin, D. Ultrasonic Cavitation Treatment of Metallic Alloys (Mater, 2020).
Tzanakis, I., Lebon, G., Eskin, D. & Pericleous, K. Characterizing the cavitation development and acoustic spectrum in various liquids. Ultrason. Sonochem. 34, 651–662 (2017).
Xu, N., Yu, Y., Zhai, W., Wang, J. & Wei, B. A high-temperature acoustic field measurement and analysis system for determining cavitation intensity in ultrasonically solidified metallic alloys. Ultrason. Sonochem. 94, 106343 (2023).
Tzanakis, I. et al. In situ synchrotron radiography and spectrum analysis of transient cavitation bubbles in molten aluminium alloy. Phys. Procedia 70, 841–845 (2015).
Atchley, A. & Prosperetti, A. The crevice model of bubble nucleation. J. Acoust. Soc. Am. 86, 1065–1084 (1989).
Yuan, D. et al. Improvement of the grain structure and mechanical properties of austenitic stainless steel fabricated by laser and wire additive manufacturing assisted with ultrasonic vibration. Mat. Sci. Eng A-Struct. 813, 141177 (2021).
Xu, M. et al. Effect of grain refinement on strain hardening behavior of nickel-based superalloy fabricated by wire arc additive manufacturing. Mater. Lett. 324, 132723 (2022).
Ning, F. et al. Ultrasonic vibration-assisted laser engineered net shaping of inconel 718 parts: microstructural and mechanical characterization. ASME. J. Manuf. Sci. Eng. 140, 061012 (2018).
Wang, J., Zhu, R., Liu, Y. & Zhang, L. Understanding melt pool characteristics in laser powder bed fusion: An overview of single- and multi-track melt pools for process optimization. Adv. Powder Mater. 2, 100137 (2023).
Lebon, G. B., Tzanakis, I., Djambazov, G., Pericleous, K. & Eskin, D. Numerical modeling of ultrasonic waves in a bubbly newtonian liquid using a high-order acoustic cavitation model. Ultrason. Sonochem. 37, 660–668 (2017).
Priyadarshi, A. et al. On the governing fragmentation mechanism of primary intermetallics by induced cavitation. Ultrason. Sonochem. 70, 105260 (2021).
Mi, J., Tan, D. & Lee, T. L. In situ synchrotron X-ray study of ultrasound cavitation and its effect on solidification microstructures. Metall. Mater. Trans. B 46, 1615– 1619 (2015).
Wang, Z. et al. Effects of ultrasonic vibration on microstructure and mechanical properties of 1Cr12Ni3MoVN alloy fabricated by directed energy deposition. Ultrasonics 132, 106989 (2023).
Allen, T. R. et al. Energy-coupling mechanisms revealed through simultaneous keyhole depth and absorptance measurements during laser-metal processing. Phys. Rev. Appl. 13, 064070 (2020).
Tan, D. et al. High-speed synchrotron X-ray imaging studies of the ultrasound shockwave and enhanced flow during metal solidification processes. Metall. Mater. Trans. A 46, 2851–2861 (2015).
Chen, Y. et al. Grain refinement and mechanical properties improvement of Inconel 625 alloy fabricated by ultrasonic-assisted wire and arc additive manufacturing. J Alloy Compd. 910, 164957 (2022).
Simonelli, M. et al. A study on the laser spatter and the oxidation reactions during selective laser melting of 316L stainless steel, Al-Si10-Mg, and Ti-6Al-4V. Metall. Mater. Trans. A. 46, 3842–3851 (2015).
Mehta, A. et al. Additive manufacturing and mechanical properties of the dense and crack free Zr-modified aluminum alloy 6061 fabricated by the laser-powder bed fusion. Addit. Manuf. 41, 101966 (2021).
Md Tusher Mollah, Raphaël Comminal, Wilson Ricardo Leal da Silva, Berin Šeta, Jon Spangenberg
Abstract
A challenge for 3D Concrete Printing is to incorporate reinforcement bars without compromising the concrete-rebar bonding. In this paper, a Computational Fluid Dynamics (CFD) model is used to analyze the deposition of concrete around pre-installed rebars. The concrete is modelled with a yield-stress dependent elasto-viscoplastic constitutive model. The simulated cross-sections of the deposited layers are compared with experiments under different configurations and rebar sizes, and found capable of capturing the air void formation with high accuracy. This proves model robustness and provides a tool for running digital experiments prior to full-scale tests. Additionally, the model is employed to conduct a parametric study under three different rebar-configurations: i) no-rebar; ii) horizontal rebar; and iii) cross-shaped (horizontal and vertical) rebars. The results illustrate that air voids can be eliminated in all investigated cases by changing the toolpath, process parameters, and rebar joint geometry, which emphasizes the great potential of the digital model.
Keywords
3D Concrete Printing (3DCP); Reinforcement bars (rebars); Computational Fluid Dynamics (CFD); Multilayer deposition; Air voids
1. Introduction
3D Concrete Printing (3DCP) [1] is an extrusion-based automated construction process that belongs to Digital Fabrication with Concrete (DFC) [2,3]. The 3DCP offers high-quality built-structures with customizable structural design in a cost- and time-efficient manner [[4], [5], [6], [7]]. Structures in 3DCP are fabricated in a layer-by-layer approach, where a concrete extrusion nozzle is controlled by a robotic arm, cylindrical robot, gantry system, or delta system [[8], [9], [10], [11]]. Despite the enormous potential of 3DCP, one of its crucial limitations is the integration of reinforcement for the production of load-bearing structures. Most structural applications require the use of reinforcement to withstand tensile forces and introduce structural ductility [[12], [13], [14], [15]]. However, the introduction of reinforcement with 3DCP has never been an easy task, and difficulties were recognized at early stages of the technology [4] and various design solutions have been tested in practice to either circumvent the need for reinforcement or integrate reinforcement after the concrete is printed [[16], [17], [18], [19], [20]]. As a result, several reinforcement techniques have been proposed, such as bar reinforcement [21], micro-cable reinforcement [22,23], fiber reinforcement into the cementitious material [[24], [25], [26]], steel reinforcement using robotic arc welding [27,28], and in-process mesh reinforcement [29]. For comprehensive details on the reinforcement strategies, refer to [30]. Nevertheless, these reinforcement strategies are still rudimentary in many instances. This study focuses on bar reinforcement methods, where rebars are integrated with freshly deposited cementitious material. A few approaches can be found in the literature, for example, penetration of vertical bars through multiple printed layers [31,32], placement of horizontal bars into a printed layer along the printing direction and then covered by the next layer on top [33,34], and depositing around pre-installed bi-directional rebars [35]. However, in most approaches, the bonding between the rebar and concrete was compromised by the air void around the rebar [21,36]. To overcome this constraint, a large amount of trial and error is required, which is costly and time-consuming. An approach to mitigate extensive experimental campaigns is to apply numerical models. In the context of 3D printing technologies, like Fused Filament Fabrication (FFF), Robocasting, and 3DCP, CFD modelling has been found to be very beneficial [[37], [38], [39], [40], [41], [42], [43], [44]]. The morphology of the deposited strands in FFF was studied by Comminal et al. [45]. Furthermore, Serdeczny et al. [46] addressed how to reduce the porosities and enhance the bonding between subsequent layers. Mollah et al. [[47], [48], [49]] studied ways to minimize the deformation and thereby stabilize layers printed by Robocasting, while for 3DCP, the geometrical shapes of the single- and multiple-deposited layers have been investigated in detail in [[50], [51], [52]]. This paper uses the CFD model and extends the preliminary results recently published in [53]. The model uses elasto-viscoplastic constitutive equations to approximate the rheology of the concrete. The CFD model is validated by comparison with a number of experiments, and the model is subsequently exploited to make an in-depth analysis of air void formation between rebars and concrete using the cross-sections of the deposited part and the calculated volume fraction of air voids. Different material properties, such as yield stress and plastic viscosity, and processing parameters, like the rebar diameter, nozzle-rebar distance, a geometric ratio (i.e., the distance from nozzle to the substrate divided by the nozzle diameter), as well as a speed ratio (i.e., the printing speed divided by the extrusion speed) are varied. Section 2 describes the methodology of the study, along with the experimental and numerical details. Next, Section 3 presents and discusses the results. Finally, Section 4 summarizes the results with the conclusion.
2. Methodology
2.1. Materials’ properties and 3DCP experiments
A fresh cement-based mortar was used to perform the 3DCP experiment around the rebars. The mortar includes a binder system with white cement CEM I 52.5 R-SR 5 (EA), limestone filler with sand of maximum particle size 0.5 mm, admixtures, and water. The binder was prepared with a 75 L Eirich Intensive Mixer Type Ro8W. The water to cement ratio was 0.39. The admixtures dosage (by weight of cement) was set at 0.1 % high-range water-reducing agent, 0.1 % viscosity-modifying agent, and 0.5 % hydration retarder.
The rheological characterization of the mortar was done using an Anton Paar rheometer MCR 502, as used in [50,54]. The rotational and oscillatory tests were performed with a vane-in-cup measuring device. The obtained flow curve of the mortar from the rotational rheometric tests, with a ramp-down controlled shear rate (CSR), was fitted by a linear regression to determine the yield stress τ0= 630 Pa and plastic viscosity ηP= 7.5 Pa·s. The oscillatory test showed that the constitutive behavior of the unyielded mortar had a factorized relationship between the storage modulus G′ and loss modulus G′′ within the linear viscoelastic (LVE) region, where G′= 200 kPa was captured. Therefore, the mortar’s rheology was modelled as a yield stress limited elasto-viscoplastic material, where the storage modulus is used as the linear elastic shear modulus of the unyielded mortar. Furthermore, the rheological characterization showed that the mortar exhibited time-independent rheological characteristics within the actual printing process, see [50] for more details.
The setup for 3DCP experiments around ribbed rebars is presented in Fig. 1. It comprised a 6-axis industrial robot (Fanuc R-2000iC/165F) with a custom-designed nozzle ∅20 mm (i.e., nozzle diameter, Dn= 20 mm) made by fused filament fabrication of ABS thermoplastic, cf. Fig. 1-a. The robot also included a progressive cavity pump (NETZSCH) equipped with a hopper and a long steel-wire rubber hose (cf. Refs. [50, 52] for details). A 25 mm thick plywood plate was used as the built substrate as seen in Fig. 1-b. The 1000 mm long rebars of diameter Dr= 8 and 12 mm were placed horizontally on top of the substrate at a distance Hr= 14 mm. The horizontal rebars were held in place by two vertical rebars with a height of 37 mm. The setup was used to print a structure of four successive layers of parallel strands around the rebars. Details on the printing toolpath around the rebars are illustrated in the subsections below.
Fig. 1. 3DCP experiment around rebars: (a) 6-axis robotic arm [50]; (b) plywood built platform with integrated rebars; (c) example of printing (picture is taken during printing of the third layer).
The extrusion nozzle was placed above the substrate with a nozzle height Dn/2 for the first layer, whereas for subsequent number of layers (Nl), the nozzle height was set at Nl∗Dn/2. Thus, the nominal height of a layer was h=Dn/2. The print was done with a material extrusion rate 0.91 dm3/min and nozzle speed 35 mm/s. An example of a physical print is presented in Fig. 1-c. After the prints hardened, cross-sections were collected to investigate the rebar-concrete bonding. The cross-section slices were taken at specific positions to analyze the print around the horizontal rebar and cross-shaped rebar (i.e., horizontal and vertical rebars). To avoid destroying the specimens while cutting them, the printed part were impregnated with epoxy resin in a vacuum chamber.
2.2. Computational models and governing equations
Three different CFD models are built. The first model only simulated the mortar flow to understand the void formation pattern without rebars. The last two models simulated the 3DCP experiment around rebars: one model simulated the mortar flow around the horizontal rebar, while the other considered the cross-shaped rebar. This subdivision enabled the CFD models to consider a smaller computational domain than if the two scenarios were combined.
The CFD models comprised a cylindrical nozzle, a solid-substrate, and an artificial solid component (at the top) within the computational domain of size 8.5D×6D×2D+4h as shown in Fig. 2 (top), where Model 1 excluded rebars (left), Model 2 included the horizontal rebar (middle), and Model 3 considered the cross-shaped rebar (right). The printing toolpath of the models are illustrated in Fig. 2. The toolpath for Models 1 and 2 are presented in 3D (left bottom figure), where the only difference was the presence of the horizontal rebar. The toolpath in 2D presented at the bottom right is for Model 3. For all the models, the toolpath of the extrusion nozzle kept a distance of Dnr from the axis of the nearest rebar. The lengths of the horizontal and vertical rebars were 50 and 40 mm, respectively. The other printing parameters were similar to the ones used in the experiment, cf. Section 2.1. Finally, the models were used to simulate four successive layers with a length of 125 mm. Note that the rebars are modelled as cylindrical solid objects (i.e., smooth rebar).
Fig. 2. Model geometry with the extrusion nozzle, substrate, integrated rebars, and computational domain (top) and toolpath (bottom).
The computational domain was meshed by a uniform Cartesian grid. A mesh sensitivity test was performed for different meshes with cell sizes 0.9, 1.0, and 1.1 μm. Even if the change in absolute size of the cells were small, the total number of cells within the domain was 1.1, 1.5, and 2.0 million, respectively. A cell size of 1.0 μm was chosen as that was found to be time-efficient and had a negligible effect on the accuracy of the results. The top plane of the domain was an inlet boundary, where the artificial solid component was defined in order to prevent material flow outside the nozzle orifice, cf. Fig. 2 (top). On the bottom plane, a wall boundary was applied to represent the solid substrate. The other planes were assigned continuative boundary conditions, but had no influence on the results. Furthermore, no-slip boundary conditions were applied between fluids and solids.
Table 1 lists the printing parameters and their values for each of the investigated cases. All the models and cases are simulated for 4 successive layers.
Table 1. Description of case IDs with printing parameters and accompanying values. The reference values (corresponding to the experimental print) are written in bold, while the parameter change for each case is highlighted by underlining the value.
Empty Cell
Model/case ID
Parameters
Model 1 (no rebar), Model 2 (horizontal rebar), and Model 3 (cross-shaped rebar)
Case 1 (reference)
Case 2
Case 3
Case 4
Case 5
Case 6
Case 7
Case 8
Case 9
Nozzle diameter Dn (mm)
20
20
20
20
20
20
20
20
20
Rebar diameter Dr (mm)
8
6
12
8
8
8
8
8
8
Nozzle-rebar distance Dnr (mm)
20
20
20
19
18
20
20
20
20
Layer height h (mm)
10
10
10
10
10
9
8
10
10
Geometric ratio Gr=h/Dn
0.5
0.5
0.5
0.5
0.5
0.45
0.4
0.5
0.5
Printing speed V (mm/s)
35
35
35
35
35
35
35
35
35
Extrusion speed U (mm/s)
48.42
48.42
48.42
48.42
48.42
48.42
48.42
51.47
53.84
Speed ratio Sr=V/U
0.72
0.72
0.72
0.72
0.72
0.72
0.72
0.68
0.65
The cementitious mortar flow was assumed transient and isothermal. Thus, the flow dynamics of the mortar are governed by the mass and momentum conservation equations of incompressible fluid:
where u is the velocity vector, ρ is the density, g=00−g is the gravitational acceleration vector, t is the time, p is the pressure, and σ is the deviatoric stress tensor.
The rheological behavior of the mortar was modelled by the following elasto-viscoplastic constitutive equation that represents σ as the sum of the deviatoric part of the viscous stress σV and elastic stress σE tensors; i.e.:
The deviatoric viscous stress tensor was predicted as:
is the deformation rate tensor, and T represents the transpose notation.
The deviatoric elastic stress tensor was modelled by the Hookean assumption of a small strain rate tensor E between each small time steps Δt=t−t0, to represent the elastic response of unyielded materials
Ewhere G is the shear modulus and Et=Et0+ΔtDT is the incremental strain rate tensor approximated by integrating the deformation rate tensor over Δt.
The incremental representation of Eq. (5) can be written as:
is the vorticity tensor. The first term of the left-hand side of Eq. (6) represents the change in stress at a fixed location in space. The change in stress due to advection and rotation of material particle is approximated by the second and third terms, respectively. The right-hand side takes into account the change in stress due to shearing.
The elastic stress tensor of the yielded material was approximated by imposing the yield stress τ0 limit as follows:
where σvM is the von Mises stress predicted as:
where IIσE∗=trσE∗2 is the second invariant of σE∗. The material was yielded when σvM exceeded the yield stress. The properties of the material used in the different models and cases are presented in Table 2. Note that the CFD model does not include the solidifications of the printed layers.
Table 2. Material properties.
Parameter with symbol
Unit
Value
Value for reference simulation
Density, ρ
kg·m−3
2112
2112
Shear modulus, G
kPa
20–100
20
Dynamic yield stress, τ0
Pa
400–800
630
Plastic viscosity, ηP
Pa·s
3.5–10
7.5
2.3. Numerical method
The computational model was developed in the commercial CFD tool FLOW-3D® (V12.0; Flow Science Inc.) [55]. It uses the FAVOR technique (Fractional Area/Volume Obstacle Representation) to embed solid objects (i.e., the nozzle, rebars, substrate, etc.) in the computational domain. The computational domain was meshed with a Cartesian grid and discretized with the Finite Volume Method. The governing equations of the mortar flow were solved by the implicit pressure-velocity solver GMRES (Generalized Minimum Residual) [[56], [57], [58]]. The predictions of pressure and forces near solid objects were modelled by the immersed boundary method [59]. The yield stress limited elasto-viscoplastic criterion was built in the software, and the elastic stress was calculated explicitly. An implicit technique, successive under-relaxation, was used to solve the viscous stress of the momentum equation (Eq. (2)). The free surface of the mortar was captured by the Volume-of-Fluid technique, see details in Ref. [60, 61]. The momentum advection was calculated explicitly by an upwind-difference technique and ensured first-order accuracy. The time step size was controlled dynamically with a stability limit in order to avoid numerical instabilities [55]. All the simulations were run with 20 cores on a high-performance computing cluster. The study was carried out with a first-order accuracy in both space and time in order to reduce the computational time, which was extensive due to the elasto-viscoplastic material model that computes both viscous and elastic stresses (e.g., the computational time was six days for model 1 case 1). In this regard, one should note that the model can simulate a multitude of scenarios simultaneous.
2.4. Results post-processing
The simulated results were processed in two steps. The first step was to show the cross-sectional shapes which were done in the post-processing tool FLOW-3D®POST, and the second step was to calculate the volume fraction of air voids inside the printed structure. The cross-sectional shapes were used to investigate the interior of the structure and the rebar-concrete bonding. The cross-sectional shapes were obtained in the plane parallel to the yz-plane at the middle of the layer’s length, as shown in Fig. 3-d. Fig. 3-c sketches the nominal positions of the air void creation in a four-layered structure. The positions of the air voids were defined as outer-bottom, bottom, mid, top, and outer-top in this study. The presence of the air void was quantified by calculating the volume fraction of air voids around the middle of the layer’s length. The calculation enabled to capture the presence of air voids for Model 3, i.e., around the vertical rebar, as seen in the dashed-box of Fig. 3-b.
Fig. 3. Post-processing of results; (a) introduction of volume sampling cuboid to calculate the volume fraction of air voids; (b) presence of air voids around the vertical rebar in the experiment; (c) schematic of air void creation; (d) cross-sectional shapes and void sampling area for the different models.
In order to calculate the volume fraction of air voids, a cuboid of size 20×25×3h mm3 was introduced to the CFD models as a volume sampling object, as seen in Fig. 3-a. Note that the size and position of the object were the same for all the models. The volume sampling was a three dimensional data collection tool built in the software that enabled calculating the amount of material as well as air void inside of it. Finally, the volume fraction of air voids VV was calculated as below:
3. Results and discussions
his section compares the simulated and experimental results of 3DCP around the rebars. Furthermore, it discusses the influence of different parameters on the air void formation in the cross-sectional shapes of printed parts and the volume fraction of air voids inside the structure. The parametric study includes the material properties (i.e., yield stress and plastic viscosity) and the printing properties (i.e., rebar diameter, rebar-nozzle distance, geometric ratio, and speed ratio).
3.1. Experiments and validation of the CFD model
The CFD models (Models 2 and 3) are compared and validated with the experiments. The results are presented in Fig. 4. Two rebar diameters, i.e., Dr= 8 and 12 mm, are taken into account, where the nozzle-rebar distances are 20 and 24 mm, respectively. The other printing and material parameters are kept constant in the experiments with different rebar diameters, see Table 1 (cases 1 and 3). In the case of the simulations, all parametric details are the same as implemented in the experiments except for the elastic shear modulus. The choice of shear modulus is subject to the analysis presented in Appendix A. The shear modulus is reduced to 100 kPa from the measured value (i.e., 200 kPa) to compare the simulated results with experiments. Furthermore, a shear modulus of 20 kPa is chosen for the parametric study in the later sections. These assumptions seem reasonable to avoid extensive computational time consumption since the differences found in void formation are limited (see Fig. A.1).
Fig. 4. 3DCP experiments (left column), simulations (middle column), and comparison (right column). (a) Horizontal rebar with Dr= 8 mm and Dnr= 20 mm; (b) horizontal rebar with Dr= 12 mm and Dnr= 24 mm; (c) cross-shaped rebar with Dr= 8 mm and Dnr= 20 mm; and (d) cross-shaped rebar with Dr= 12 mm and Dnr= 24 mm. The blue part in the experiments is epoxy resin. (For interpretation of the references to color in this figure legend, the reader is referred to the web version of this article.)
The cross-sectional shapes of the 3DCP experiments around the horizontal rebar of 8 mm in Fig. 4-a illustrate the presence of a top air void as well as mid and bottom air voids positioned respectively above and below the horizontal rebar. The mid and bottom air voids are found to be smaller than the top one. This is due to the presence of the rebar that occupies the mortar’s flowable space as well as the deformation of the previously printed layers. For a detailed analysis of the deformation pattern, refer to [53]. The air voids at the top and bottom are significant when the rebar diameter is increased to 12 mm (Fig. 4-b). This is due to the fact that the nozzle-rebar distance was increased, which enhances the flowable space between the strands. In addition, the larger size of the rebar creates larger channels below and above itself, where the mortar of the second and third layers is forced to be squeezed into. The mid-air void is found to be absent as its area is fully occupied by the larger rebar. In the case of the cross-shaped rebars, the existence of the vertical rebar seems to restrict the merging of parallel strands, and therefore, the presence of air void content increases, cf. Fig. 4-c, d. This limitation is found to be pronounced for the larger rebar diameter with the larger nozzle-rebar distance. The cross-sectional shapes of the simulations (middle column in Fig. 4) illustrate high accuracy predictions of the position and size of the air voids when compared with the experiments. Particularly, the models capture small details around the vertical rebar for both diameters. This can clearly be seen in the comparison of experiments and simulation, cf. right column in Fig. 4. A discrepancy is found in the strand’s width of the bottom layer as well as the shape of the printed part, specifically in the shape of strands of all the layers next to the vertical rebar and the height of the part for the smaller rebar diameter. These could be due to a combined effect of the idealized rheological model, as well as slight differences in the processing parameters, e.g. nozzle height above the printing surface, nozzle-rebar distance, as well as printing- and extrusion-speed. Note that the height of the vertical rebar in the experiments is a bit shorter than the one in the simulations (40 mm), although it does not influence the results.
3.2. Influence of materials properties
The influence of the material properties, yield stress and plastic viscosity, on the air void formation is presented in Fig. 5, Fig. 6, Fig. 7. The process parameters of Case 1 (cf. Table 1) are utilized.
Fig. 5. Air void formation in the cross-sections of the printed parts for different yield stress.
Fig. 6. Air void formation in the cross-sections of the printed parts for different plastic viscosity.
Fig. 7. Volume fraction of air voids for different models as a function of (a) yield stress and (b) plastic viscosity.
Yield stress
Fig. 5 presents cross-sectional shapes for different yield stress, 400, 630, and 800 Pa. It can be seen that Models 1 and 2 predict a top air void, while for Model 3 the two topmost strands to the left are not in contact with the vertical rebar. The cross-sections illustrate that an increased yield stress causes less deformation of the printed layers and create stands with less round shape. This is due to the reduced effective gap (i.e., the distance between the nozzle and previous printed layer), which results in a reduced air void content for most models as seen quantitatively in Fig. 7-a. This behavior is converse to conventional concrete castings where a more fluid material (e.g. self-compacting concrete) can lead to a lower void content. An exception to the observed behavior that a higher yield stress leads to less voids formation is seen in case of Model 2 with 800 Pa, where the top air void is slightly larger as compared to the one for 630 Pa. Another exception is that an outer bottom air void appears for Models 1 and 2 when increasing the yield stress to 800 Pa. Both exceptions are a consequence of the yield stress now restricting the flow in confined spaces, which illustrates that it is a non-trivial task to fully eradicate air voids only by increasing the yield stress.
Plastic viscosity
As the plastic viscosity is varied, cross-sections for Model 1 show a slight change in air voids, see Fig. 6. A mid-air void is produced when the plastic viscosity is small, while the two largest plastic viscosities only produce the top air void. This is due to the increase in extrusion pressure that leads to larger deformation of the printed layers when the plastic viscosity is increased, cf. details in ref. [47]. When integrating a horizontal rebar (see Model 2), the air void formation increases at higher plastic viscosities. This could be due to the fact that the sideway flow of the depositing material (i.e., y-velocity) is limited by the flow resistance that comes from both the larger plastic viscosity and the presence of the solid rebar. No noticeable change can be seen in the cross-sections of Model 3 for different plastic viscosities. The same findings are quantitatively highlighted in Fig. 7-b, which illustrates that the volume fraction of air voids is not influenced much by the plastic viscosity except for Model 2.
3.3. Influence of processing conditions
The influence of processing conditions such as rebar diameter, nozzle-rebar distance, geometric ratio, and speed ratio on air void formation is presented in terms of cross-sectional shapes and volume fraction of air void, see Fig. 8, Fig. 9, Fig. 10, Fig. 11, Fig. 12. Models 1 to 3 are simulated with the reference material properties, cf. Table 2.
Fig. 8. Air void formation in the cross-sections of the printed parts for different rebar diameters.
Fig. 9. Air void formation in the cross-sections of the printed parts for different nozzle-rebar distances.
Fig. 10. Air void formation in the cross-sections of the printed parts for different geometric ratios.
Fig. 11. Air void formation in the cross-sections of the printed parts for different speed ratios.
Fig. 12. Volume fraction of air voids for different models as a function of (a) rebar diameter, (b) nozzle-rebar distance, (c) geometric ratio, and (d) speed ratio.
Rebar diameter
The influence of the rebar diameter on the air void formation is presented in Fig. 8, Fig. 12-a. Models 2 and 3 are simulated (Model 1 does not contain a rebar) for Cases 1, 2, and 3, cf. Table 1. Fig. 8 illustrates that the top air void appears almost constant for Model 2, whereas the air void below the rebar increases with an enlarged rebar diameter. Two phenomena with opposite effects on the void formation play a role in this regard. On the one hand, increasing the rebar size reduces the space that the strands need to occupy to fully merge and thereby eliminate voids. On the other hand, the resistance towards flow and merging of the parallel strands next to the rebar increases proportionally with the size of the reinforcement. The latter effect is dominating in this case. For Model 3, the air void formation also increases when increasing the reinforcement. In addition to the previously mentioned argument, this is due to the left strands having to flow longer to reach the vertical rebar (i.e., Dnr+Dr/2). Conversely, additional air voids take place on the right-hand side of the vertical rebar for the smallest rebar diameter, because the nozzle-rebar distance Dnr= 20 mm is kept constant. Fig. 12-a underlines quantitatively that the volume fraction of air voids reduces when the rebar diameter is small. The trend is more pronounced for the cross-shaped rebar (Model 3), but in absolute values the air voids are substantially less for Model 2.
Nozzle-rebar distance
Fig. 9, Fig. 12-b show the effect of different nozzle-rebar distances on the formation of air voids. All the models are simulated for Cases 1, 4, and 5, cf. Table 1. Fig. 9 shows that the presence of air voids is reduced when the nozzle-rebar distance reduces. This is because the flowable space around the rebars shrinks. Interestingly, no significant air voids are present in Model 1 and 2 when Dnr= 18 mm, see Fig. 12-b. Fig. 12-b also depicts that the trend is more pronounced for the cross-shaped rebar (Model 3). One should be careful though about decreasing the nozzle-rebar distance too much, as a ridge is forming on the top layer since material from the left strand starts to flow on top of the right strand (Fig. 9), which potentially could affect the final shape of the structure. In case of the cross-shaped rebar model, air voids are formed for all investigated Dnr. One could potentially with benefit reduce the Dnr further, but not more than the sum of half of the nozzle diameter (10 mm), the nozzle wall thickness (2.5 mm), and half of the rebar diameter (4 mm), i.e., 16.5 mm, otherwise the nozzle will collide with the rebar.
Geometric ratio
The effect of the geometric ratio on the formation of air voids is presented in Fig. 10, Fig. 12-c. The considered simulations are Cases 1, 6, and 7 cf. Table 1. Fig. 10 illustrates that decreasing the geometric ratio can reduce the presence of air voids in the cross-sections. This is because a smaller geometric ratio results in wider strands, which then occupy more of the flowable space around the rebars. Note that when Gr= 0.50, 0.45, and 0.40 the layer height is 10, 9, and 8 mm, respectively. No air voids are formed for Model 1 and 2 when Gr= 0.45, and 0.40. However, for the smallest ratio ridges are obtained on either side of the strands as clearly seen for the top layer. These ridges can as previously mentioned have a negative effect on the final shape of the structure. Consequently, Gr= 0.45 is preferable for these two models. In the case of Model 3, air voids are still present next to the vertical rebar, even for the smallest investigated geometric ratio. The volume fraction of air voids is approximately 1.5 %, see Fig. 12-c. The geometric ratio could be reduced further in order to decrease the air voids even more, but the ridges already form at Gr= 0.40. Consequently, it is not possible to fully eliminate air voids while at the same time avoiding ridges when only varying the geometric ratio for Model 3.
Speed ratio
Fig. 11, Fig. 12-d illustrate the formation of air voids for different speed ratios. The considered simulations are Case 1, Case 8, and Case 9, cf. Table 1. The three speed ratios are obtained by applying an extrusion speed of 48.4 mm/s, 51.5 mm/s, and 53.8 mm/s. Fig. 11 show that less air voids are formed when decreasing the speed ratio (i.e., higher extrusion speed). Reducing the speed ratio increases the cross-sectional area of the strands proportionally, thereby decreasing the air voids. Model 1 obtains no air voids for the two smallest ratios, and the same is almost the case for Model 2; only a very small air void is formed when Sr= 0.68, see Fig. 12-d. Model 3 forms air voids for all speed ratios. For the lowest speed ratio, the third strand to the left is in contact with the vertical rebar, but air voids are still formed around the horizontal reinforcement, which underlines the fact that it is difficult to fully eliminate air voids for the cross-shaped rebars.
3.4. Cross-shaped reinforcement
Based on the above analysis, it is clear that the air voids around the horizontal rebar can be eliminated by changing some of the processing conditions, such as the nozzle-rebar distance, geometric ratio, and speed ratio. However, it remains unsolved to fully omit the presence of air voids around the cross-shaped rebar, although the processing conditions can reduce the volume fraction of air voids. A parametric study was conducted by varying some combinations of processing conditions; however, the same conclusion was achieved that the air voids could not be fully eliminated. In order to solve this predicament, a new stepped toolpath is investigated (see Fig. 13) along with three different rebar geometries: 1) cylindrical rebars as in the previous analysis, see Fig. 14-a; 2) a squared horizontal rebar, cf. Fig. 14-b; and 3) cylindrical rebars with a smooth transition between them, see Fig. 14-c. In all scenarios, the speed ratio is 0.665, the size (i.e., diameter or side of square) of the rebars are 6 mm, and the horizontal rebar is placed at a height of 8 mm from the substrate. The other processing parameters are the same as for Case 2 and reference material properties are applied. For scenarios one and two small air voids are formed, but for scenario three air voids are eliminated, see Fig. 14. This numerical analysis illustrates that although it is difficult to get rid of air voids for the cross-shaped rebars, one can do it when carefully selecting the material- and processing-parameters and remembering to have a smooth transition between the rebars.
Fig. 13. New toolpath planning around the cross-shaped rebar.
Fig. 14. Simulated structure with new toolpath and different rebar geometries. (a) Cylindrical horizontal- and vertical-rebar, (b) square horizontal rebar and cylindrical vertical rebar, (c) cylindrical horizontal- and vertical-rebar with smooth transition. Note that Dr= 6 mm, Sr= 0.665, and Hr= 8 mm.
4. Conclusions
A CFD model was used to predict the morphology of strands and the formation of air voids around reinforcement bars when integrated with 3DCP. The model used an elasto-viscoplastic constitutive model to mimic the cementitious mortar flow. The CFD model was compared with experiments that constituted a horizontal and a cross-shaped rebar configuration. The results illustrated that the model with high-accuracy could predict the air void formation in the structures. The simulations had though slightly less wide bottom strands as compared to the experimental counterpart, which was attributed to small differences in material behavior and processing parameters. The CFD model was exploited to investigate the effect of material properties on the air void formation. The results illustrated that by increasing the yield stress less air voids were formed due to the reduced effective gap. However, the air voids could not be eliminated as the increased yield stress also restricted the flow in confined spaces. In contrast to the effect of the yield stress, the void formation decreased somewhat when decreasing the plastic viscosity (although not enough to omit air voids fully). The process parameters were found to have a substantial effect on the air void formation. The air void formation increased when increasing the rebar diameter, because the resistance towards flow around the reinforcement and thereby merging of the strands increased proportional with the size of the rebars. The air voids could be reduced and in some of the horizontal cases fully avoided by reducing the nozzle-rebar distance, but it could come with the expense of ridges (which could affect the final geometry of the structure), since material from one strand would flow on top of a previously deposited stand. Similarly, decreasing the geometric ratio was found to reduce the presence of air voids, because a smaller geometric ratio resulted in wider stands that occupied more of the space around the rebars. However, the smallest ratios also resulted in ridges. It was also found that less air voids were formed when decreasing the speed ratio, since the cross-sectional area of the strands increased proportionally, thereby occupying more space around the rebars. By decreasing the nozzle-rebar distance, geometric ratio, and speed ratio, voids were omitted around the horizontal rebar, but air voids would still be introduced for the cross-shaped rebar. Those air voids could be eliminated by changing the toolpath and some processing parameters, as well as altering the geometry of the reinforcement joint to a smooth transition between the horizontal and vertical rebar. The results highlight that it is non-trivial to avoid air voids when integrating rebars in 3DCP, but that the CFD model is a very strong digital tool when it comes to securing a good bonding between the reinforcement and concrete. A limitation of the CFD model is that with the current computational power it is not possible to simulate a full 3DCP structure. Nevertheless, the CFD model is powerful when it comes to understanding and optimizing printing strategies for individual reinforcement details. In future research, it would be interesting to exploit the CFD model to systematically investigate various reinforcement setups and based on the model results generate response surfaces or lookup tables, which can be coupled with the 3DCP toolpath software. This approach would have several benefits: 1) the computational heavy CFD model could run all scenarios in parallel, thereby minimizing the physical time spent on calculations; 2) one could avoid repetition of individual reinforcement studies; and 3) the response surfaces or lookup tables could in a computational light manner come up with printing strategies for all reinforcement details in a full 3DCP structure.
The authors declare that they have no known competing financial interests or personal relationships that could have appeared to influence the work reported in this paper.
Acknowledgements
The authors would like to acknowledge the support of the Danish Council for Independent Research (DFF) | Technology and Production Sciences (FTP) (Contract No. 8022-00042B). Also, the authors would like to acknowledge the support of the Innovation Fund Denmark (Grant No. 8055-00030B: Next Generation of 3D-printed Concrete Structures and Grant no. 0223-00084B: ThermoForm – Robotic ThermoSetting Printing of Large-Scale Construction Formwork), Moreover, the support of FLOW-3D® regarding licenses is acknowledged.
Appendix A.
This analysis varies the shear modulus (i.e., 20, 50, and 100 kPa) in the case Dr= 8 mm, as seen in Fig. A.1, which presents the cross-sectional shapes (top) and the volume fraction of air voids (bottom). It can be seen that increasing the shear modulus slightly reduces the air void formation. This is because the larger shear modulus enhances the ability of the material to act against the shear deformation. However, an increase in shear modulus also extensively increases the computational time of solving the non-linear elastic response of the elasto-viscoplastic material. For example, the computational time of Model 3 is about 6, 12, and 18 days for a shear modulus of 20, 50, and 100 kPa, respectively. Therefore, the shear modulus is reduced to 100 kPa from the measured value (i.e., 200 kPa) to compare the simulated results with experiments. Furthermore, the shear modulus 20 kPa is chosen for the parametric study in 3.2 Influence of materials properties, 3.3 Influence of processing conditions, 3.4 Cross-shaped reinforcement. These assumptions seem reasonable to avoid extensive computational time consumption since the differences found in Fig. A.1 are not substantial.
Fig. A.1. Air void formation in the cross-sections of the printed parts (top) and the volume fraction of air voids (bottom) for different shear modulus.
References
[1] B. Khoshnevis, R. Russel, H. Kwon, S. Bukkapatnam Contour crafting–a layered fabrication technique Spec. Issue IEEE Robot. Autom. Mag., 8 (2001), pp. 33-42 [2] R.A. Buswell, W.R.L. da Silva, F.P. Bos, H.R. Schipper, D. Lowke, N. Hack, H. Kloft, V. Mechtcherine, T. Wangler, N. Roussel A process classification framework for defining and describing Digital Fabrication with Concrete Cem. Concr. Res., 134 (2020), Article 106068, 10.1016/j.cemconres.2020.106068 [3] D. Asprone, C. Menna, F.P. Bos, T.A.M. Salet, J. Mata-Falcón, W. Kaufmann Rethinking reinforcement for digital fabrication with concrete Cem. Concr. Res., 112 (2018), pp. 111-121, 10.1016/j.cemconres.2018.05.020 [4] B. Khoshnevis Automated construction by contour crafting—related robotics and information technologies Autom. Constr., 13 (2004), pp. 5-19, 10.1016/j.autcon.2003.08.012 [5] R. Hague, I. Campbell, P. Dickens Implications on design of rapid manufacturing Proc. Inst. Mech. Eng. C J. Mech. Eng. Sci., 217 (2003), pp. 25-30, 10.1243/095440603762554587 [6] V. Mechtcherine, V.N. Nerella, F. Will, M. Näther, J. Otto, M. Krause Large-scale digital concrete construction – CONPrint3D concept for on-site, monolithic 3D-printing Autom. Constr., 107 (2019), Article 102933, 10.1016/j.autcon.2019.102933 [7] S. Lim, R.A. Buswell, T.T. Le, S.A. Austin, A.G.F. Gibb, T. Thorpe Developments in construction-scale additive manufacturing processes Autom. Constr., 21 (2012), pp. 262-268, 10.1016/j.autcon.2011.06.010 [8] Meet ICON’s next generation Vulcan construction system ICON (n.d.) https://www.iconbuild.com/vulcan, Accessed 10th Jul 2022 [9] FABRICANT D’IMPRIMANTES 3D POUR LA CONSTRUCTION AUTOMATISÉE DE BÂTIMENTS, Constr.-3D (n.d.) https://www.constructions-3d.com/, Accessed 9th Jul 2022 [10] 3dWasp, 3dWasp (n.d.) https://www.3dwasp.com/, Accessed 12th Aug 2022 [11] G. Ma, R. Buswell, W.R. Leal da Silva, L. Wang, J. Xu, S.Z. Jones Technology readiness: a global snapshot of 3D concrete printing and the frontiers for development Cem. Concr. Res., 156 (2022), Article 106774, 10.1016/j.cemconres.2022.106774 [12] L. Wang, G. Ma, T. Liu, R. Buswell, Z. Li Interlayer reinforcement of 3D printed concrete by the in-process deposition of U-nails Cem. Concr. Res., 148 (2021), Article 106535, 10.1016/j.cemconres.2021.106535 [13] S. Kristombu Baduge, S. Navaratnam, Y. Abu-Zidan, T. McCormack, K. Nguyen, P. Mendis, G. Zhang, L. Aye Improving performance of additive manufactured (3D printed) concrete: a review on material mix design, processing, interlayer bonding, and reinforcing methods Structures., 29 (2021), pp. 1597-1609, 10.1016/j.istruc.2020.12.061 [14] L. Gebhard, J. Mata-Falcón, A. Anton, B. Dillenburger, W. Kaufmann Structural behaviour of 3D printed concrete beams with various reinforcement strategies Eng. Struct., 240 (2021), Article 112380, 10.1016/j.engstruct.2021.112380 [15] P. Feng, X. Meng, H. Zhang Mechanical behavior of FRP sheets reinforced 3D elements printed with cementitious materials Compos. Struct., 134 (2015), pp. 331-342, 10.1016/j.compstruct.2015.08.079 [16] F.P. Bos, C. Menna, M. Pradena, E. Kreiger, W.R.L. da Silva, A.U. Rehman, D. Weger, R.J.M. Wolfs, Y. Zhang, L. Ferrara, V. Mechtcherine The realities of additively manufactured concrete structures in practice Cem. Concr. Res., 156 (2022), Article 106746, 10.1016/j.cemconres.2022.106746 [17] H. Kloft, M. Empelmann, N. Hack, E. Herrmann, D. Lowke Reinforcement strategies for 3D-concrete-printing Civ. Eng. Des., 2 (2020), pp. 131-139, 10.1002/cend.202000022 [18] F.P. Bos, Z.Y. Ahmed, R.J.M. Wolfs, T.A.M. Salet 3D printing concrete with reinforcement D.A. Hordijk, M. Luković (Eds.), High Tech Concr. Technol. Eng. Meet, Springer International Publishing, Cham (2018), pp. 2484-2493, 10.1007/978-3-319-59471-2_283 [19] J. Xiao, G. Ji, Y. Zhang, G. Ma, V. Mechtcherine, J. Pan, L. Wang, T. Ding, Z. Duan, S. Du Large-scale 3D printing concrete technology: current status and future opportunities Cem. Concr. Compos., 122 (2021), Article 104115, 10.1016/j.cemconcomp.2021.104115 [20] Z. Wu, A.M. Memari, J.P. Duarte State of the art review of reinforcement strategies and technologies for 3D printing of concrete Energies., 15 (2022), p. 360, 10.3390/en15010360 [21] B. Baz, G. Aouad, P. Leblond, O. Al-Mansouri, M. D’hondt, S. Remond Mechanical assessment of concrete – steel bonding in 3D printed elements Constr. Build. Mater., 256 (2020), Article 119457, 10.1016/j.conbuildmat.2020.119457 [22] G. Ma, Z. Li, L. Wang, G. Bai Micro-cable reinforced geopolymer composite for extrusion-based 3D printing Mater. Lett., 235 (2019), pp. 144-147, 10.1016/j.matlet.2018.09.159 [23] Z. Li, L. Wang, G. Ma Mechanical improvement of continuous steel microcable reinforced geopolymer composites for 3D printing subjected to different loading conditions Compos. Part B, 187 (2020), Article 107796, 10.1016/j.compositesb.2020.107796 [24] A.R. Arunothayan, B. Nematollahi, R. Ranade, S.H. Bong, J. Sanjayan Development of 3D-printable ultra-high performance fiber-reinforced concrete for digital construction Constr. Build. Mater., 257 (2020), Article 119546, 10.1016/j.conbuildmat.2020.119546 [25] B. Nematollahi, P. Vijay, J. Sanjayan, A. Nazari, M. Xia, V. Naidu Nerella, V. Mechtcherine Effect of polypropylene fibre addition on properties of geopolymers made by 3D printing for digital construction Materials., 11 (2018), p. 2352, 10.3390/ma11122352 [26] Y. Zhang, F. Aslani Development of fibre reinforced engineered cementitious composite using polyvinyl alcohol fibre and activated carbon powder for 3D concrete printing Constr. Build. Mater., 303 (2021), Article 124453, 10.1016/j.conbuildmat.2021.124453 [27] V. Mechtcherine, J. Grafe, V.N. Nerella, E. Spaniol, M. Hertel, U. Füssel 3D-printed steel reinforcement for digital concrete construction – manufacture, mechanical properties and bond behaviour Constr. Build. Mater., 179 (2018), pp. 125-137, 10.1016/j.conbuildmat.2018.05.202 [28] J. Müller, M. Grabowski, C. Müller, J. Hensel, J. Unglaub, K. Thiele, H. Kloft, K. Dilger Design and parameter identification of wire and arc additively manufactured (WAAM) steel bars for use in construction Metals., 9 (2019), p. 725, 10.3390/met9070725 [29] T. Marchment, J. Sanjayan Mesh reinforcing method for 3D concrete printing Autom. Constr., 109 (2020), Article 102992, 10.1016/j.autcon.2019.102992 [30] V. Mechtcherine, R. Buswell, H. Kloft, F.P. Bos, N. Hack, R. Wolfs, J. Sanjayan, B. Nematollahi, E. Ivaniuk, T. Neef Integrating reinforcement in digital fabrication with concrete: a review and classification framework Cem. Concr. Compos., 119 (2021), Article 103964, 10.1016/j.cemconcomp.2021.103964 [31] T. Marchment, J. Sanjayan Bond properties of reinforcing bar penetrations in 3D concrete printing Autom. Constr., 120 (2020), Article 103394, 10.1016/j.autcon.2020.103394 [32] T. Marchment, J. Sanjayan Lap joint reinforcement for 3D concrete printing J. Struct. Eng., 148 (2022), Article 04022063, 10.1061/(ASCE)ST.1943-541X.0003361 [33] V2 Vesta Beton-3D-Drucker baut kleines Haus (n.d.) https://3druck.com/drucker-und-produkte/v2-vesta-beton-3d-drucker-baut-kleines-haus-2846225/, Accessed 27th Oct 2022 [34] Traditional reinforcement in 3D concrete printed structures, Eindh Univ. Technol. Res. Portal (n.d.) https://research.tue.nl/en/studentTheses/traditional-reinforcement-in-3d-concrete-printed-structures, Accessed 31st May 2023 [35] M. Classen, J. Ungermann, R. Sharma Additive manufacturing of reinforced concrete—development of a 3D printing technology for cementitious composites with metallic reinforcement Appl. Sci., 10 (2020), p. 3791, 10.3390/app10113791 [36] L. Gebhard, L. Esposito, C. Menna, J. Mata-Falcón Inter-laboratory study on the influence of 3D concrete printing set-ups on the bond behaviour of various reinforcements Cem. Concr. Compos., 133 (2022), Article 104660, 10.1016/j.cemconcomp.2022.104660 [37] R. Comminal, J.H. Hattel, J. Spangenberg Numerical simulations of planar extrusion and fused filament fabrication of non-Newtonian fluids Annu. Trans. Nord. Rheol. Soc, 25 (2017) [38] M.P. Serdeczny, R. Comminal, D.B. Pedersen, J. Spangenberg Experimental validation of a numerical model for the strand shape in material extrusion additive manufacturing Addit. Manuf., 24 (2018), pp. 145-153, 10.1016/j.addma.2018.09.022 [39] H. Xia, J. Lu, G. Tryggvason A numerical study of the effect of viscoelastic stresses in fused filament fabrication Comput. Methods Appl. Mech. Eng., 346 (2019), pp. 242-259, 10.1016/j.cma.2018.11.031 [40] M.P. Serdeczny, R. Comminal, Md.T. Mollah, D.B. Pedersen, J. Spangenberg Numerical modeling of the polymer flow through the hot-end in filament-based material extrusion additive manufacturing Addit. Manuf., 36 (2020), Article 101454, 10.1016/j.addma.2020.101454 [41] M.T. Mollah, M.P. Serdeczny, R. Comminal, B. Šeta, M. Brander, J. Spangenberg A numerical investigation of the inter-layer bond and surface roughness during the yield stress buildup in wet-on-wet material extrusion additive manufacturing 2022 Summer Top. Meet. Adv. Precis. Addit. Manuf, American Society for Precision Engineering (2022), pp. 131-134 [42] M.P. Serdeczny, R. Comminal, M.T. Mollah, D.B. Pedersen, J. Spangenberg Viscoelastic simulation and optimisation of the polymer flow through the hot-end during filament-based material extrusion additive manufacturing Virtual Phys. Prototyp., 17 (2022), pp. 205-219, 10.1080/17452759.2022.2028522 [43] B. Šeta, M.T. Mollah, V. Kumar, D.K. Pokkalla, S. Kim, A.A. Hassen, J. Spangenberg Modelling fiber orientation during additive manufacturing-compression molding processes Proc. 33rd Annu. Int. Solid Free. Fabr. Symp, The University of Texas at Austin (2022), pp. 906-919 [44] M.T. Mollah, A. Moetazedian, A. Gleadall, J. Yan, W.E. Alphonso, R. Comminal, B. Šeta, T. Lock, J. Spangenberg Investigation on corner precision at different corner angles in material extrusion additive manufacturing: an experimental and computational fluid dynamics analysis Solid Free. Fabr. Symp. 2022 33rd Annu. Meet, The University of Texas at Austin (2022), pp. 872-881 [45] R. Comminal, M.P. Serdeczny, D.B. Pedersen, J. Spangenberg Numerical modeling of the strand deposition flow in extrusion-based additive manufacturing Addit. Manuf., 20 (2018), pp. 68-76, 10.1016/j.addma.2017.12.013 [46] M.P. Serdeczny, R. Comminal, D.B. Pedersen, J. Spangenberg Numerical simulations of the mesostructure formation in material extrusion additive manufacturing Addit. Manuf., 28 (2019), pp. 419-429, 10.1016/j.addma.2019.05.024 [47] M.T. Mollah, R. Comminal, M.P. Serdeczny, D.B. Pedersen, J. Spangenberg Stability and deformations of deposited layers in material extrusion additive manufacturing Addit. Manuf. (2021), Article 102193, 10.1016/j.addma.2021.102193 [48] M.T. Mollah, R. Comminal, M.P. Serdeczny, D.B. Pedersen, J. Spangenberg Numerical predictions of bottom layer stability in material extrusion additive manufacturing JOM. (2022), 10.1007/s11837-021-05035-9 [49] M.T. Mollah, R. Comminal, M.P. Serdeczny, B. Šeta, J. Spangenberg Computational analysis of yield stress buildup and stability of deposited layers in material extrusion additive manufacturing Addit. Manuf., 71 (2023), Article 103605, 10.1016/j.addma.2023.103605 [50] R. Comminal, W.R. Leal da Silva, T.J. Andersen, H. Stang, J. Spangenberg Modelling of 3D concrete printing based on computational fluid dynamics Cem. Concr. Res., 138 (2020), Article 106256, 10.1016/j.cemconres.2020.106256 [51] R. Comminal, W.R.L. Da Silva, T.J. Andersen, H. Stang, J. Spangenberg Influence of processing parameters on the layer geometry in 3D concrete printing: experiments and modelling F.P. Bos, S.S. Lucas, R.J.M. Wolfs, T.A.M. Salet (Eds.), Second RILEM Int. Conf. Concr. Digit. Fabr, Springer International Publishing, Cham (2020), pp. 852-862, 10.1007/978-3-030-49916-7_83 [52] J. Spangenberg, W.R. Leal da Silva, R. Comminal, M.T. Mollah, T.J. Andersen, H. Stang Numerical simulation of multi-layer 3D concrete printing RILEM Tech. Lett., 6 (2021), pp. 119-123, 10.21809/rilemtechlett.2021.142 [53] J. Spangenberg, W.R. Leal da Silva, M.T. Mollah, R. Comminal, T. Juul Andersen, H. Stang Integrating reinforcement with 3D concrete printing: experiments and numerical modelling R. Buswell, A. Blanco, S. Cavalaro, P. Kinnell (Eds.), Third RILEM Int. Conf. Concr. Digit. Fabr., Springer International Publishing, Cham (2022), pp. 379-384, 10.1007/978-3-031-06116-5_56 [54] N. Ranjbar, M. Mehrali, C. Kuenzel, C. Gundlach, D.B. Pedersen, A. Dolatshahi-Pirouz, J. Spangenberg Rheological characterization of 3D printable geopolymers Cem. Concr. Res., 147 (2021), Article 106498, 10.1016/j.cemconres.2021.106498 [55] FLOW-3D® Version 12.0 [Computer software] https://www.flow3d.com (2019), Accessed 10th May 2022 [56] S.F. Ashby, T.A. Manteuffel, P.E. Saylor A taxonomy for conjugate gradient methods SIAM J. Numer. Anal., 27 (1990), pp. 1542-1568, 10.1137/0727091 [57] R. Barrett, M. Berry, T.F. Chan, J. Demmel, J.M. Donato, J. Dongarra, V. Eijkhout, R. Pozo, C. Romine, H.V.D. Vorst Templates for the Solution of Linear Systems: Building Blocks for Iterative Methods (1994) [58] Y. Saad Iterative Methods for Sparse Linear Systems The PWS Series in Computer Science (1996) (http://books.google.com/books?id=jLtiQgAACAAJ) [59] Modeling Capabilities- Immersed Boundary Method | FLOW-3D | Solving The World’s Toughest CFD Problems, FLOW Sci (n.d.) https://www.flow3d.com/modeling-capabilities/immersed-boundary-method/, Accessed 21st Aug 2021 [60] C.W. Hirt, B.D. Nichols Volume of fluid (VOF) method for the dynamics of free boundaries J. Comput. Phys., 39 (1981), pp. 201-225, 10.1016/0021-9991(81)90145-5 [61] R. Comminal, J. Spangenberg, J.H. Hattel Cellwise conservative unsplit advection for the volume of fluid method J. Comput. Phys., 283 (2015), pp. 582-608, 10.1016/j.jcp.2014.12.003
Tungsten carbide was manufactured by picosecond laser in this study. Shapes of the ablated craters evolved from parabolic-like (less than 10 pulses) to Gaussian-like (more than 500 pulses) as the pulse number increased. The shape changes were closely associated with the discontinuous diameter expansion of ablated crater. To explain these phenomena, two thresholds were identified: an upper threshold of 0.129 J/cm2 and a lower threshold of 0.099 J/cm2. When the laser energy exceeded the upper threshold, ablation occurred under the laser-energy-dominated mode. When the laser energy fell between the upper and lower thresholds, ablation occurred under the cumulative-effect-dominated mode. The transition of ablation mode contributed to the diameter expansion and shape change. In addition, elemental composition varied significantly at the ablated crater and heat-affected zone (HAZ), which were related to the degrees of reactions that occurred at different distances from the laser. Finally, surface hardness decreased from base material (32.52 GPa) to edge of crater (11.59 GPa) due to the escape of unpaired interstitial C atoms from the grain boundaries.
References
1Sun JL, Zhao J, Huang ZF, Yan K, Shen X, Xing J, et al. A review on binderless tungsten carbide: development and application. Nano-Micro Lett. 2020; 12(1): 37.ViewPubMedWeb of Science®Google Scholar
2Katiyar PK. A comprehensive review on synergy effect between corrosion and wear of cemented tungsten carbide tool bits: a mechanistic approach. Int J Refract Met Hard Mat. 2020; 92: 18.ViewCASWeb of Science®Google Scholar
3Sun JL, Zhao J, Gong F, Ni XY, Li ZL. Development and application of WC-based alloys bonded with alternative binder phase. Crit Rev Solid State Mat Sci. 2019; 44(3): 211–238.ViewCASWeb of Science®Google Scholar
4Lopez JML, Bakrania A, Coupland J, Marimuthu S. Droplet assisted laser micromachining of hard ceramics. J Eur Ceram Soc. 2016; 36(11): 2689–2694.ViewWeb of Science®Google Scholar
5Chen FJ, Yin SH, Huang H, Homori H, Wang Y, Fan YF, et al. Profile error compensation in ultra-precision grinding of aspheric surfaces with on-machine measurement. Int J Mach Tools Manuf. 2010; 50(5): 480–486.ViewWeb of Science®Google Scholar
6Guo B, Zhao QL. On-machine dry electric discharge truing of diamond wheels for micro-structured surfaces grinding. Int J Mach Tools Manuf. 2015; 88: 62–70.ViewWeb of Science®Google Scholar
7Sciti D, Zoli L, Silvestroni L, Cecere A, Di Martino GD, Savino R. Design, fabrication and high velocity oxy-fuel torch tests of a Cf-ZrB2-fiber nozzle to evaluate its potential in rocket motors. Mater Des. 2016; 109: 709–717.ViewCASWeb of Science®Google Scholar
8Jiang G, Minhao G, Zhiguang Z, Xiaohua L, Nai MLS, Jun W. On the machining of selective laser melting CoCrFeMnNi high-entropy alloy. Mater Des. 2018; 153: 211–220.ViewWeb of Science®Google Scholar
10Ali B, Litvinyuk IV, Rybachuk M. Femtosecond laser micromachining of diamond: current research status, applications and challenges. Carbon. 2021; 179: 209–226.ViewCASWeb of Science®Google Scholar
11Sansone M, De Bonis A, Santagata A, Rau JV, Galasso A, Teghil R. Pulsed laser ablation and deposition of niobium carbide. Appl Surf Sci. 2016; 374: 112–116.ViewCASWeb of Science®Google Scholar
12Wang HP, Guan YC, Zheng HY, Hong MH. Controllable fabrication of metallic micro/nano hybrid structuring surface for antireflection by picosecond laser direct writing. Appl Surf Sci. 2019; 471: 347–354.ViewCASWeb of Science®Google Scholar
13Jiangyou L, Zhijian H, Caixia Z, Xiaozhu X, Zuo C, Peiyang Z, et al. Hierarchical micro- and nanostructures induced by nanosecond laser on copper for superhydrophobicity, ultralow water adhesion and frost resistance. Mater Des. 2018; 155: 185–193.ViewWeb of Science®Google Scholar
14Zemaitis A, Gecys P, Barkauskas M, Raciukaitis G, Gedvilas M. Highly-efficient laser ablation of copper by bursts of ultrashort tuneable (fs-ps) pulses. Sci Rep. 2019; 9: 8.ViewPubMedWeb of Science®Google Scholar
15Basler C, Brandenburg A, Michalik K, Mory D. Comparison of laser pulse duration for the spatially resolved measurement of coating thickness with laser-induced breakdown spectroscopy. Sensors. 2019; 19(19): 10.ViewWeb of Science®Google Scholar
16Qin Z, Xiang H, Liu J, Zeng X. High-performance oil-water separation polytetrafluoroethylene membranes prepared by picosecond laser direct ablation and drilling. Mater Des. 2019; 184:108200.ViewCASWeb of Science®Google Scholar
17Eberle G, Wegener K. Ablation study of WC and PCD composites using 10 picosecond and 1 nanosecond pulse durations at green and infrared wavelengths. In: 8th International Conference on Laser Assisted Net Shape Engineering (LANE); 2014 Sep 08–11, Furth, Germany. Amsterdam: Elsevier Science; 2014. p. 951–962.Google Scholar
18Boerner P, Zandonadi G, Eberle G, Wegener K. Experimental and modelling investigations into the laser ablation with picosecond pulses at second harmonics. In: Conference on laser-based micro- and nanoprocessing IX; 2015 Feb 10–12 San Francisco, CA. Bellingham: SPIE, the international society for optics and photonics; 2015. p. 19–31.Google Scholar
19Urbina JPC, Daniel C, Emmelmann C. Experimental and analytical investigation of cemented tungsten carbide ultra-short pulse laser ablation. In: 7th International WLT conference on Lasers in Manufacturing (LiM), 2013 May 13–16, Munich, Germany. Amsterdam: Elsevier Science; 2013. p. 752–758.Google Scholar
20Stankevic V, Cermak A, Mikalauskas S, Kozmin P, Indrisiunas S, Raciukaitis G. Processing of ultra-hard materials with picosecond pulses: from research work to industrial applications. J Laser Appl. 2018; 30(3): 7.ViewWeb of Science®Google Scholar
21Lickschat P, Metzner D, Weissmantel S. Fundamental investigations of ultrashort pulsed laser ablation on stainless steel and cemented tungsten carbide. Int J Adv Manuf Technol. 2020; 109(3–4): 1167–1175.ViewWeb of Science®Google Scholar
22Ouyang JL, Mativenga PT, Liu Z, Li L. Energy consumption and process characteristics of picosecond laser de-coating of cutting tools. J Cleaner Prod. 2021; 290: 10.ViewWeb of Science®Google Scholar
23Metzner D, Lickschat P, Weissmantel S. Laser micromachining of silicon and cemented tungsten carbide using picosecond laser pulses in burst mode: ablation mechanisms and heat accumulation. Appl Phys A-Mater Sci Process. 2019; 125(7): 8.ViewWeb of Science®Google Scholar
24Marimuthu S, Dunleavey J, Smith B. Picosecond laser machining of tungsten carbide. Int J Refract Met Hard Mat. 2020; 92: 9.ViewWeb of Science®Google Scholar
25Mensink K, Penilla EH, Martinez-Torres P, Cuando-Espitia N, Mathaudhu S, Aguilar G. High repetition rate femtosecond laser heat accumulation and ablation thresholds in cobalt-binder and binderless tungsten carbides. J Mater Process Technol. 2019; 266: 388–396.ViewCASWeb of Science®Google Scholar
26Miley G, Osman F, Hora H, Badziak J, Rohlena K, Jungwirth K, et al. Plasma block acceleration by ps-TW laser irradiation. In High-Power Laser Ablation V: SPIE; 2004. p. 973–986.Google Scholar
27Alidokht SA, Yue S, Chromik RR. Effect of WC morphology on dry sliding wear behavior of cold-sprayed Ni–WC composite coatings. Surf Coat Technol. 2019; 357: 849–863.ViewCASWeb of Science®Google Scholar
28Gao D, Li YH. An improved Gaussian laser beam probability distribution simulation based on Monte Carlo method. Mod Phys Lett B. 2020; 34(36): 9.ViewWeb of Science®Google Scholar
29Garcia-Lechuga M, Puerto D, Fuentes-Edfuf Y, Solis J, Siegel J. Ultrafast moving-spot microscopy: birth and growth of laser-induced periodic surface structures. ACS Photonics. 2016; 3(10): 1961–1967.ViewCASWeb of Science®Google Scholar
30Bashir S, Rafique MS, Nathala CSR, Ajami A, Husinsky W. SEM and Raman spectroscopy analyses of laser-induced periodic surface structures grown by ethanol-assisted femtosecond laser ablation of chromium. Radiat Eff Defects Solids. 2015; 170(5): 414–428.ViewCASWeb of Science®Google Scholar
31Erfanmanesh M, Abdollah-Pour H, Mohammadian-Semnani H, Shoja-Razavi R. Kinetics and oxidation behavior of laser clad WC–Co and Ni/WC–Co coatings. Ceram Int. 2018; 44(11): 12805–12814.ViewCASWeb of Science®Google Scholar
32Petisme MVG, Johansson SAE, Wahnstrom G. A computational study of interfaces in WC–Co cemented carbides. Model Simul Mater Sci Eng. 2015; 23(4): 29.ViewWeb of Science®Google Scholar
33Kornaus K, Raczka M, Gubernat A, Zientara D. Pressureless sintering of binderless tungsten carbide. J Eur Ceram Soc. 2017; 37(15): 4567–4576.ViewCASWeb of Science®Google Scholar
34Kong XS, You YW, Xia JH, Liu CS, Fang QF, Luo GN, et al. First principles study of intrinsic defects in hexagonal tungsten carbide. J Nucl Mater. 2010; 406(3): 323–329.ViewCASWeb of Science®Google Scholar
35Wu X, Shen JY, Jiang F, Wu HR, Li L. Study on the oxidation of WC–Co cemented carbide under different conditions. Int J Refract Met Hard Mat. 2021; 94: 8.ViewWeb of Science®Google Scholar
37Juslin N, Erhart P, Traskelin P, Nord J, Henriksson KOE, Nordlund K, et al. Analytical interatomic potential for modeling nonequilibrium processes in the W–C–H system. J Appl Phys. 2005; 98(12): 12.ViewWeb of Science®Google Scholar
38Sevy A, Huffaker RF, Morse MD. Bond dissociation energies of tungsten molecules: WC, WSi, WS, WSe, and WCl. J Phys Chem A. 2017; 121(49): 9446–9457.ViewCASPubMedWeb of Science®Google Scholar
39Burr PA, Oliver SX. Formation and migration of point defects in tungsten carbide: unveiling the sluggish bulk self-diffusivity of WC. J Eur Ceram Soc. 2019; 39(2–3): 165–172.ViewCASWeb of Science®Google Scholar
40Tahara M, Kim HY, Inamura T, Hosoda H, Miyazaki S. Role of interstitial atoms in the microstructure and non-linear elastic deformation behavior of Ti–Nb alloy. J Alloys Compd. 2013; 577: S404–S407.ViewCASWeb of Science®Google Scholar
C. M. Ladeiro Department of Metallurgical and Materials Engineering, Faculdade de Engenharia, Universidade do Porto, Rua Dr. Roberto Frias, 4200-465 PORTO, Portugal (up201806112@fe.up.pt) ORCID 0009-0003-8587-2309 F. L. Nunes Department of Metallurgical and Materials Engineering, Faculdade de Engenharia, Universidade do Porto, Rua Dr. Roberto Frias, 4200-465 PORTO, Portugal (up201806193@fe.up.pt) ORCID 0009-0000-0988-4285 M. M. Trindade Department of Metallurgical and Materials Engineering, Faculdade de Engenharia, Universidade do Porto, Rua Dr. Roberto Frias, 4200-465 PORTO, Portugal (up201806438@fe.up.pt) ORCID 0009-0008-1397-5321 J. M. Costa Department of Metallurgical and Materials Engineering, Faculdade de Engenharia, Universidade do Porto and LAETA/INEGI – Institute of Science and Innovation in Mechanical and Industrial Engineering, Rua Dr. Roberto Frias, 4200-465 PORTO, Portugal (jose.costa@fe.up.pt) ORCID 0000-0002-1714-4671
Abstract
In today’s world, additive manufacturing (AM) is one of the most popular technologies and has the potential to revolutionize the manufacturing industry. As one of the most recent advances in this industry, liquid metal printing has a growing value in the engineering field. This study aims to evaluate the effect of two heat treatment conditions in an Al-4008 alloy produced by this technique in the microstructure and mechanical properties. It was concluded that the heat treatment (HT) enhances the Si particle coalescence and Fe-rich intermetallic compound precipitation, increasing the sample hardness significantly (50%). Density analysis showed a slight porosity decrease with HT. Tensile tests indicated heat-treated, same-directionally pulled samples exhibited brittleness compared to as-printed ones, while HT increased both yield strength (245 MPa) and ultimate tensile strength (294 MPa).
오늘날 세계에서 적층 제조(AM)는 가장 인기 있는 기술 중 하나이며 제조 산업에 혁명을 일으킬 잠재력을 가지고 있습니다. 이 업계의 가장 최근 발전 중 하나인 액체 금속 인쇄는 엔지니어링 분야에서 그 가치가 커지고 있습니다. 본 연구는 이 기술로 생산된 Al-4008 합금의 두 가지 열처리 조건이 미세 구조 및 기계적 특성에 미치는 영향을 평가하는 것을 목표로 합니다. 열처리(HT)는 Si 입자 유착과 Fe가 풍부한 금속간 화합물 침전을 향상시켜 샘플 경도를 크게(50%) 증가시키는 것으로 결론지었습니다. 밀도 분석에서는 HT를 사용하면 다공성이 약간 감소하는 것으로 나타났습니다. 인장 테스트에서는 동일한 방향으로 당겨진 열처리된 샘플이 인쇄된 샘플에 비해 취성을 보인 반면, HT는 항복 강도(245MPa)와 최대 인장 강도(294MPa)를 모두 증가시켰습니다.
The coupled dynamics of interfacial fluid phases and unconstrained solid particles during the binder jet 3D printing process govern the final quality and performance of the resulting components. The present work proposes a computational fluid dynamics (CFD) and discrete element method (DEM) framework capable of simulating the complex interfacial fluid–particle interaction that occurs when binder microdroplets are deposited into a powder bed. The CFD solver uses a volume-of-fluid (VOF) method for capturing liquid–gas multifluid flows and relies on block-structured adaptive mesh refinement (AMR) to localize grid refinement around evolving fluid–fluid interfaces. The DEM module resolves six degrees of freedom particle motion and accounts for particle contact, cohesion, and rolling resistance. Fully-resolved CFD-DEM coupling is achieved through a fictitious domain immersed boundary (IB) approach. An improved method for enforcing three-phase contact lines with a VOF-IB extension technique is introduced. We present several simulations of binder jet primitive formation using realistic process parameters and material properties. The DEM particle systems are experimentally calibrated to reproduce the cohesion behavior of physical nickel alloy powder feedstocks. We demonstrate the proposed model’s ability to resolve the interdependent fluid and particle dynamics underlying the process by directly comparing simulated primitive granules with one-to-one experimental counterparts obtained from an in-house validation apparatus. This computational framework provides unprecedented insight into the fundamental mechanisms of binder jet 3D printing and presents a versatile new approach for process parameter optimization and defect mitigation that avoids the inherent challenges of experiments.
바인더 젯 3D 프린팅 공정 중 계면 유체 상과 구속되지 않은 고체 입자의 결합 역학이 결과 구성 요소의 최종 품질과 성능을 좌우합니다. 본 연구는 바인더 미세액적이 분말층에 증착될 때 발생하는 복잡한 계면 유체-입자 상호작용을 시뮬레이션할 수 있는 전산유체역학(CFD) 및 이산요소법(DEM) 프레임워크를 제안합니다.
CFD 솔버는 액체-가스 다중유체 흐름을 포착하기 위해 VOF(유체량) 방법을 사용하고 블록 구조 적응형 메쉬 세분화(AMR)를 사용하여 진화하는 유체-유체 인터페이스 주위의 그리드 세분화를 국지화합니다. DEM 모듈은 6개의 자유도 입자 운동을 해결하고 입자 접촉, 응집력 및 구름 저항을 설명합니다.
완전 분해된 CFD-DEM 결합은 가상 도메인 침지 경계(IB) 접근 방식을 통해 달성됩니다. VOF-IB 확장 기술을 사용하여 3상 접촉 라인을 강화하는 향상된 방법이 도입되었습니다. 현실적인 공정 매개변수와 재료 특성을 사용하여 바인더 제트 기본 형성에 대한 여러 시뮬레이션을 제시합니다.
DEM 입자 시스템은 물리적 니켈 합금 분말 공급원료의 응집 거동을 재현하기 위해 실험적으로 보정되었습니다. 우리는 시뮬레이션된 기본 과립과 내부 검증 장치에서 얻은 일대일 실험 대응물을 직접 비교하여 프로세스의 기본이 되는 상호 의존적인 유체 및 입자 역학을 해결하는 제안된 모델의 능력을 보여줍니다.
이 계산 프레임워크는 바인더 제트 3D 프린팅의 기본 메커니즘에 대한 전례 없는 통찰력을 제공하고 실험에 내재된 문제를 피하는 공정 매개변수 최적화 및 결함 완화를 위한 다용도의 새로운 접근 방식을 제시합니다.
Introduction
Binder jet 3D printing (BJ3DP) is a powder bed additive manufacturing (AM) technology capable of fabricating geometrically complex components from advanced engineering materials, such as metallic superalloys and ultra-high temperature ceramics [1], [2]. As illustrated in Fig. 1(a), the process is comprised of many repetitive print cycles, each contributing a new cross-sectional layer on top of a preceding one to form a 3D CAD-specified geometry. The feedstock material is first delivered from a hopper to a build plate and then spread into a thin layer by a counter-rotating roller. After powder spreading, a print head containing many individual inkjet nozzles traverses over the powder bed while precisely jetting binder microdroplets onto select regions of the spread layer. Following binder deposition, the build plate lowers by a specified layer thickness, leaving a thin void space at the top of the job box that the subsequent powder layer will occupy. This cycle repeats until the full geometries are formed layer by layer. Powder bed fusion (PBF) methods follow a similar procedure, except they instead use a laser or electron beam to selectively melt and fuse the powder material. Compared to PBF, binder jetting offers several distinct advantages, including faster build rates, enhanced scalability for large production volumes, reduced machine and operational costs, and a wider selection of suitable feedstock materials [2]. However, binder jetted parts generally possess inferior mechanical properties and reduced dimensional accuracy [3]. As a result, widescale adoption of BJ3DP to fabricate high-performance, mission-critical components, such as those common to the aerospace and defense sectors, is contingent on novel process improvements and innovations [4].
A major obstacle hindering the advancement of BJ3DP is our limited understanding of how various printing parameters and material properties collectively influence the underlying physical mechanisms of the process and their effect on the resulting components. To date, the vast majority of research efforts to uncover these relationships have relied mainly on experimental approaches [5], [6], [7], [8], [9], [10], [11], [12], [13], [14], [15], [16], [17], [18], [19], which are often expensive and time-consuming and have inherent physical restrictions on what can be measured and observed. For these reasons, there is a rapidly growing interest in using computational models to circumvent the challenges of experimental investigations and facilitate a deeper understanding of the process’s fundamental phenomena. While significant progress has been made in developing and deploying numerical frameworks aimed at powder spreading [20], [21], [22], [23], [24], [25], [26], [27] and sintering [28], [29], [30], [31], [32], simulating the interfacial fluid–particle interaction (IFPI) in the binder deposition stage is still in its infancy. In their exhaustive review, Mostafaei et al. [2] point out the lack of computational models capable of resolving the coupled fluid and particle dynamics associated with binder jetting and suggest that the development of such tools is critical to further improving the process and enhancing the quality of its end-use components.
We define IFPI as a multiphase flow regime characterized by immiscible fluid phases separated by dynamic interfaces that intersect the surfaces of moving solid particles. As illustrated in Fig. 1(b), an elaborate IFPI occurs when a binder droplet impacts the powder bed in BJ3DP. The momentum transferred from the impacting droplet may cause powder compaction, cratering, and particle ejection. These ballistic disturbances can have deleterious effects on surface texture and lead to the formation of large void spaces inside the part [5], [13]. After impact, the droplet spreads laterally on the bed surface and vertically into the pore network, driven initially by inertial impact forces and then solely by capillary action [33]. Attractive capillary forces exerted on mutually wetted particles tend to draw them inward towards each other, forming a packed cluster of bound particles referred to as a primitive [34]. A single-drop primitive is the most fundamental building element of a BJ3DP part, and the interaction leading to its formation has important implications on the final part characteristics, such as its mechanical properties, resolution, and dimensional accuracy. Generally, binder droplets are deposited successively as the print head traverses over the powder bed. The traversal speed and jetting frequency are set such that consecutive droplets coalesce in the bed, creating a multi-drop primitive line instead of a single-drop primitive granule. The binder must be jetted with sufficient velocity to penetrate the powder bed deep enough to provide adequate interlayer binding; however, a higher impact velocity leads to more pronounced ballistic effects.
A computational framework equipped to simulate the interdependent fluid and particle dynamics in BJ3DP would allow for unprecedented observational and measurement capability at temporal and spatial resolutions not currently achievable by state-of-the-art imaging technology, namely synchrotron X-ray imaging [13], [14], [18], [19]. Unfortunately, BJ3DP presents significant numerical challenges that have slowed the development of suitable modeling frameworks; the most significant of which are as follows:
1.Incorporating dynamic fluid–fluid interfaces with complex topological features remains a nontrivial task for standard mesh-based CFD codes. There are two broad categories encompassing the methods used to handle interfacial flows: interface tracking and interface capturing [35]. Interface capturing techniques, such as the popular volume-of-fluid (VOF) [36] and level-set methods [37], [38], are better suited for problems with interfaces that become heavily distorted or when coalescence and fragmentation occur frequently; however, they are less accurate in resolving surface tension and boundary layer effects compared to interface tracking methods like front-tracking [39], arbitrary Lagrangian–Eulerian [40], and space–time finite element formulations [41]. Since interfacial forces become increasingly dominant at decreasing length scales, inaccurate surface tension calculations can significantly deteriorate the fidelity of IFPI simulations involving <100 μm droplets and particles.
2.Dynamic powder systems are often modeled using the discrete element method (DEM) introduced by Cundall and Strack [42]. For IFPI problems, a CFD-DEM coupling scheme is required to exchange information between the fluid and particle solvers. Fully-resolved CFD-DEM coupling suggests that the flow field around individual particle surfaces is resolved on the CFD mesh [43], [44]. In contrast, unresolved coupling volume averages the effect of the dispersed solid phase on the continuous fluid phases [45], [46], [47], [48]. Comparatively, the former is computationally expensive but provides detailed information about the IFPI in question and is more appropriate when contact line dynamics are significant. However, since the pore structure of a powder bed is convoluted and evolves with time, resolving such solid–fluid interfaces on a computational mesh presents similar challenges as fluid–fluid interfaces discussed in the previous point. Although various algorithms have been developed to deform unstructured meshes to accommodate moving solid surfaces (see Bazilevs et al. [49] for an overview of such methods), they can be prohibitively expensive when frequent topology changes require mesh regeneration rather than just modification through nodal displacement. The pore network in a powder bed undergoes many topology changes as particles come in and out of contact with each other, constantly closing and opening new flow channels. Non-body-conforming structured grid approaches that rely on immersed boundary (IB) methods to embed the particles in the flow field can be better suited for such cases [50]. Nevertheless, accurately representing these complex pore geometries on Cartesian grids requires extremely high mesh resolutions, which can impose significant computational costs.
3.Capillary effects depend on the contact angle at solid–liquid–gas intersections. Since mesh nodes do not coincide with a particle surface when using an IB method on structured grids, imposing contact angle boundary conditions at three-phase contact lines is not straightforward.
While these issues also pertain to PBF process modeling, resolving particle motion is generally less crucial for analyzing melt pool dynamics compared to primitive formation in BJ3DP. Therefore, at present, the vast majority of computational process models of PBF assume static powder beds and avoid many of the complications described above, see, e.g., [51], [52], [53], [54], [55], [56], [57], [58], [59]. Li et al. [60] presented the first 2D fully-resolved CFD-DEM simulations of the interaction between the melt pool, powder particles, surrounding gas, and metal vapor in PBF. Following this work, Yu and Zhao [61], [62] published similar melt pool IFPI simulations in 3D; however, contact line dynamics and capillary forces were not considered. Compared to PBF, relatively little work has been published regarding the computational modeling of binder deposition in BJ3DP. Employing the open-source VOF code Gerris [63], Tan [33] first simulated droplet impact on a powder bed with appropriate binder jet parameters, namely droplet size and impact velocity. However, similar to most PBF melt pool simulations described in the current literature, the powder bed was fixed in place and not allowed to respond to the interacting fluid phases. Furthermore, a simple face-centered cubic packing of non-contacting, monosized particles was considered, which does not provide a realistic pore structure for AM powder beds. Building upon this approach, we presented a framework to simulate droplet impact on static powder beds with more practical particle size distributions and packing arrangements [64]. In a study similar to [33], [64], Deng et al. [65] used the VOF capability in Ansys Fluent to examine the lateral and vertical spreading of a binder droplet impacting a fixed bimodal powder bed with body-centered packing. Li et al. [66] also adopted Fluent to conduct 2D simulations of a 100 μm diameter droplet impacting substrates with spherical roughness patterns meant to represent the surface of a simplified powder bed with monosized particles. The commercial VOF-based software FLOW-3D offers an AM module centered on process modeling of various AM technologies, including BJ3DP. However, like the above studies, particle motion is still not considered in this codebase. Ur Rehman et al. [67] employed FLOW-3D to examine microdroplet impact on a fixed stainless steel powder bed. Using OpenFOAM, Erhard et al. [68] presented simulations of different droplet impact spacings and patterns on static sand particles.
Recently, Fuchs et al. [69] introduced an impressive multipurpose smoothed particle hydrodynamics (SPH) framework capable of resolving IFPI in various AM methods, including both PBF and BJ3DP. In contrast to a combined CFD-DEM approach, this model relies entirely on SPH meshfree discretization of both the fluid and solid governing equations. The authors performed several prototype simulations demonstrating an 80 μm diameter droplet impacting an unconstrained powder bed at different speeds. While the powder bed responds to the hydrodynamic forces imparted by the impacting droplet, the particle motion is inconsistent with experimental time-resolved observations of the process [13]. Specifically, the ballistic effects, such as particle ejection and bed deformation, were drastically subdued, even in simulations using a droplet velocity ∼ 5× that of typical jetting conditions. This behavior could be caused by excessive damping in the inter-particle contact force computations within their SPH framework. Moreover, the wetted particles did not appear to be significantly influenced by the strong capillary forces exerted by the binder as no primitive agglomeration occurred. The authors mention that the objective of these simulations was to demonstrate their codebase’s broad capabilities and that some unrealistic process parameters were used to improve computational efficiency and stability, which could explain the deviations from experimental observations.
In the present paper, we develop a novel 3D CFD-DEM numerical framework for simulating fully-resolved IFPI during binder jetting with realistic material properties and process parameters. The CFD module is based on the VOF method for capturing binder–air interfaces. Surface tension effects are realized through the continuum surface force (CSF) method with height function calculations of interface curvature. Central to our fluid solver is a proprietary block-structured AMR library with hierarchical octree grid nesting to focus enhanced grid resolution near fluid–fluid interfaces. The GPU-accelerated DEM module considers six degrees of freedom particle motion and includes models based on Hertz-Mindlin contact, van der Waals cohesion, and viscoelastic rolling resistance. The CFD and DEM modules are coupled to achieve fully-resolved IFPI using an IB approach in which Lagrangian solid particles are mapped to the underlying Eulerian fluid mesh through a solid volume fraction field. An improved VOF-IB extension algorithm is introduced to enforce the contact angle at three-phase intersections. This provides robust capillary flow behavior and accurate computations of the fluid-induced forces and torques acting on individual wetted particles in densely packed powder beds.
We deploy our integrated codebase for direct numerical simulations of single-drop primitive formation with powder beds whose particle size distributions are generated from corresponding laboratory samples. These simulations use jetting parameters similar to those employed in current BJ3DP machines, fluid properties that match commonly used aqueous polymeric binders, and powder properties specific to nickel alloy feedstocks. The cohesion behavior of the DEM powder is calibrated based on the angle of repose of the laboratory powder systems. The resulting primitive granules are compared with those obtained from one-to-one experiments conducted using a dedicated in-house test apparatus. Finally, we demonstrate how the proposed framework can simulate more complex and realistic printing operations involving multi-drop primitive lines.
Section snippets
Mathematical description of interfacial fluid–particle interaction
This section briefly describes the governing equations of fluid and particle dynamics underlying the CFD and DEM solvers. Our unified framework follows an Eulerian–Lagrangian approach, wherein the Navier–Stokes equations of incompressible flow are discretized on an Eulerian grid to describe the motion of the binder liquid and surrounding gas, and the Newton–Euler equations account for the positions and orientations of the Lagrangian powder particles. The mathematical foundation for
CFD solver for incompressible flow with multifluid interfaces
This section details the numerical methodology used in our CFD module to solve the Navier–Stokes equations of incompressible flow. First, we introduce the VOF method for capturing the interfaces between the binder and air phases. This approach allows us to solve the fluid dynamics equations considering only a single continuum field with spatial and temporal variations in fluid properties. Next, we describe the time integration procedure using a fractional-step projection algorithm for
DEM solver for solid particle dynamics
This section covers the numerical procedure for tracking the motion of individual powder particles with DEM. The Newton–Euler equations (Eqs. (10), (11)) are ordinary differential equations (ODEs) for which many established numerical integrators are available. In general, the most challenging aspects of DEM involve processing particle collisions in a computationally efficient manner and dealing with small time step constraints that result from stiff materials, such as metallic AM powders. The
Unified CFD-DEM solver
The preceding sections have introduced the CFD and DEM solution algorithms separately. Here, we discuss the integrated CFD-DEM solution algorithm and related details.
Binder jet process modeling and validation experiments
In this section, we deploy our CFD-DEM framework to simulate the IFPI occurring during the binder droplet deposition stage of the BJ3DP process. The first simulations attempt to reproduce experimental single-drop primitive granules extracted from four nickel alloy powder samples with varying particle size distributions. The experiments are conducted with a dedicated in-house test apparatus that allows for the precision deposition of individual binder microdroplets into a powder bed sample. The
Conclusions
This paper introduces a coupled CFD-DEM framework capable of fully-resolved simulation of the interfacial fluid–particle interaction occurring in the binder jet 3D printing process. The interfacial flow of binder and surrounding air is captured with the VOF method and surface tension effects are incorporated using the CSF technique augmented by height function curvature calculations. Block-structured AMR is employed to provide localized grid refinement around the evolving liquid–gas interface.
CRediT authorship contribution statement
Joshua J. Wagner: Conceptualization, Data curation, Formal analysis, Investigation, Methodology, Software, Visualization, Writing – original draft, Writing – review & editing. C. Fred Higgs III: Conceptualization, Funding acquisition, Investigation, Methodology, Project administration, Resources, Supervision, Writing – original draft, Writing – review & editing.
Declaration of competing interest
The authors declare that they have no known competing financial interests or personal relationships that could have appeared to influence the work reported in this paper.
Acknowledgments
This work was supported by a NASA Space Technology Research Fellowship, United States of America, Grant No. 80NSSC19K1171. Partial support was also provided through an AIAA Foundation Orville, USA and Wilbur Wright Graduate Award, USA . The authors would like to gratefully acknowledge Dr. Craig Smith of NASA Glenn Research Center for the valuable input he provided on this project.
Formation of a quasi-steady molten pool is one of the necessary conditions for achieving excellent quality in many laser processes. The influences of distribution characteristics of powder sizes on quasi-stability of the molten pool shape during single-track powder bed fusion-laser beam (PBF-LB) of molybdenum and the underlying mechanism were investigated.
The feasibility of improving quasi-stability of the molten pool shape by increasing the laser energy conduction effect and preheating was explored. Results show that an increase in the range of powder sizes does not significantly influence the average laser energy conduction effect in PBF-LB process. Whereas, it intensifies fluctuations of the transient laser energy conduction effect.
It also leads to fluctuations of the replenishment rate of metals, difficulty in formation of the quasi-steady molten pool, and increased probability of incomplete fusion and pores defects. As the laser power rises, the laser energy conduction effect increases, which improves the quasi-stability of the molten pool shape. When increasing the laser scanning speed, the laser energy conduction effect grows.
However, because the molten pool size reduces due to the decreased heat input, the replenishment rate of metals of the molten pool fluctuates more obviously and the quasi-stability of the molten pool shape gets worse. On the whole, the laser energy conduction effect in the PBF-LB process of Mo is low (20-40%). The main factor that affects quasi-stability of the molten pool shape is the amount of energy input per unit length of the scanning path, rather than the laser energy conduction effect.
Moreover, substrate preheating can not only enlarge the molten pool size, particularly the length, but also reduce non-uniformity and discontinuity of surface morphologies of clad metals and inhibit incomplete fusion and pores defects.
준안정 용융 풀의 형성은 많은 레이저 공정에서 우수한 품질을 달성하는 데 필요한 조건 중 하나입니다. 몰리브덴의 단일 트랙 분말층 융합 레이저 빔(PBF-LB) 동안 용융 풀 형태의 준안정성에 대한 분말 크기 분포 특성의 영향과 그 기본 메커니즘을 조사했습니다.
레이저 에너지 전도 효과와 예열을 증가시켜 용융 풀 형태의 준안정성을 향상시키는 타당성을 조사했습니다. 결과는 분말 크기 범위의 증가가 PBF-LB 공정의 평균 레이저 에너지 전도 효과에 큰 영향을 미치지 않음을 보여줍니다. 반면, 과도 레이저 에너지 전도 효과의 변동이 강화됩니다.
이는 또한 금속 보충 속도의 변동, 준안정 용융 풀 형성의 어려움, 불완전 융합 및 기공 결함 가능성 증가로 이어집니다. 레이저 출력이 증가함에 따라 레이저 에너지 전도 효과가 증가하여 용융 풀 모양의 준 안정성이 향상됩니다. 레이저 스캐닝 속도를 높이면 레이저 에너지 전도 효과가 커집니다.
그러나 열 입력 감소로 인해 용융 풀 크기가 줄어들기 때문에 용융 풀의 금속 보충 속도의 변동이 더욱 뚜렷해지고 용융 풀 형태의 준안정성이 악화됩니다.
전체적으로 Mo의 PBF-LB 공정에서 레이저 에너지 전도 효과는 낮다(20~40%). 용융 풀 형상의 준안정성에 영향을 미치는 주요 요인은 레이저 에너지 전도 효과보다는 스캐닝 경로의 단위 길이당 입력되는 에너지의 양입니다.
또한 기판 예열은 용융 풀 크기, 특히 길이를 확대할 수 있을 뿐만 아니라 클래드 금속 표면 형태의 불균일성과 불연속성을 줄이고 불완전한 융합 및 기공 결함을 억제합니다.
M. Sharifitabar, F.O. Sadeq, and M.S. Afarani, Synthesis and Kinetic Study of Mo (Si, Al)2 Coatings on the Surface of Molybdenum Through Hot Dipping into a Commercial Al-12 wt.% Si Alloy Melt, Surf. Interfaces, 2021, 24, p 101044.ArticleCASGoogle Scholar
Z. Zhang, X. Li, and H. Dong, Response of a Molybdenum Alloy to Plasma Nitriding, Int. J. Refract. Met. Hard Mater., 2018, 72, p 388–395.ArticleCASGoogle Scholar
C. Tan, K. Zhou, M. Kuang, W. Ma, and T. Kuang, Microstructural Characterization and Properties of Selective Laser Melted Maraging Steel with Different Build Directions, Sci. Technol. Adv. Mater., 2018, 19(1), p 746–758.ArticleCASGoogle Scholar
C. Tan, F. Weng, S. Sui, Y. Chew, and G. Bi, Progress and Perspectives in Laser Additive Manufacturing of Key Aeroengine Materials, Int. J. Mach. Tools Manuf, 2021, 170, p 103804.ArticleGoogle Scholar
S.A. Khairallah and A. Anderson, Mesoscopic Simulation Model of Selective Laser Melting of Stainless Steel Powder, J. Mater. Process. Technol., 2014, 214(11), p 2627–2636.ArticleCASGoogle Scholar
S.A. Khairallah, A.T. Anderson, A. Rubenchik, and W.E. King, Laser Powder-Bed Fusion Additive Manufacturing: Physics of Complex Melt Flow and Formation Mechanisms of Pores, Spatter, and Denudation Zones, Acta Mater., 2016, 108, p 36–45.ArticleCASADSGoogle Scholar
K.Q. Le, C. Tang, and C.H. Wong, On the Study of Keyhole-Mode Melting in Selective Laser Melting Process, Int. J. Therm. Sci., 2019, 145, p 105992.ArticleGoogle Scholar
M. Bayat, A. Thanki, S. Mohanty, A. Witvrouw, S. Yang, J. Thorborg, N.S. Tiedje, and J.H. Hattel, Keyhole-Induced Porosities in Laser-Based Powder Bed Fusion (L-PBF) of Ti6Al4V: High-Fidelity Modelling and Experimental Validation, Addit. Manuf., 2019, 30, p 100835.CASGoogle Scholar
B. Liu, G. Fang, L. Lei, and X. Yan, Predicting the Porosity Defects in Selective Laser Melting (SLM) by Molten Pool Geometry, Int. J. Mech. Sci., 2022, 228, p 107478.ArticleGoogle Scholar
W. Ge, J.Y.H. Fuh, and S.J. Na, Numerical Modelling of Keyhole Formation in Selective Laser Melting of Ti6Al4V, J. Manuf. Process., 2021, 62, p 646–654.ArticleGoogle Scholar
W. Ge, S. Han, S.J. Na, and J.Y.H. Fuh, Numerical Modelling of Surface Morphology in Selective Laser Melting, Comput. Mater. Sci., 2021, 186, p 110062.ArticleGoogle Scholar
Y.-C. Wu, C.-H. San, C.-H. Chang, H.-J. Lin, R. Marwan, S. Baba, and W.-S. Hwang, Numerical Modeling of Melt-Pool Behavior In Selective Laser Melting with Random Powder Distribution and Experimental Validation, J. Mater. Process. Technol., 2018, 254, p 72–78.ArticleGoogle Scholar
C. Tang, J.L. Tan, and C.H. Wong, A Numerical Investigation on the Physical Mechanisms of Single Track Defects in Selective Laser Melting, Int. J. Heat Mass Transf., 2018, 126, p 957–968.ArticleCASGoogle Scholar
X. Zhou, X. Liu, D. Zhang, Z. Shen, and W. Liu, Balling Phenomena in Selective Laser Melted Tungsten, J. Mater. Process. Technol., 2015, 222, p 33–42.ArticleCASGoogle Scholar
J.D.K. Monroy and J. Ciurana, Study of the Pore Formation on CoCrMo Alloys by Selective Laser Melting Manufacturing Process, Procedia Eng., 2013, 63, p 361–369.ArticleCASGoogle Scholar
L. Kaserer, J. Braun, J. Stajkovic, K.H. Leitz, B. Tabernig, P. Singer, I. Letofsky-Papst, H. Kestler, and G. Leichtfried, Fully Dense and Crack Free Molybdenum Manufactured by Selective Laser Melting Through Alloying with Carbon, Int. J. Refract. Met. Hard Mater., 2019, 84, p 105000.ArticleCASGoogle Scholar
T.B.T. Majumdar, E.M.C. Ribeiro, J.E. Frith, and N. Birbilis, Understanding the Effects of PBF Process Parameter Interplay on Ti-6Al-4V Surface Properties, PLoS ONE, 2019, 14, p e0221198.ArticleCASPubMedPubMed CentralGoogle Scholar
A.K.J.-R. Poulin, P. Terriault, and V. Brailovski, Long Fatigue Crack Propagation Behavior of Laser Powder Bed-Fused Inconel 625 with Intentionally- Seeded Porosity, Int. J. Fatigue, 2019, 127, p 144–156.ArticleCASGoogle Scholar
P. Rebesan, M. Ballan, M. Bonesso, A. Campagnolo, S. Corradetti, R. Dima, C. Gennari, G.A. Longo, S. Mancin, M. Manzolaro, G. Meneghetti, A. Pepato, E. Visconti, and M. Vedani, Pure Molybdenum Manufactured by Laser Powder Bed Fusion: Thermal and Mechanical Characterization at Room and High Temperature, Addit. Manuf., 2021, 47, p 102277.CASGoogle Scholar
D. Wang, C. Yu, J. Ma, W. Liu, and Z. Shen, Densification and Crack Suppression in Selective Laser Melting of Pure Molybdenum, Mater. Des., 2017, 129, p 44–52.ArticleCASGoogle Scholar
K.-H. Leitz, P. Singer, A. Plankensteiner, B. Tabernig, H. Kestler, and L.S. Sigl, Multi-physical Simulation of Selective Laser Melting, Met. Powder Rep., 2017, 72, p 331–338.ArticleGoogle Scholar
D.G.J. Zhang, Y. Yang, H. Zhang, H. Chen, D. Dai, and K. Lin, Influence of Particle Size on Laser Absorption and Scanning Track Formation Mechanisms of Pure Tungsten Powder During Selective Laser Melting, Engineering, 2019, 5, p 736–745.ArticleCASGoogle Scholar
L. Caprio, A.G. Demir, and B. Previtali, Influence of Pulsed and Continuous Wave Emission on Melting Efficiency in Selective Laser Melting, J. Mater. Process. Technol., 2019, 266, p 429–441.ArticleCASGoogle Scholar
D. Gu, M. Xia, and D. Dai, On the Role of Powder Flow Behavior in Fluid Thermodynamics and Laser Processability of Ni-based Composites by Selective Laser Melting, Int. J. Mach. Tools Manuf, 2018, 137, p 67–78.ArticleGoogle Scholar
W.-I. Cho, S.-J. Na, C. Thomy, and F. Vollertsen, Numerical Simulation of Molten Pool Dynamics in High Power Disk Laser Welding, J. Mater. Process. Technol., 2012, 212(1), p 262–275.ArticleCASGoogle Scholar
S.W. Han, J. Ahn, and S.J. Na, A Study on Ray Tracing Method for CFD Simulations of Laser Keyhole Welding: Progressive Search Method, Weld. World, 2016, 60, p 247–258.ArticleCASGoogle Scholar
W. Ge, S. Han, Y. Fang, J. Cheon, and S.J. Na, Mechanism of Surface Morphology in Electron Beam Melting of Ti6Al4V Based on Computational Flow Patterns, Appl. Surf. Sci., 2017, 419, p 150–158.ArticleCASADSGoogle Scholar
W.-I. Cho, S.-J. Na, C. Thomy, and F. Vollertsen, Numerical Simulation of Molten Pool Dynamics in High Power Disk Laser Welding, J. Mater. Process. Technol., 2012, 212, p 262–275.ArticleCASGoogle Scholar
W. Ma, J. Ning, L.-J. Zhang, and S.-J. Na, Regulation of Microstructures and Properties of Molybdenum-Silicon-Boron Alloy Subjected to Selective Laser Melting, J. Manuf. Process., 2021, 69, p 593–601.ArticleGoogle Scholar
S. Haeri, Y. Wang, O. Ghita, and J. Sun, Discrete Element Simulation and Experimental Study of Powder Spreading Process in Additive Manufacturing, Powder Technol., 2016, 306, p 45–54.ArticleGoogle Scholar
D. Yao, X. Liu, J. Wang, W. Fan, M. Li, H. Fu, H. Zhang, X. Yang, Q. Zou, and X. An, Numerical Insights on the Spreading of Practical 316 L Stainless Steel Powder in SLM Additive Manufacturing, Powder Technol., 2021, 390, p 197–208.ArticleCASGoogle Scholar
S. Vock, B. Klöden, A. Kirchner, T. Weißgärber, and B. Kieback, Powders for Powder Bed Fusion: A Review, Prog. Addit. Manuf., 2019, 4, p 383–397.ArticleGoogle Scholar
X. Luo, C. Yang, Z.Q. Fu, L.H. Liu, H.Z. Lu, H.W. Ma, Z. Wang, D.D. Li, L.C. Zhang, and Y.Y. Li, Achieving Ultrahigh-Strength in Beta-Type Titanium Alloy by Controlling the Melt Pool Mode in Selective Laser Melting, Mater. Sci. Eng. A, 2021, 823, p 141731.ArticleCASGoogle Scholar
J. Braun, L. Kaserer, J. Stajkovic, K.-H. Leitz, B. Tabernig, P. Singer, P. Leibenguth, C. Gspan, H. Kestler, and G. Leichtfried, Molybdenum and Tungsten Manufactured by Selective Laser Melting: Analysis of Defect Structure and Solidification Mechanisms, Int. J. Refract. Met. Hard Mater., 2019, 84, p 104999.ArticleCASGoogle Scholar
L. Kaserera, J. Brauna, J. Stajkovica, K.-H. Leitzb, B. Tabernigb, P. Singerb, I. Letofsky-Papstc, H. Kestlerb, and G. Leichtfried, Fully Dense and Crack Free Molybdenum Manufactured by Selective Laser Melting Through Alloying with Carbon, Int. J. Refract Metal Hard Mater., 2019, 84, p 105000.ArticleGoogle Scholar
적층 제조는 바이메탈 및 다중 재료 구조의 제작 가능성을 제공합니다. 그러나 재료 호환성과 접착성은 부품의 성형성과 최종 품질에 직접적인 영향을 미칩니다. 적합한 프로세스를 기반으로 다양한 재료 조합의 기본 인쇄 가능성을 이해하는 것이 중요합니다.
여기에서는 두 가지 일반적이고 매력적인 재료 조합(니켈 및 철 기반 합금)의 인쇄 적성 차이가 레이저 지향 에너지 증착(DED)을 통해 거시적 및 미시적 수준에서 평가됩니다.
증착 프로세스는 현장 고속 이미징을 사용하여 캡처되었으며, 용융 풀 특징 및 트랙 형태의 차이점은 특정 프로세스 창 내에서 정량적으로 조사되었습니다. 더욱이, 다양한 재료 쌍으로 처리된 트랙과 블록의 미세 구조 다양성이 비교적 정교해졌고, 유익한 다중 물리 모델링을 통해 이종 재료 쌍 사이에 제시된 기계적 특성(미세 경도)의 불균일성이 합리화되었습니다.
재료 쌍의 서로 다른 열물리적 특성에 의해 유발된 용융 흐름의 차이와 응고 중 결과적인 요소 혼합 및 국부적인 재합금은 재료 조합 간의 인쇄 적성에 나타난 차이점을 지배합니다.
이 작업은 서로 다른 재료의 증착에서 현상학적 차이에 대한 심층적인 이해를 제공하고 바이메탈 부품의 보다 안정적인 DED 성형을 안내하는 것을 목표로 합니다.
Additive manufacturing provides achievability for the fabrication of bimetallic and multi-material structures; however, the material compatibility and bondability directly affect the parts’ formability and final quality. It is essential to understand the underlying printability of different material combinations based on an adapted process. Here, the printability disparities of two common and attractive material combinations (nickel- and iron-based alloys) are evaluated at the macro and micro levels via laser directed energy deposition (DED). The deposition processes were captured using in situ high-speed imaging, and the dissimilarities in melt pool features and track morphology were quantitatively investigated within specific process windows. Moreover, the microstructure diversity of the tracks and blocks processed with varied material pairs was comparatively elaborated and, complemented with the informative multi-physics modeling, the presented non-uniformity in mechanical properties (microhardness) among the heterogeneous material pairs was rationalized. The differences in melt flow induced by the unlike thermophysical properties of the material pairs and the resulting element intermixing and localized re-alloying during solidification dominate the presented dissimilarity in printability among the material combinations. This work provides an in-depth understanding of the phenomenological differences in the deposition of dissimilar materials and aims to guide more reliable DED forming of bimetallic parts.
Figure 1. Experimental setup and materials. (a) Schematic of the DED process, where three types of base materials were adopted—B1
(IN718), B2 (IN625), and B3 (SS316L), and two types of powder materials were adopted—P1 (IN718) and P2 (SS316L). (b) In situ
high-speed imaging of powder flow and the SEM images of IN718 and SS316L powder particle. (c) Powder size statistics, and (d) element
composition of powder IN718 (P1) and SS316L (P2).Figure 2. Deposition process and the track morphology. (a)–(c) Display the in situ captured tableaux of melt propagation and some physical
features during depositing for P1B1, P1B2, and P1B3, respectively. (d) The profiles of the melt pool at a frame of (t0 + 1) ms, and the flow
streamlines in the molten pool of each case. (e) The outer surface of the formed tracks, in which the colored arrows mark the scanning
direction. (f) Cross-section of the tracks. The parameter set used for in situ imaging was P-1000 W, S-600 mm·min–1, F-18 g·min–1. All the
scale bars are 2 mm.
References
[1] Tan C L, Weng F, Sui S, Chew Y and Bi G J 2021 Progress and perspectives in laser additive manufacturing of key aeroengine materials Int. J. Mach. Tools Manuf. 170 103804 [2] Bandyopadhyay A, Traxel K D, Lang M, Juhasz M, Eliaz N and Bose S 2022 Alloy design via additive manufacturing: advantages, challenges, applications and perspectives Mater. Today 52 207–24 [3] Sui S, Chew Y, Weng F, Tan C L, Du Z L and Bi G J 2022 Study of the intrinsic mechanisms of nickel additive for grain refinement and strength enhancement of laser aided additively manufactured Ti–6Al–4V Int. J. Extrem. Manuf. 4 035102 [4] Xue P S, Zhu L D, Xu P H, Ren Y, Xin B, Meng G R, Yang Z C and Liu Z 2021 Research on process optimization and microstructure of CrCoNi medium-entropy alloy formed by laser metal deposition Opt. Laser Technol. 142 107167 [5] Bandyopadhyay A, Traxel K D and Bose S 2021 Nature-inspired materials and structures using 3D printing Mater. Sci. Eng. R 145 100609 [6] Zuback J S, Palmer T A and DebRoy T 2019 Additive manufacturing of functionally graded transition joints between ferritic and austenitic alloys J. Alloys Compd. 770 995–1003 [7] Feenstra D R, Banerjee R, Fraser H L, Huang A, Molotnikov A and Birbilis N 2021 Critical review of the state of the art in multi-material fabrication via directed energy deposition Curr. Opin. Solid State Mater. Sci. 25 100924 [8] Wei C, Zhang Z Z, Cheng D X, Sun Z, Zhu M H and Li L 2021 An overview of laser-based multiple metallic material additive manufacturing: from macro- to micro-scales Int. J. Extrem. Manuf. 3 012003 [9] Gu D D, Shi X Y, Poprawe R, Bourell D L, Setchi R and Zhu J H 2021 Material-structure-performance integrated laser-metal additive manufacturing Science 372 eabg1487 [10] Bandyopadhyay A and Heer B 2018 Additive manufacturing of multi-material structures Mater. Sci. Eng. R 129 1–16 [11] Tammas-Williams S and Todd I 2017 Design for additive manufacturing with site-specific properties in metals and alloys Scr. Mater. 135 105–10 [12] Chen W, Gu D D, Yang J K, Yang Q, Chen J and Shen X F 2022 Compressive mechanical properties and shape memory effect of NiTi gradient lattice structures fabricated by laser powder bed fusion Int. J. Extrem. Manuf. 4 045002 [13] Svetlizky D, Das M, Zheng B L, Vyatskikh A L, Bose S, Bandyopadhyay A, Schoenung J M, Lavernia E J and Eliaz N 2021 Directed energy deposition (DED) additive manufacturing: physical characteristics, defects, challenges and applications Mater. Today 49 271–95 [14] Panwisawas C, Tang Y T and Reed R C 2020 Metal 3D printing as a disruptive technology for superalloys Nat. Commun. 11 2327 [15] Wang S H, Ning J S, Zhu L D, Yang Z C, Yan W T, Dun Y C, Xue P S, Xu P H, Bose S and Bandyopadhyay A 2022 Role of porosity defects in metal 3D printing: formation mechanisms, impacts on properties and mitigation strategies Mater. Today 59 133–60 [16] DebRoy T, Mukherjee T, Milewski J O, Elmer J W, Ribic B, Blecher J J and Zhang W 2019 Scientific, technological and economic issues in metal printing and their solutions Nat. Mater. 18 1026–32 [17] Afrouzian A, Groden C J, Field D P, Bose S and Bandyopadhyay A 2022 Additive manufacturing of Ti-Ni bimetallic structures Mater. Des. 215 110461 [18] Bandyopadhyay A, Zhang Y N and Onuike B 2022 Additive manufacturing of bimetallic structures Virtual Phys. Prototyp. 17 256–94 [19] Onuike B, Heer B and Bandyopadhyay A 2018 Additive manufacturing of Inconel 718—copper alloy bimetallic structure using laser engineered net shaping (LENSTM) Addit. Manuf. 21 133–40 [20] Sahasrabudhe H, Harrison R, Carpenter C and Bandyopadhyay A 2015 Stainless steel to titanium bimetallic structure using LENSTM Addit. Manuf. 5 1–8 [21] Li B Y, Han C J, Lim C W J and Zhou K 2022 Interface formation and deformation behaviors of an additively manufactured nickel-aluminum-bronze/15-5 PH multimaterial via laser-powder directed energy deposition Mater. Sci. Eng. A 829 142101 [22] Zhang X C, Pan T, Chen Y T, Li L, Zhang Y L and Liou F 2021 Additive manufacturing of copper-stainless steel hybrid components using laser-aided directed energy deposition J. Mater. Sci. Technol. 80 100–16 [23] Shinjo J and Panwisawas C 2022 Chemical species mixing during direct energy deposition of bimetallic systems using titanium and dissimilar refractory metals for repair and biomedical applications Addit. Manuf. 51 102654 [24] Wang D et al 2022 Recent progress on additive manufacturing of multi-material structures with laser powder bed fusion Virtual Phys. Prototyp. 17 329–65 [25] Lin X, Yue T M, Yang H O and Huang W D 2005 Laser rapid forming of SS316L/Rene88DT graded material Mater. Sci. Eng. A 391 325–36 [26] Melzer D, Dˇzugan J, Koukolíková M, Rzepa S and Vavˇrík J 2021 Structural integrity and mechanical properties of the functionally graded material based on 316L/IN718 processed by DED technology Mater. Sci. Eng. A 811 141038 [27] Melzer D, Dˇzugan J, Koukolíková M, Rzepa S, Dlouh´y J, Brázda M and Bucki T 2022 Fracture characterisation of vertically build functionally graded 316L stainless steel with Inconel 718 deposited by directed energy deposition process Virtual Phys. Prototyp. 17 821–40 [28] Zhang Y N and Bandyopadhyay A 2018 Direct fabrication of compositionally graded Ti-Al2O3 multi-material structures using laser engineered net shaping Addit. Manuf. 21 104–11 [29] Ben-Artzy A, Reichardt A, Borgonia P J, Dillon R P, McEnerney B, Shapiro A A and Hosemann P 2021 Compositionally graded SS316 to C300 maraging steel using additive manufacturing Mater. Des. 201 109500 [30] Tan C L, Liu Y C, Weng F, Ng F L, Su J L, Xu Z K, Ngai X D and Chew Y 2022 Additive manufacturing of voxelized heterostructured materials with hierarchical phases Addit. Manuf. 54 102775 [31] Chen J, Yang Y Q, Song C H, Zhang M K, Wu S B and Wang D 2019 Interfacial microstructure and mechanical properties of 316L/CuSn10 multi-material bimetallic structure fabricated by selective laser melting Mater. Sci. Eng. A 752 75–85 [32] Wei C, Gu H, Gu Y C, Liu L C, Huang Y H, Cheng D X, Li Z Q and Li L 2022 Abnormal interfacial bonding mechanisms of multi-material additive-manufactured tungsten–stainless steel sandwich structure Int. J. Extrem. Manuf. 4 025002 [33] Zhang Y N and Bandyopadhyay A 2021 Influence of compositionally graded interface on microstructure and compressive deformation of 316L stainless steel to Al12Si aluminum alloy bimetallic structures ACS Appl. Mater. Interfaces 13 9174–85 [34] Wei C et al 2022 Cu10Sn to Ti6Al4V bonding mechanisms in laser-based powder bed fusion multiple material additive 15 Int. J. Extrem. Manuf. 6 (2024) 025001 J Ning et al manufacturing with different build strategies Addit. Manuf. 51 102588 [35] Li W, Karnati S, Kriewall C, Liou F, Newkirk J, Brown Taminger K M and Seufzer W J 2017 Fabrication and characterization of a functionally graded material from Ti-6Al-4V to SS316 by laser metal deposition Addit. Manuf. 14 95–104 [36] Shi Q M, Zhong G Y, Sun Y, Politis C and Yang S F 2021 Effects of laser melting+remelting on interfacial macrosegregation and resulting microstructure and microhardness of laser additive manufactured H13/IN625 bimetals J. Manuf. Process. 71 345–55 [37] Zhang W X, Hou W Y, Deike L and Arnold C 2022 Understanding the Rayleigh instability in humping phenomenon during laser powder bed fusion process Int. J. Extrem. Manuf. 4 015201 [38] Chen Y W, Zhang X, Li M M, Xu R Q, Zhao C and Sun T 2020 Laser powder bed fusion of Inconel 718 on 316 stainless steel Addit. Manuf. 36 101500 [39] Yang Z C, Wang S H, Zhu L D, Ning J S, Xin B, Dun Y C and Yan W T 2022 Manipulating molten pool dynamics during metal 3D printing by ultrasound Appl. Phys. Rev. 9 021416 [40] Hofmann D C, Roberts S, Otis R, Kolodziejska J, Dillon R P, Suh J O, Shapiro A A, Liu Z K and Borgonia J P 2014 Developing gradient metal alloys through radial deposition additive manufacturing Sci. Rep. 4 5357 [41] Tumkur T U et al 2021 Nondiffractive beam shaping for enhanced optothermal control in metal additive manufacturing Sci. Adv. 7 eabg9358 [42] Scipioni Bertoli U, Guss G, Wu S, Matthews M J and Schoenung J M 2017 In-situ characterization of laser-powder interaction and cooling rates through high-speed imaging of powder bed fusion additive manufacturing Mater. Des. 135 385–96 [43] Siva Prasad H, Brueckner F and Kaplan A F H 2020 Powder incorporation and spatter formation in high deposition rate blown powder directed energy deposition Addit. Manuf. 35 101413 [44] Ebrahimi A, Kleijn C R and Richardson I M 2021 Numerical study of molten metal melt pool behaviour during conduction-mode laser spot melting J. Appl. Phys. 54 105304 [45] Mumtaz K A and Hopkinson N 2010 Selective laser melting of thin wall parts using pulse shaping J. Mater. Process. Technol. 210 279–87 [46] Sikandar Iquebal A, Yadav A, Botcha B, Krishna Gorthi R and Bukkapatnam S 2022 Tracking and quantifying spatter characteristics in a laser directed energy deposition process using Kalman filter Manuf. Lett. 33 692–700 [47] Criales L E, Arısoy Y M, Lane B, Moylan S, Donmez A and Özel T 2017 Laser powder bed fusion of nickel alloy 625: experimental investigations of effects of process parameters on melt pool size and shape with spatter analysis Int. J. Mach. Tools Manuf. 121 22–36 [48] Coen V, Goossens L and van Hooreweder B 2022 Methodology and experimental validation of analytical melt pool models for laser powder bed fusion J. Mater. Process. Technol. 304 117547 [49] Zhao C, Shi B, Chen S L, Du D, Sun T, Simonds B J, Fezzaa K and Rollett A D 2022 Laser melting modes in metal powder bed fusion additive manufacturing Rev. Mod. Phys. 94 045002 [50] Wang J H, Han F Z, Chen S F and Ying W S 2019 A novel model of laser energy attenuation by powder particles for laser solid forming Int. J. Mach. Tools Manuf. 145 103440 [51] Haley J C, Schoenung J M and Lavernia E J 2018 Observations of particle-melt pool impact events in directed energy deposition Addit. Manuf. 22 368–74 [52] Chen Y H et al 2021 Correlative synchrotron x-ray imaging and diffraction of directed energy deposition additive manufacturing Acta Mater. 209 116777 [53] Khorasani M, Ghasemi A, Leary M, Cordova L, Sharabian E, Farabi E, Gibson I, Brandt M and Rolfe B 2022 A comprehensive study on meltpool depth in laser-based powder bed fusion of Inconel 718 Int. J. Adv. Manuf. Technol. 120 2345–62 [54] Shamsaei N, Yadollahi A, Bian L and Thompson S M 2015 An overview of direct laser deposition for additive manufacturing; part II: mechanical behavior, process parameter optimization and control Addit. Manuf. 8 12–35 [55] Ghanavati R, Naffakh-Moosavy H, Moradi M and Eshraghi M 2022 Printability and microstructure of directed energy deposited SS316l-IN718 multi-material: numerical modeling and experimental analysis Sci. Rep. 12 16600 [56] Galbusera F, Demir A G, Platl J, Turk C, Schnitzer R and Previtali B 2022 Processability and cracking behaviour of novel high-alloyed tool steels processed by laser powder bed fusion J. Mater. Process. Technol. 302 117435 [57] Wang A et al 2023 Effects of processing parameters on pore defects in blue laser directed energy deposition of aluminum by in and ex situ observation J. Mater. Process. Technol. 319 118068 [58] Hinojos A, Mireles J, Reichardt A, Frigola P, Hosemann P, Murr L E and Wicker R B 2016 Joining of Inconel 718 and 316 stainless steel using electron beam melting additive manufacturing technology Mater. Des. 94 17–27 [59] Yang Z C, Zhu L D, Wang S H, Ning J S, Dun Y C, Meng G R, Xue P S, Xu P H and Xin B 2021 Effects of ultrasound on multilayer forming mechanism of Inconel 718 in directed energy deposition Addit. Manuf. 48 102462 [60] Yao L M, Huang S, Ramamurty U and Xiao Z M 2021 On the formation of “Fish-scale” morphology with curved grain interfacial microstructures during selective laser melting of dissimilar alloys Acta Mater. 220 117331 [61] Ghanavati R, Naffakh-Moosavy H and Moradi M 2021 Additive manufacturing of thin-walled SS316L-IN718 functionally graded materials by direct laser metal deposition J. Mater. Res. Technol. 15 2673–85 [62] Chen N N, Khan H A, Wan Z X, Lippert J, Sun H, Shang S L, Liu Z K and Li J J 2020 Microstructural characteristics and crack formation in additively manufactured bimetal material of 316L stainless steel and Inconel 625 Addit. Manuf. 32 101037 [63] Xiao Y H, Wan Z X, Liu P W, Wang Z, Li J J and Chen L 2022 Quantitative simulations of grain nucleation and growth at additively manufactured bimetallic interfaces of SS316L and IN625 J. Mater. Process. Technol. 302 117506 [64] Mukherjee T, DebRoy T, Lienert T J, Maloy S A and Hosemann P 2021 Spatial and temporal variation of hardness of a printed steel part Acta Mater. 209 116775 [65] Dinda G P, Dasgupta A K and Mazumder J 2021 Texture control during laser deposition of nickel-based superalloy Scr. Mater. 67 503–6 [66] Tan Z E, Pang J H L, Kaminski J and Pepin H 2019 Characterisation of porosity, density, and microstructure of directed energy deposited stainless steel AISI 316L Addit. Manuf. 25 286–96 [67] Wolff S J, Gan Z T, Lin S, Bennett J L, Yan W T, Hyatt G, Ehmann K F, Wagner G J, Liu W K and Cao J 2019 Experimentally validated predictions of thermal history and microhardness in laser-deposited Inconel 718 on carbon steel Addit. Manuf. 27 540–51 16 Int. J. Extrem. Manuf. 6 (2024) 025001 J Ning et al [68] Zhang L, Wen M, Imade M, Fukuyama S and Yokogawa K 2008 Effect of nickel equivalent on hydrogen gas embrittlement of austenitic stainless steels based on type 316 at low temperatures Acta Mater. 56 3414–21 [69] Zuback J S and DebRoy T 2018 The hardness of additively manufactured alloys Materials 11 2070 [70] Adomako N K, Lewandowski J J, Arkhurst B M, Choi H, Chang H J and Kim J H 2022 Microstructures and mechanical properties of multi-layered materials composed of Ti-6Al-4V, vanadium, and 17–4PH stainless steel produced by directed energy deposition Addit. Manuf. 59 103174
Solute segregation significantly affects material properties and is a critical issue in the laser powder-bed fusion (LPBF) additive manufacturing (AM) of Ni-based superalloys. To the best of our knowledge, this is the first study to demonstrate a computational thermal-fluid dynamics (CtFD) simulation coupled multi-phase-field (MPF) simulation with a multicomponent-composition model of Ni-based superalloy to predict solute segregation under solidification conditions in LPBF. The MPF simulation of the Hastelloy-X superalloy reproduced the experimentally observed submicron-sized cell structure. Significant solute segregations were formed within interdendritic regions during solidification at high cooling rates of up to 108 K s-1, a characteristic feature of LPBF. Solute segregation caused a decrease in the solidus temperature (TS), with a reduction of up to 30.4 K, which increases the risk of liquation cracks during LPBF. In addition, the segregation triggers the formation of carbide phases, which increases the susceptibility to ductility dip cracking. Conversely, we found that the decrease in TS is suppressed at the melt-pool boundary regions, where re-remelting occurs during the stacking of the layer above. Controlling the re-remelting behavior is deemed to be crucial for designing crack-free alloys. Thus, we demonstrated that solute segregation at the various interfacial regions of Ni-based multicomponent alloys can be predicted by the conventional MPF simulation. The design of crack-free Ni-based superalloys can be expedited by MPF simulations of a broad range of element combinations and their concentrations in multicomponent Ni-based superalloys.
Additive manufacturing (AM) technologies have attracted considerable attention as they allow us to easily build three-dimensional (3D) parts with complex geometries. Among the wide range of available AM techniques, laser powder-bed fusion (LPBF) has emerged as a preferred technique for metal AM [1], [2], [3], [4], [5]. In LPBF, metal products are built layer-by-layer by scanning laser, which fuse metal powder particles into bulk solids.
Significant attempts have been made to integrate LPBF techniques within the aerospace industry, with a particular focus on weldable Ni-based superalloys, such as IN718 [6], [7], [8], IN625 [9], [10], and Hastelloy-X (HX) [11], [12], [13], [14]. Non-weldable alloys, such as IN738LC [15], [16] and CMSX-4 [1], [17] are also suitable for their sufficient creep resistance under higher temperature conditions. However, non-weldable alloys are difficult to build using LPBF because of their susceptibility to cracking during the process. In general, a macro solute-segregation during solidification is suppressed by the rapid cooling conditions (up to 108 K s-1) unique to the LPBF process [18]. However, the solute segregation still occurs in the interdendritic regions that are smaller than the micrometer scale [5], [19], [20], [21]; these regions are suggested to be related to the hot cracks in LPBF-fabricated parts. Therefore, an understanding of solute segregation is essential for the fabrication of reliable LPBF-fabricated parts while avoiding cracks.
The multiphase-field (MPF) method has gained popularity for modeling the microstructure evolution and solute segregation under rapid cooling conditions [5], [20], [21], [22], [23], [24], [25], [26], [27], [28]. Moreover, quantifiable predictions have been achieved by combining the MPF method with temperature distribution analysis methods such as the finite-element method (FEM) [20] and computational thermal-fluid dynamics (CtFD) simulations [28]. These aforementioned studies have used binary-approximated multicomponent systems, such as Ni–Nb binary alloys, to simulate IN718 alloys. While MPF simulations using binary alloy systems can effectively reproduce microstructure formations and segregation behaviors, the binary approximation might be affected by the chemical interactions between the removed solute elements in the target multicomponent alloy. The limit of absolute stability predicted by the Mullins-Sekerka theory [29] is also crucial because the limit velocity is close to the solidification rate in the LPBF process and is different in multicomponent and binary-approximated systems. The difference between the solidus and liquidus temperatures, ΔT0, directly determines the absolute stability according to the Mullins-Sekerka theory. For example, the ΔT0 values of IN718 and its binary-approximated Ni–5 wt.%Nb alloy are 134 K [28] and 71 K [30], respectively. The solidification rate compared to the limit of absolute stability, i.e., the relative non-equilibrium of solidification, changes by simplification of the system. It is therefore important to use the composition of the actual multicomponent system in such simulations. However, to the best of our knowledge, there is no MPF simulation using a multicomponent model coupled with a temperature analysis simulation to predict solute segregation in a Ni-based superalloy.
In this study, we demonstrate that the conventional MPF model can reproduce experimentally observed dendritic structures by performing a phase-field simulation using the temperature distribution obtained by a CtFD simulation of a multicomponent Ni-based alloy (conventional solid-solution hardening-type HX). The MPF simulation revealed that the segregation behavior of solute elements largely depends on the regions of the melt pool, such as the cell boundary, the interior of the melt-pool boundary, and heat-affected regions. The sensitivities of the various interfaces to liquation and solidification cracks are compared based on the predicted concentration distributions. Moreover, the feasibility of using the conventional MPF model for LPBF is discussed in terms of the absolute stability limit.
2. Methods
2.1. Laser-beam irradiation experiments
Rolled and recrystallized HX ingots with dimensions of 20 × 50 × 10 mm were used as the specimens for laser-irradiation experiments. The specimens were irradiated with a laser beam scanned along straight lines of 10 mm in length using a laser AM machine (EOS 290 M, EOS) equipped with a 400 W Yb-fiber laser. Irradiation was performed with a beam power of P = 300 W and a scanning speed of V = 600 mm s-1, which are the conditions generally used in the LPBF fabrication of Ni-based superalloy [8]. The corresponding line energy was 0.5 J mm-1. The samples were cut perpendicular to the beam-scanning direction for cross-sectional observation using a field-emission scanning electron microscope (FE-SEM, JEOL JSM 6500). Crystal orientation analysis was performed by electron backscatter diffraction (EBSD). The sizes of each crystal grain and their aspect ratios were evaluated by analyzing the EBSD data.
2.2. CtFD simulation
CtFD simulations of the laser-beam irradiation of HX were performed using a 3D thermo-fluid analysis software (Flow Science FLOW-3D® with Flow-3D Weld module). A Gaussian heat source model was used, in which the irradiation intensity distribution of the beam is regarded as a symmetrical Gaussian distribution over the entire beam. The distribution of the beam irradiation intensity is expressed by the following equation.(1)q̇=2ηPπR2exp−2r2R2.
Here, P is the power, R is the effective beam radius, r is the actual beam radius, and η is the beam absorption rate of the substrate. To improve the accuracy of the model, η was calculated by assuming multiple reflections using the Fresnel equation:(2)�=1−121+1−�cos�21+1+�cos�2+�2−2�cos�+2cos2��2+2�cos�+2cos2�.
ε is the Fresnel coefficient and θ is the incident angle of the laser. A local laser melt causes the vaporization of the material and results in a high vapor pressure. This vapor pressure acts as a recoil pressure on the surface, pushing the weld pool down. The recoil pressure is reproduced using the following equation.(3)precoil=Ap0exp∆HLVRTV1−TVT.
Here, p0 is the atmospheric pressure, ∆HLV is the latent heat of vaporization, R is the gas constant, and TV is the boiling point at the saturated vapor pressure. A is a ratio coefficient that is generally assumed to be 0.54, indicating that the recoil pressure due to evaporation is 54% of the vapor pressure at equilibrium on the liquid surface.
Table 1 shows the parameters used in the simulations. Most parameters were evaluated using an alloy physical property calculation software (Sente software JMatPro v11). The values in a previously published study [31] were used for the emissivity and the Stefan–Boltzmann constant, and the values for pure Ni [32] were used for the heat of vaporization and vaporization temperatures. The Fresnel coefficient, which determines the beam absorption efficiency, was used as a fitting parameter to reproduce the morphology of the experimentally observed melt region, and a Fresnel coefficient of 0.12 was used in this study.
The dimensions of the computational domain of the numerical model were 4.0 mm in the beam-scanning direction, 0.4 mm in width, and 0.3 mm in height. A uniform mesh size of 10 μm was applied throughout the computational domain. The boundary condition of continuity was applied to all boundaries except for the top surface. The temperature was initially set to 300 K. P and V were set to their experimental values, i.e., 300 W and 600 mm s-1, respectively. Solidification conditions based on the temperature gradient, G, the solidification rate, R, and the cooling rate were evaluated, and the obtained temperature distribution was used in the MPF simulations.
2.3. MPF simulation
Two-dimensional MPF simulations weakly coupled with the CtFD simulation were performed using the Microstructure Evolution Simulation Software (MICRESS) [33], [34], [35], [36], [37] with the TQ-Interface for Thermo-Calc [38]. A simplified HX alloy composition of Ni-21.4Cr-17.6Fe-0.46Mn-8.80Mo-0.39Si-0.50W-1.10Co-0.08 C (mass %) was used in this study. The Gibbs free energy and diffusion coefficient of the system were calculated using the TCNI9 thermodynamic database [39] and the MOBNi5 mobility database [40]. Τhe equilibrium phase diagram calculated using Thermo-Calc indicates that the face-centered cubic (FCC) and σ phases appear as the equilibrium solid phases [19]. However, according to the time-temperature-transformation (TTT) diagram [41], the phases are formed after the sample is maintained for tens of hours in a temperature range of 1073 to 1173 K. Therefore, only the liquid and FCC phases were assumed to appear in the MPF simulations. The simulation domain was 5 × 100 μm, and the grid size Δx and interface width were set to 0.025 and 0.1 µm, respectively. The interfacial mobility between the solid and liquid phases was set to 1.0 × 10⁻⁸ m4 J-1 s-1. Initially, one crystalline nucleus with a [100] crystal orientation was placed at the left bottom of the simulation domain, with the liquid phase occupying the remainder of the domain. The model was solidified under the temperature field distribution obtained by the CtFD simulation. The concentration distribution and crystal orientation of the solidified model were examined. The primary dendrite arm space (PDAS) was compared to the experimental PDAS measured by the cross-sectional SEM observation.
In an actual LPBF process, solidified layers are remelted and resolidified during the stacking of the one layer above, thereby greatly affecting solute element distributions in those regions. Therefore, remelting and resolidification simulations were performed to examine the effect of remelting on solute segregation. The solidified model was remelted and resolidified by applying a time-dependent temperature field shifted by 60 μm in the height direction, assuming reheating during the stacking of the upper layer (i.e., the upper 40 μm region of the simulation box was remelted and resolidified). The changes in the composition distribution and formed microstructure were investigated.
3. Results
3.1. Experimental observation of melt pool
Fig. 1 shows a cross-sectional optical microscopy image and corresponding inverse pole figure (IPF) orientation maps obtained from the laser-melted region of HX. The dashed line indicates the fusion line. A deep melted region was formed by keyhole-mode melting due to the vaporization of the metal and resultant recoil pressure. Epitaxial growth from the unmelted region was observed. Columnar crystal grains with an average diameter of 5.46 ± 0.32 μm and an aspect ratio of 3.61 ± 0.13 appeared at the melt regions (Figs. 1b–1d). In addition, crystal grains growing in the z direction could be observed in the lower center.
Fig. 2a shows a cross-sectional backscattering electron image (BEI) obtained from the laser-melted region indicated by the black square in Fig. 1a. The bright particles with a diameter of approximately 2 μm observed outside the melt pool. It is well known that M6C, M23C6, σ, and μ precipitate phases are formed in Hastelloy-X [41]. These precipitates mainly consisted of Mo, Cr, Fe, and Ni; The μ and M6C phases are rich in Mo, while the σ and M23C6 phases are rich in Cr. The SEM energy dispersive X-ray spectroscopy analysis suggested that the bright particles are the stable precipitates as shown in Fig. S2 and Table S1. Conversely, there are no carbides in the melt pool. This suggests that the cooling rate is extremely high during LPBF, which prevents the formation of a stable carbide during solidification. Figs. 2b–2f show magnified BEI images at different height positions indicated in Fig. 2a. Bright regions are observed between the cells, which become fragmentary at the center of the melt pool, as indicated by the yellow arrow heads in Figs. 2e and 2f.
3.2. CtFD simulation
Figs. 3a–3c show snapshots of the CtFD simulation of HX at 2.72 ms, with the temperature indicated in color. A melt pool with an elongated teardrop shape formed and keyhole-mode melting was observed at the front of the melt region. The cooling rate, temperature gradient (G), and solidification rate (R) were evaluated from the temporal change in the temperature distribution of the CtFD simulation results. The z-position of the solid/liquid interface during the melting and solidification processes is shown in Fig. 3d. The interface goes down rapidly during melting and then rises during solidification. The MPF simulation of the microstructure formation during solidification was performed using the temperature distribution. Moreover, the microstructure formation process during the fabrication of the upper layer was investigated by remelting and resolidifying the solidified layer using the same temperature distribution with a 60 μm upward shift, corresponding to the layer thickness commonly used in the LPBF of Ni-based superalloys.
Figs. 4a–4c show the changes in the cooling rate, temperature gradient, and solidification rate in the center line of the melt pool parallel to the z direction. To output the solidification conditions at the solid/liquid interface in the melt pool, only the data of the mesh where the solid phase ratio was close to 0.5 were plotted. Solidification occurred where the cooling rate was in the range of 2.1 × 10⁵–1.6 × 10⁶ K s-1, G was in the range of 3.6 × 10⁵–1.9 × 10⁷ K m-1, and R was in the range of 8.2 × 10⁻²–6.3 × 10⁻¹ m s-1. The cooling rate was the highest near the fusion line and decreased as the interface approached the center of the melt region (Fig. 4a). G also exhibited the highest value in the regions near the fusion line and decreased throughout the solid/liquid interface toward the center of the melt pool (Fig. 4b). R had the lowest value near the fusion line and increased as the interface approached the center of the melt region (Fig. 4c).
3.3. MPF simulations coupled with CtFD simulation
MPF simulations of solidification, remelting, and resolidification were performed using the temperature-time distribution obtained by the CtFD simulation. Fig. 5 shows the MPF solidified models colored by phase and Mo concentration. All the computational domains show the FCC phase after the solidification (Fig. 5a). Dendrites grew parallel to the heat flow direction, and solute segregations were observed in the interdendritic regions. At the bottom of the melt pool (Fig. 5d), planar interface growth occurred before the formation of primary dendrites. The bottom of the melt pool is the turning point of the solid/liquid interface from the downward motion in melting to the upward motion in solidification. Thus, the solidification rate at the boundary is zero, and is extremely low immediately above the molt-pool boundary. Here, the lower limit of the solidification rate (R) for dendritic growth can be represented by the constitutional supercooling criterion [29], Vcs = (G × DL) / ΔT, and planar interface growth occurs at R < Vcs. DL and ΔT denote the diffusion coefficient in the liquid and the equilibrium freezing range, respectively. The results suggest that planar interface growth occurs at the bottom of the melt pool, resulting in a dark region with a different solute element distribution. Some of the primary dendrites were diminished by competition with other dendrites. In addition, secondary dendrite arms could be seen in the upper regions (Fig. 5c), where solidification occurred at a lower cooling rate. The fragmentation of the solute segregation near the secondary dendrite arms is similar to that observed in the experimental melt pool shown in Figs. 2e and 2f, and the secondary dendrite arms are suggested to have appeared at the center of the melt region. Fig. 6 shows the PDASs measured from the MPF simulation models, compared to the experimental PDASs measured by the cross-sectional SEM observation of the laser-melted regions (Fig. 2). The PDAS obtained by the MPF simulation become larger as the solidification progress. Ghosh et al. [21] evident by the phase-field method that the PDAS decreases as the cooling rate increases under the rapid cooling conditions obtained by the finite element analysis. In this study, the cooling rate was decreased as the interface approached the center of the melt region (Fig. 4a), and the trends in PDAS changes with respect to cooling rate is same as the reported trend [21]. The simulated trends of the PDAS with the position in the melt pool agreed well with the experimental trends. However, all PDASs in the simulation were larger than those observed in the experiment at the same positions. Ode et al. [42] reported that PDAS differences between 2D and 3D MPF simulations can be represented by PDAS2D = 1.12 × PDAS3D owing to differences in the effects of the interfacial energy and diffusivity. We also performed 2D and 3D MPF simulations under the solidification conditions of G = 1.94 × 10⁷ K m-1 and R = 0.82 m s-1 (Fig. S1), and found that the PDAS from the 2D MPF simulation was 1.26 times larger than that from the 3D simulation. Therefore, the cell structure obtained by the CtFD simulation coupled with the 2D MPF simulation agreed well with the experimental results over the entire melt pool region considering the dimensional effects.
Fig. 7b1 and 7c1 show the concentration profiles of the solidified model along the growth direction indicated by dashed lines in Fig. 7a. The differences in concentrations from the alloy composition are also shown in Fig. 7b2 and 7c2. Cr, Mo, C, Mn, and W were segregated to the interdendritic regions, while Si, Fe, and Co were depressed. The solute segregation behavior agrees with the experimentally observation [43] and the prediction by the Scheil-Gulliver simulation [19]. Segregation occurred to the highest degree in Mo, while the ratio of segregation to the alloy composition was remarkable in C. The concentration fluctuations correlated with the position in the melt pool and decreased at the center of the melt pool, which was suggested to correspond to the lower cooling rate in this region. Conversely, droplets that appeared between secondary dendrite arms in the upper regions of the simulation domain exhibited a locally high segregation of solute elements, with the same amount of segregation as that at the bottom of the melt pool.
3.4. Remelting and resolidification simulation
The solidified model was subjected to remelting and resolidification conditions by shifting the temperature profile upward by 60 µm to reveal the effect of reheating on the solute segregation behavior. Figs. 8a and 8b shows the simulation domains of the HX model after resolidification, colored by phase and Mo concentration. The magnified MPF models during the resolidification of the regions indicated by rectangles in Figs. 8a and 8b are also shown as Figs. 8c and 8d. Dendrites grew from the bottom of the remelted region, with the segregation of solute elements occurring in the interdendritic regions. The entire domain become the FCC phase after the resolidification, as shown in Fig. 8a. The bottom of the remelted regions exhibited a different microstructure, and Mo was depressed at the remelted regions, rather than the interdendritic regions. The different solute segregation behavior [44] and the microstructure formation [45] at the melt pool boundary is also observed in LPBF manufactured 316 L stainless steel. We found that this microstructure was formed by further remelting during the resolidification process, which is shown in Fig. 9. Here, the solidified HX model was heated, and the interdendritic regions were preferentially melted while concentration fluctuations were maintained (Fig. 9a1 and 9a2). Subsequently, planer interface growth occurs near the melt pool boundary where the solidification rate is almost zero, and the dendrites outside of the boundary are grown epitaxially (Fig. 9b1 and 9b2). However, these remelted again because of the temperature rise (Fig. 9c1 and 9c2, and the temperature-time profile shown in Fig. 9e). The remelted regions then cooled and solidified with the abnormal solute segregations (Fig. 9d1 and 9d2). Then, dendrite grows from amplified fluctuations under the solidification rate larger than the criterion of constitutional supercooling (Fig. 9d1, 9d2, and Fig. 8d). It has been reported [46], [47] that temperature rising owning to latent heat affects microstructure formation: phase-field simulations of a Ni–Al binary alloy suggest that the release of latent heat during solidification increases the average temperature of the system [46] and strongly influences the solidification conditions [47]. In this study, the release of latent heat during solidification is considered in CtFD simulations for calculating the temperature distribution, and the temperature increase is suggested to have also occurred due to the release of latent heat.
Fig. 10b1 and 10c1 show the solute element concentration line profiles of the resolidified model along the growth direction indicated by dashed lines in Fig. 10a. Fig. 10b2 and 10c2 show the corresponding differences in concentration from the alloy composition. The segregation behavior of solute elements at the interdendritic regions (Fig. 10b1 and 10b2) was the same as that in the solidified model (Figs. 7b1 and 7b2). Here, Cr, Mo, C, Mn, and W were segregated to the interdendritic regions, while Si, Fe, and Co were depressed. However, the concentration fluctuations at the interdendritic regions were larger than those in the solidified model. Moreover, the segregation of the outside of the melt pool, i.e., the heat-affected zone, was remarkable throughout remelting and resolidification. Different segregation behaviors were observed in the re-remelted region: Mo, Si, Mn, and W were segregated, while Ni, Fe, and Co were depressed. These solute segregations caused by remelting are expected to heavily influence the crack behavior.
4. Discussion
4.1. Effect of segregation of solute elements on liquation cracking susceptibility
Strong solute segregation was observed between the interdendritic regions of the solidified alloy (Fig. 7). In addition, the solute segregation behavior was significantly affected by remelting and resolidification and varied across the alloy. Solute segregation can be categorized by the regions shown in Fig. 11a1–11a4, namely the cell boundary (Fig. 11a1), interior of the melt-pool boundary (Fig. 11a2), re-remelted regions (Fig. 11a3), and heat-affected regions (Fig. 11a4). The concentration profiles of these regions are shown in Fig. 11b1–11b4. Solute segregation was the highest in the cell boundary region. The solute segregation in the heat-affected region was almost the same as that in the cell boundary region, but seemed to have been attenuated by reheating during remelting and resolidification. The interior of the melt-pool boundary region also had the same tendency for solute segregation. However, the amount of Cr segregation was smaller than that of Mo. A decrease in the Cr concentration was also mitigated, and the concentration remained the same as that in the alloy composition. Fig. 11c1–11c4 show the chemical potentials of the solute elements for the FCC phase at 1073 K calculated using the compositions of those interfacial regions. All the interfacial regions showed non-constant chemical potentials for each element along the perpendicular direction, but the fluctuations of the chemical potentials differed by the type of interfaces. In particular, the fluctuation of the chemical potential of C at the cell boundary region was the largest, suggesting it can be relaxed easily by heat treatment. On the other hand, the fluctuations of the other elements in all the regions were small. The solute segregations are most likely to remain after the heat treatment and are supposed to affect the cracking susceptibilities.
The solidus temperatures TS, the difference between the liquidus and solidus temperatures (i.e., the brittle temperature range (BTR)), and the fractions of the equilibrium precipitate phases at 1073 K of the interfacial regions were calculated as the liquation, solidification, and ductility dip cracking susceptibilities, respectively. At the cell boundary (Fig. 12a1), interior of the melt-pool boundary (Fig. 12a1), and heat-affected regions (Fig. 12a1), the internal and interfacial regions exhibited higher and lower TS compared to that of the alloy composition, respectively. The lowest Ts was obtained with the composition at the cell boundary region, which is the largest solute-segregated region. It has been suggested that strong segregations of solute elements in LPBF lead to liquation cracks [16]. This study also supports this suggestion, and liquation cracks are more likely to occur at the interfacial regions indicated by predicting the solute segregation behavior using the MPF model. Additionally, the BTRs of the cell boundary, interior of the melt-pool boundary, and heat-affected regions were wider at the interdendritic regions, and solidification cracks were also likely to occur in these regions. Moreover, within the solute segregation regions, the fraction of the precipitate phases in these interfacial regions was larger than that calculated using the alloy composition (Fig. 12c1, 12c2, and 12c4). This indicates that ductility dip cracking is also likely to occur at the cell boundary, interior of the melt-pool boundary, and in heat-affected regions. Contrarily, we found that the re-remelted region exhibited a higher TS and smaller BTR even in the interfacial region (Fig. 12a3 and 12b3), where the solute segregation behavior was different from that of the other regions. In addition, the re-remelting region exhibited less precipitation compared with the other segregated regions (Fig. 12c3). The re-remelting caused by the latent heat can attenuate solute segregation, prevent Ts from decreasing, decrease the BTR, and decrease the amount of precipitate phases. Alloys with a large amount of latent heat are expected to increase the re-remelting region, thereby decreasing the susceptibility to liquation and ductility dip cracks due to solute element segregation. This can be a guide for designing alloys for the LPBF process. As mentioned in Section 3.4, the microstructure [45] and the solute segregation behavior [44] at the melt pool boundary of LPBF-manufactured 316 L stainless steel are observed, and they are different from that of the interdendritic regions. Experimental observations of the solute segregation behavior in the LPBF-fabricated Ni-based alloys are currently underway.
4.2. Applicability of the conventional MPF simulation to microstructure formation under LPBF
As the solidification growth rate increases, segregation coefficients approach 1, and the fluctuation of the solid/liquid interface is suppressed by the interfacial tension. The interface growth occurs in a flat fashion instead of having a cellular morphology at a velocity above the absolute stability limit, Ras, predicted by the Mullins-Sekerka theory [29]: Ras = (ΔT0DL) / (k Γ) where ΔT0, DL, k, and Γ are the difference between the liquidus and solidus temperatures, equilibrium segregation coefficient, the diffusivity of liquid, and the Gibbs-Thomson coefficient, respectively.
The Ras of HX was calculated using the equation and the thermodynamic parameters obtained by the TCNI9 thermodynamic database [39]. The calculated Ras of HX was 3.9 m s-1 and is ten times larger than that of the Ni–Nb alloy (approximately 0.4 m s-1) [20]. The HX alloy was solidified under R values in the range of 8.2 × 10⁻²–6.3 × 10⁻¹ m s-1. The theoretically calculated criterion is larger than the evaluated R, and is in agreement with the experiment in which dendritic growth is observed in the melt pool (Fig. 5). In contrast, Karayagiz et al. [20] reported that the R of the Ni–Nb binary alloy under LPBF was as high as approximately 2 m s-1, and planar interface growth was observed to be predominant under the high-growth-rate conditions. These experimentally observed microstructures agree well with the prediction by the Mullins-Sekerka theory about the relationship between the morphology and solidification rates.
In this study, the solidification microstructure formed by the laser-beam irradiation of an HX multicomponent Ni-based superalloy was reproduced by a conventional MPF simulation, in which the system was assumed to be in a quasi-equilibrium condition. Boussinot et al. [24] also suggested that the conventional phase-field model can be applied to simulate the microstructure of an IN718 multicomponent Ni-based superalloy in LPBF. In contrast, Kagayaski et al. [20] suggested that the conventional MPF simulation cannot be applied to the solidification of the Ni-Nb binary alloy system and that the finite interface dissipation model proposed by Steinbach et al. [48], [49] is necessary to simulate the high solidification rates observed in LPBF. The difference in the applicability of the conventional MPF method to HX and Ni–Nb binary alloys is presumed to arise from the differences in the non-equilibrium degree of these systems under the high solidification rates of LPBF. The results suggest that Ras can be used as a simple index to apply the conventional MPF model for solidification in LPBF. Solidification becomes a non-equilibrium process as the solidification rate approaches the limit of absolute stability, Ras. In this study, the solidification of the HX multicomponent system occurred under a relatively low solidification rate compared to Ras, and the microstructure of the conventional MPF model was successfully reproduced in the physical experiment. However, note that the limit of absolute stability predicted by the Mullins-Sekerka theory was originally proposed for solidification in a binary alloy system, and further investigation is required to consider its applicability to multicomponent alloy systems. Moreover, the fast solidification, such as in the LPBF process, causes segregation coefficient approaching a value of 1 [20], [21], [25] corresponds to a diffusion length that is on the order of the atomic interface thickness. When the segregation coefficient approaches 1, solute undercooling disappears; hence, there is no driving force to amplify fluctuations regardless of whether interfacial tension is present. This phenomenon should be further investigated in future studies.
5. Conclusions
We simulated solute segregation in a multicomponent HX alloy under the LPBF process by an MPF simulation using the temperature distributions obtained by a CtFD simulation. We set the parameters of the CtFD simulation to match the melt pool shape formed in the laser-irradiation experiment and found that solidification occurred under high cooling rates of up to 1.6 × 10⁶ K s-1.
MPF simulations using the temperature distributions from CtFD simulation could reproduce the experimentally observed PDAS and revealed that significant solute segregation occurred at the interdendritic regions. Equilibrium thermodynamic calculations using the alloy compositions of the segregated regions when considering crack sensitivities suggested a decrease in the solidus temperature and an increase in the amount of carbide precipitation, thereby increasing the susceptibility to liquation and ductility dip cracks in these regions. Notably, these changes were suppressed at the melt-pool boundary region, where re-remelting occurred during the stacking of the layer above. This effect can be used to achieve a novel in-process segregation attenuation.
Our study revealed that a conventional MPF simulation weakly coupled with a CtFD simulation can be used to study the solidification of multicomponent alloys in LPBF, contrary to the cases of binary alloys investigated in previous studies. We discussed the applicability of the conventional MPF model to the LPBF process in terms of the limit of absolute stability, Ras, and suggested that alloys with a high limit velocity, i.e., multicomponent alloys, can be simulated using the conventional MPF model even under the high solidification velocity conditions of LPBF.
The authors declare that they have no known competing financial interests or personal relationships that could have appeared to influence the work reported in this paper
Acknowledgments
This work was partly supported by the Cabinet Office, Government of Japan, Cross-ministerial Strategic Innovation Promotion Program (SIP), “Materials Integration for Revolutionary Design System of Structural Materials,” (funding agency: The Japan Science and Technology Agency), by JSPS KAKENHI Grant Numbers 21H05018 and 21H05193, and by CREST Nanomechanics: Elucidation of macroscale mechanical properties based on understanding nanoscale dynamics for innovative mechanical materials (Grant Number: JPMJCR2194) from the Japan Science and Technology Agency (JST). The authors would like to thank Mr. H. Kawabata and Mr. K. Kimura for their technical support with the sample preparations and laser beam irradiation experiments.
[1]M. Ramsperger, R.F. Singer, C. KörnerMicrostructure of the nickel-base superalloy CMSX-4 fabricated by selective electron beam meltingMetall. Mater. Trans. A Phys. Metall. Mater. Sci., 47 (2016), pp. 1469-1480, 10.1007/s11661-015-3300-y View at publisher This article is free to access.View in ScopusGoogle Scholar
[3]K. Hagihara, T. NakanoControl of anisotropic crystallographic texture in powder bed fusion additive manufacturing of metals and ceramics—A reviewJOM, 74 (2021), pp. 1760-1773, 10.1007/s11837-021-04966-7 View at publisher This article is free to access.Google Scholar
[6]N. Raghavan, R. Dehoff, S. Pannala, S. Simunovic, M. Kirka, J. Turner, N. Carlson, S.S. BabuNumerical modeling of heat-transfer and the influence of process parameters on tailoring the grain morphology of IN718 in electron beam additive manufacturingActa Mater, 112 (2016), pp. 303-314, 10.1016/j.actamat.2016.03.063View PDFView articleView in ScopusGoogle Scholar
[7]N. Raghavan, S. Simunovic, R. Dehoff, A. Plotkowski, J. Turner, M. Kirka, S. BabuLocalized melt-scan strategy for site specific control of grain size and primary dendrite arm spacing in electron beam additive manufacturingActa Mater, 140 (2017), pp. 375-387, 10.1016/j.actamat.2017.08.038View PDFView articleView in ScopusGoogle Scholar
[9]T. Keller, G. Lindwall, S. Ghosh, L. Ma, B.M. Lane, F. Zhang, U.R. Kattner, E.A. Lass, J.C. Heigel, Y. Idell, M.E. Williams, A.J. Allen, J.E. Guyer, L.E. LevineApplication of finite element, phase-field, and CALPHAD-based methods to additive manufacturing of Ni-based superalloysActa Mater, 139 (2017), pp. 244-253, 10.1016/j.actamat.2017.05.003View PDFView articleView in ScopusGoogle Scholar
[10]F. Zhang, L.E. Levine, A.J. Allen, M.R. Stoudt, G. Lindwall, E.A. Lass, M.E. Williams, Y. Idell, C.E. CampbellEffect of heat treatment on the microstructural evolution of a nickel-based superalloy additive-manufactured by laser powder bed fusionActa Mater, 152 (2018), pp. 200-214, 10.1016/j.actamat.2018.03.017View PDFView articleView in ScopusGoogle Scholar
[12]H. Wang, L. Chen, B. Dovgyy, W. Xu, A. Sha, X. Li, H. Tang, Y. Liu, H. Wu, M.S. PhamMicro-cracking, microstructure and mechanical properties of Hastelloy-X alloy printed by laser powder bed fusion: As-built, annealed and hot-isostatic pressedAddit. Manuf., 39 (2021), Article 101853, 10.1016/j.addma.2021.101853View PDFView articleView in ScopusGoogle Scholar
[14]H. Kitano, M. Tsujii, M. Kusano, A. Yumoto, M. WatanabeEffect of plastic strain on the solidification cracking of Hastelloy-X in the selective laser melting processAddit. Manuf., 37 (2020), Article 101742, 10.1016/j.addma.2020.101742View at publisher Google Scholar
[15]J. Xu, H. Gruber, D. Deng, R.L. Peng, J.J. MoverareShort-term creep behavior of an additive manufactured non-weldable Nickel-base superalloy evaluated by slow strain rate testingActa Mater, 179 (2019), pp. 142-157, 10.1016/j.actamat.2019.08.034View PDFView articleGoogle Scholar
[16]P. Kontis, E. Chauvet, Z. Peng, J. He, A.K. da Silva, D. Raabe, C. Tassin, J.J. Blandin, S. Abed, R. Dendievel, B. Gault, G. MartinAtomic-scale grain boundary engineering to overcome hot-cracking in additively-manufactured superalloysActa Mater, 177 (2019), pp. 209-221, 10.1016/j.actamat.2019.07.041View PDFView articleView in ScopusGoogle Scholar
[17]C. Körner, M. Ramsperger, C. Meid, D. Bürger, P. Wollgramm, M. Bartsch, G. EggelerMicrostructure and mechanical properties of CMSX-4 single crystals prepared by additive manufacturingMetall. Mater. Trans. A Phys. Metall. Mater. Sci., 49 (2018), pp. 3781-3792, 10.1007/s11661-018-4762-5 View at publisher This article is free to access.View in ScopusGoogle Scholar
[18]T. Ishimoto, R. Ozasa, K. Nakano, M. Weinmann, C. Schnitter, M. Stenzel, A. Matsugaki, T. Nagase, T. Matsuzaka, M. Todai, H.S. Kim, T. NakanoDevelopment of TiNbTaZrMo bio-high entropy alloy (BioHEA) super-solid solution by selective laser melting, and its improved mechanical property and biocompatibilityScr. Mater., 194 (2021), Article 113658, 10.1016/j.scriptamat.2020.113658View PDFView articleView in ScopusGoogle Scholar
[20]K. Karayagiz, L. Johnson, R. Seede, V. Attari, B. Zhang, X. Huang, S. Ghosh, T. Duong, I. Karaman, A. Elwany, R. ArróyaveFinite interface dissipation phase field modeling of Ni–Nb under additive manufacturing conditionsActa Mater, 185 (2020), pp. 320-339, 10.1016/j.actamat.2019.11.057View PDFView articleView in ScopusGoogle Scholar
[21]S. Ghosh, L. Ma, N. Ofori-Opoku, J.E. GuyerOn the primary spacing and microsegregation of cellular dendrites in laser deposited Ni-Nb alloysModel. Simul. Mater. Sci. Eng., 25 (2017), 10.1088/1361-651X/aa7369View at publisher Google Scholar
[22]S. Nomoto, M. Segawa, M. WatanabeNon- and quasi-equilibrium multi-phase field methods coupled with CALPHAD database for rapid-solidification microstructural evolution in laser powder bed additive manufacturing conditionMetals, 11 (2021), p. 626, 10.3390/met11040626View at publisher View in ScopusGoogle Scholar
[26]M. Okugawa, Y. Ohigashi, Y. Furishiro, Y. Koizumi, T. NakanoEquiaxed grain formation by intrinsic heterogeneous nucleation via rapid heating and cooling in additive manufacturing of aluminum-silicon hypoeutectic alloyJ. Alloys Compd., 919 (2022), Article 165812, 10.1016/j.jallcom.2022.165812View PDFView articleView in ScopusGoogle Scholar
[27]M. Okugawa, Y. Furushiro, Y. KoizumiEffect of rapid heating and cooling conditions on microstructure formation in powder bed fusion of Al-Si hypoeutectic alloy: A Phase-Field StudyMaterials, 15 (2022), p. 6092, 10.3390/ma15176092View at publisher View in ScopusGoogle Scholar
[36]C. Kumara, A. Ramanathan Balachandramurthi, S. Goel, F. Hanning, J. MoverareToward a better understanding of phase transformations in additive manufacturing of Alloy 718Materialia, 13 (2020), Article 100862View PDFView articleView in ScopusGoogle Scholar
[37]B. Böttger, M. ApelPhase-field simulation of the formation of new grains by fragmentation during melting of an ABD900 superalloyIOP Conf. Ser. Mater. Sci. Eng., 1281 (2023), Article 012008, 10.1088/1757-899x/1281/1/012008 View at publisher This article is free to access.Google Scholar
[44]K. Sato, S. Takagi, S. Ichikawa, T. Ishimoto, T. NakanoMicrostructure and Solute Segregation around the Melt-Pool Boundary of Orientation-Controlled 316L Austenitic Stainless Steel Produced by Laser Powder Bed FusionMaterials, 16 (2023), 10.3390/ma16010218View at publisher Google Scholar
[45]Y. Liu, K. Nose, M. Okugawa, Y. Koizumi, T. NakanoFabrication and process monitoring of 316L stainless steel by laser powder bed fusion with µ-helix scanning strategy and narrow scanning line intervalsMater. Trans., 64 (2023), pp. 1135-1142, 10.2320/matertrans.MT-ME2022006View at publisherView in ScopusGoogle Scholar
[46]H. Schaar, I. Steinbach, M. TegelerNumerical study of epitaxial growth after partial remelting during selective electron beam melting in the context of ni–alMetals, 11 (2021), pp. 2-13, 10.3390/met11122012View at publisher Google Scholar
[47]M. Uddagiri, O. Shchyglo, I. Steinbach, B. Wahlmann, C. KoernerPhase-Field Study of the History-Effect of Remelted Microstructures on Nucleation During Additive Manufacturing of Ni-Based SuperalloysMetall. Mater. Trans. A Phys. Metall. Mater. Sci., 54 (2023), pp. 1825-1842, 10.1007/s11661-023-07004-0 View at publisher This article is free to access.View in ScopusGoogle Scholar
Unintended end-of-process depression (EOPD) commonly occurs in laser powder bed fusion (LPBF), leading to poor surface quality and lower fatigue strength, especially for many implants. In this study, a high-fidelity multi-physics meso-scale simulation model is developed to uncover the forming mechanism of this defect. A defect-process map of the EOPD phenomenon is obtained using this simulation model. It is found that the EOPD formation mechanisms are different under distinct regions of process parameters. At low scanning speeds in keyhole mode, the long-lasting recoil pressure and the large temperature gradient easily induce EOPD. While at high scanning speeds in keyhole mode, the shallow molten pool morphology and the large solidification rate allow the keyhole to evolve into an EOPD quickly. Nevertheless, in the conduction mode, the Marangoni effects along with a faster solidification rate induce EOPD. Finally, a ‘step’ variable power strategy is proposed to optimise the EOPD defects for the case with high volumetric energy density at low scanning speeds. This work provides a profound understanding and valuable insights into the quality control of LPBF fabrication.
의도하지 않은 공정 종료 후 함몰(EOPD)은 LPBF(레이저 분말층 융합)에서 흔히 발생하며, 특히 많은 임플란트의 경우 표면 품질이 떨어지고 피로 강도가 낮아집니다. 본 연구에서는 이 결함의 형성 메커니즘을 밝히기 위해 충실도가 높은 다중 물리학 메조 규모 시뮬레이션 모델을 개발했습니다.
이 시뮬레이션 모델을 사용하여 EOPD 현상의 결함 프로세스 맵을 얻습니다. EOPD 형성 메커니즘은 공정 매개변수의 별개 영역에서 서로 다른 것으로 밝혀졌습니다.
키홀 모드의 낮은 스캔 속도에서는 오래 지속되는 반동 압력과 큰 온도 구배로 인해 EOPD가 쉽게 유발됩니다. 키홀 모드에서 높은 스캐닝 속도를 유지하는 동안 얕은 용융 풀 형태와 큰 응고 속도로 인해 키홀이 EOPD로 빠르게 진화할 수 있습니다.
그럼에도 불구하고 전도 모드에서는 더 빠른 응고 속도와 함께 마랑고니 효과가 EOPD를 유발합니다. 마지막으로, 낮은 스캐닝 속도에서 높은 체적 에너지 밀도를 갖는 경우에 대해 EOPD 결함을 최적화하기 위한 ‘단계’ 가변 전력 전략이 제안되었습니다.
이 작업은 LPBF 제조의 품질 관리에 대한 심오한 이해와 귀중한 통찰력을 제공합니다.
Figure 5. Simulation of the molten pool under low-speed scanning (1.06 m/s). (a) Sequential solidification of the molten pool at the
end of the melt track for laser powers of 190 and 340 W, respectively. (b) Recoil pressure on the molten pool at the keyhole for laser
powers of 190 and 340 W, respectively. (c) The force diagram of the melt at the back of the keyhole at t = 750 μs in case B. (d) Temperature gradient at the solid–liquid interface of the molten pool at the moment the laser is deactivated in case A. (e) Temperature
gradient at the solid–liquid interface of the molten pool at the moment the laser is deactivated in case B.
References
[1] Zhang C, Li Z, Zhang J, et al. Additive manufacturing of magnesium matrix composites: comprehensive review of recent progress and research perspectives. J Mag Alloys. 2023. doi:10.1016/j.jma.2023.02.005 [2] Webster S, Lin H, Carter III FM, et al. Physical mechanisms in hybrid additive manufacturing: a process design framework. J Mater Process Technol. 2022;291:117048. doi:10. 1016/j.jmatprotec.2021.117048 [3] Wang S, Ning J, Zhu L, et al. Role of porosity defects in metal 3D printing: formation mechanisms, impacts on properties and mitigation strategies. Mater Today. 2022. doi:10.1016/j.mattod.2022.08.014 [4] Wei C, Li L. Recent progress and scientific challenges in multi-material additive manufacturing via laser-based powder bed fusion. Virtual Phys Prototyp. 2021;16 (3):347–371. doi:10.1080/17452759.2021.1928520 [5] Lin X, Wang Q, Fuh JYH, et al. Motion feature based melt pool monitoring for selective laser melting process. J Mater Process Technol. 2022;303:117523. doi:10.1016/j. jmatprotec.2022.117523 [6] Gockel J, Sheridan L, Koerper B, et al. The influence of additive manufacturing processing parameters on surface roughness and fatigue life. Int J Fatigue. 2019;124:380–388. doi:10.1016/j.ijfatigue.2019.03.025 [7] Nicoletto G. Influence of rough as-built surfaces on smooth and notched fatigue behavior of L-PBF AlSi10Mg. Addit Manuf. 2020;34:101251. doi:10.1016/j. addma.2020.101251 [8] Spece H, Yu T, Law AW, et al. 3D printed porous PEEK created via fused filament fabrication for osteoconductive orthopaedic surfaces. J Mech Behav Biomed Mater. 2020;109:103850. doi:10.1115/1.0004270v [9] Andrukhov O, Huber R, Shi B, et al. Proliferation, behavior, and differentiation of osteoblasts on surfaces of different microroughness. Dent Mater. 2016;32(11):1374–1384. doi:10.1016/j.dental.2016.08.217 [10] Dai N, Zhang LC, Zhang J, et al. Corrosion behavior of selective laser melted Ti-6Al-4 V alloy in NaCl solution. Corros Sci. 2016;102:484–489. doi:10.1016/j.corsci.2015. 10.041 [11] Li EL, Wang L, Yu AB, et al. A three-phase model for simulation of heat transfer and melt pool behaviour in laser powder bed fusion process. Powder Technol. 2021;381:298–312. doi:10.1016/j.powtec.2020.11.061 [12] Liao B, Xia RF, Li W, et al. 3D-printed ti6al4v scaffolds with graded triply periodic minimal surface structure for bone tissue engineering. J Mater Eng Perform. 2021;30:4993– 5004. doi:10.1007/s11665-021-05580-z [13] Li E, Zhou Z, Wang L, et al. Melt pool dynamics and pores formation in multi-track studies in laser powder bed fusion process. Powder Technol. 2022;405:117533. doi:10.1016/j.powtec.2022.117533 [14] Guo L, Geng S, Gao X, et al. Numerical simulation of heat transfer and fluid flow during nanosecond pulsed laser processing of Fe78Si9B13 amorphous alloys. Int J Heat Mass Transfer. 2021;170:121003. doi:10.1016/j.ijheatma sstransfer.2021.121003 [15] Guo L, Li Y, Geng S, et al. Numerical and experimental analysis for morphology evolution of 6061 aluminum alloy during nanosecond pulsed laser cleaning. Surf Coat Technol. 2022;432:128056. doi:10.1016/j.surfcoat. 2021.128056 [16] Li S, Liu D, Mi H, et al. Numerical simulation on evolution process of molten pool and solidification characteristics of melt track in selective laser melting of ceramic powder. Ceram Int. 2022;48(13):18302–18315. doi:10. 1016/j.ceramint.2022.03.089 [17] Aboulkhair NT, Maskery I, Tuck C, et al. On the formation of AlSi10Mg single tracks and layers in selective laser melting: microstructure and nano-mechanical properties. J Mater Process Technol. 2016;230:88–98. doi:10.1016/j. jmatprotec.2015.11.016 [18] Thijs L, Kempen K, Kruth JP, et al. Fine-structured aluminium products with controllable texture by selective laser melting of pre-alloyed AlSi10Mg powder. Acta Mater. 2013;61(5):1809–1819. doi:10.1016/j.actamat.2012.11.052 [19] Qiu C, Adkins NJE, Attallah MM. Microstructure and tensile properties of selectively laser-melted and of HIPed laser-melted Ti–6Al–4 V. Mater Sci Eng A. 2013;578:230–239. doi:10.1016/j.msea.2013.04.099 [20] Kazemi Z, Soleimani M, Rokhgireh H, et al. Melting pool simulation of 316L samples manufactured by selective laser melting method, comparison with experimental results. Int J Therm Sci. 2022;176:107538. doi:10.1016/j. ijthermalsci.2022.107538 [21] Cao L. Workpiece-scale numerical simulations of SLM molten pool dynamic behavior of 316L stainless steel. Comput Math Appl. 2021;96:209–228. doi:10.1016/j. camwa.2020.04.020 [22] Liu B, Fang G, Lei L, et al. Predicting the porosity defects in selective laser melting (SLM) by molten pool geometry. Int J Mech Sci. 2022;228:107478. doi:10.1016/j.ijmecsci. 2022.107478 [23] Ur Rehman A, Pitir F, Salamci MU. Full-field mapping and flow quantification of melt pool dynamics in laser powder bed fusion of SS316L. Materials. 2021;14(21):6264. doi:10. 3390/ma14216264 [24] Chia HY, Wang L, Yan W. Influence of oxygen content on melt pool dynamics in metal additive manufacturing: high-fidelity modeling with experimental validation. Acta Mater. 2023;249:118824. doi:10.1016/j.actamat. 2023.118824 [25] Cheng B, Loeber L, Willeck H, et al. Computational investigation of melt pool process dynamics and pore formation in laser powder bed fusion. J Mater Eng Perform. 2019;28:6565–6578. doi:10.1007/s11665-019- 04435-y [26] Li X, Guo Q, Chen L, et al. Quantitative investigation of gas flow, powder-gas interaction, and powder behavior under different ambient pressure levels in laser powder bed fusion. Int J Mach Tools Manuf. 2021;170:103797. doi:10.1016/j.ijmachtools.2021.103797 [27] Wu Y, Li M, Wang J, et al. Powder-bed-fusion additive manufacturing of molybdenum: process simulation, optimization, and property prediction. Addit Manuf. 2022;58:103069. doi:10.1016/j.addma.2022.103069 [28] Wu S, Yang Y, Huang Y, et al. Study on powder particle behavior in powder spreading with discrete element method and its critical implications for binder jetting additive manufacturing processes. Virtual Phys Prototyp. 2023;18(1):e2158877. doi:10.1080/17452759.2022.2158877 [29] Klassen A, Schakowsky T, Kerner C. Evaporation model for beam based additive manufacturing using free surface lattice Boltzmann methods. J Phys D Appl Phys. 2014;47 (27):275303. doi:10.1088/0022-3727/47/27/275303 [30] Cao L. Mesoscopic-scale numerical simulation including the influence of process parameters on slm single-layer multi-pass formation. Metall Mater Trans A. 2020;51:4130–4145. doi:10.1007/s11661-020-05831-z [31] Zhuang JR, Lee YT, Hsieh WH, et al. Determination of melt pool dimensions using DOE-FEM and RSM with process window during SLM of Ti6Al4V powder. Opt Laser Technol. 2018;103:59–76. doi:10.1016/j.optlastec.2018. 01.013 [32] Li Y, Gu D. Thermal behavior during selective laser melting of commercially pure titanium powder: numerical simulation and experimental study. Addit Manuf. 2014;1–4:99–109. doi:10.1016/j.addma.2014.09.001 [33] Dai D, Gu D. Thermal behavior and densification mechanism during selective laser melting of copper matrix composites: simulation and experiments. Mater Des. 2014;55 (0):482–491. doi:10.1016/j.matdes.2013.10.006 [34] Wang S, Zhu L, Dun Y, et al. Multi-physics modeling of direct energy deposition process of thin-walled structures: defect analysis. Comput Mech. 2021;67:c1229– c1242. doi:10.1007/s00466-021-01992-9 [35] Wu J, Zheng J, Zhou H, et al. Molten pool behavior and its mechanism during selective laser melting of polyamide 6 powder: single track simulation and experiments. Mater Res Express. 2019;6. doi:10.1088/2053-1591/ab2747 [36] Cho JH, Farson DF, Milewski JO, et al. Weld pool flows during initial stages of keyhole formation in laser welding. J Phys D Appl Phys. 2009;42. doi:10.1088/0022- 3727/42/17/175502 [37] Sinha KN. Identification of a suitable volumetric heat source for modelling of selective laser melting of Ti6Al4V powder using numerical and experimental validation approach. Int J Adv Manuf Technol. 2018;99:2257–2270. doi:10.1007/s00170-018-2631-4 [38] Fu CH, Guo YB. Three-dimensional temperature gradient mechanism in selective laser melting of Ti-6Al-4V. J Manuf Sci Eng. 2014;136(6):061004. doi:10.1115/1.4028539 [39] Ansari P, Rehman AU, Pitir F, et al. Selective laser melting of 316 l austenitic stainless steel: detailed process understanding using multiphysics simulation and experimentation. Metals. 2021;11(7):1076. doi:10.3390/met11071076 [40] Zhao C, Shi B, Chen S, et al. Laser melting modes in metal powder bed fusion additive manufacturing. Rev Mod Phys. 2022;94(4):045002. doi:10.1103/revmodphys.94. 045002 [41] Bertoli US, Wolfer AJ, Matthews MJ, et al. On the limitations of volumetric energy density as a design parameter for selective laser melting. Mater Des. 2017;113:331–340. doi:10.1016/j.matdes.2016.10.037 [42] Dash A, Kamaraj A. Prediction of the shift in melting mode during additive manufacturing of 316L stainless steel. Mater Today Commun. 2023: 107238. doi:10.1016/j. mtcomm.2023.107238 [43] Majeed M, Khan HM, Rasheed I. Finite element analysis of melt pool thermal characteristics with passing laser in SLM process. Optik. 2019;194:163068. doi:10.1016/j.ijleo. 2019.163068
Yi Wei ;Genyu Chen;Nengru Tao;Wei Zhou https://doi.org/10.1063/5.0191504
In order to comprehensively reveal the evolutionary dynamics of the molten pool and the state of motion of the fluid during the high-precision laser powder bed fusion (HP-LPBF) process, this study aims to deeply investigate the specific manifestations of the multiphase flow, solidification phenomena, and heat transfer during the process by means of numerical simulation methods. Numerical simulation models of SS316L single-layer HP-LPBF formation with single and double tracks were constructed using the discrete element method and the computational fluid dynamics method. The effects of various factors such as Marangoni convection, surface tension, vapor recoil, gravity, thermal convection, thermal radiation, and evaporative heat dissipation on the heat and mass transfer in the molten pool have been paid attention to during the model construction process. The results show that the molten pool exhibits a “comet” shape, in which the temperature gradient at the front end of the pool is significantly larger than that at the tail end, with the highest temperature gradient up to 1.69 × 10⁸ K/s. It is also found that the depth of the second track is larger than that of the first one, and the process parameter window has been determined preliminarily. In addition, the application of HP-LPBF technology helps to reduce the surface roughness and minimize the forming size.
Laser powder bed fusion (LPBF) has become a research hotspot in the field of additive manufacturing of metals due to its advantages of high-dimensional accuracy, good surface quality, high density, and high material utilization.1,2 With the rapid development of electronics, medical, automotive, biotechnology, energy, communication, and optics, the demand for microfabrication technology is increasing day by day.3 High-precision laser powder bed fusion (HP-LPBF) is one of the key manufacturing technologies for tiny parts in the fields of electronics, medical, automotive, biotechnology, energy, communication, and optics because of its process characteristics such as small focal spot diameter, small powder particle size, and thin powder layup layer thickness.4–13 Compared with LPBF, HP-LPBF has the significant advantages of smaller focal spot diameter, smaller powder particle size, and thinner layer thickness. These advantages make HP-LPBF perform better in producing micro-fine parts, high surface quality, and parts with excellent mechanical properties.
HP-LPBF is in the exploratory stage, and researchers have already done some exploratory studies on the focal spot diameter, the amount of defocusing, and the powder particle size. In order to explore the influence of changing the laser focal spot diameter on the LPBF process characteristics of the law, Wildman et al.14 studied five groups of different focal spot diameter LPBF forming 316L stainless steel (SS316L) processing effect, the smallest focal spot diameter of 26 μm, and the results confirm that changing the focal spot diameter can be achieved to achieve the energy control, so as to control the quality of forming. Subsequently, Mclouth et al.15 proposed the laser out-of-focus amount (focal spot diameter) parameter, which characterizes the distance between the forming plane and the laser focal plane. The laser energy density was controlled by varying the defocusing amount while keeping the laser parameters constant. Sample preparation at different focal positions was investigated, and their microstructures were characterized. The results show that the samples at the focal plane have finer microstructure than those away from the focal plane, which is the effect of higher power density and smaller focal spot diameter. In order to explore the influence of changing the powder particle size on the characteristics of the LPBF process, Qian et al.16 carried out single-track scanning simulations on powder beds with average powder particle sizes of 70 and 40 μm, respectively, and the results showed that the melt tracks sizes were close to each other under the same process parameters for the two particle-size distributions and that the molten pool of powder beds with small particles was more elongated and the edges of the melt tracks were relatively flat. In order to explore the superiority of HP-LPBF technology, Xu et al.17 conducted a comparative analysis of HP-LPBF and conventional LPBF of SS316L. The results showed that the average surface roughness of the top surface after forming by HP-LPBF could reach 3.40 μm. Once again, it was verified that HP-LPBF had higher forming quality than conventional LPBF. On this basis, Wei et al.6 comparatively analyzed the effects of different laser focal spot diameters on different powder particle sizes formed by LPBF. The results showed that the smaller the laser focal spot diameter, the fewer the defects on the top and side surfaces. The above research results confirm that reducing the laser focal spot diameter can obtain higher energy density and thus better forming quality.
LPBF involves a variety of complex systems and mechanisms, and the final quality of the part is influenced by a large number of process parameters.18–24 Some research results have shown that there are more than 50 factors affecting the quality of the specimen. The influencing factors are mainly categorized into three main groups: (1) laser parameters, (2) powder parameters, and (3) equipment parameters, which interact with each other to determine the final specimen quality. With the continuous development of technologies such as computational materials science and computational fluid dynamics (CFD), the method of studying the influence of different factors on the forming quality of LPBF forming process has been shifted from time-consuming and laborious experimental characterization to the use of numerical simulation methods. As a result, more and more researchers are adopting this approach for their studies. Currently, numerical simulation studies on LPBF are mainly focused on the exploration of molten pool, temperature distribution, and residual stresses.
Finite element simulation based on continuum mechanics and free surface fluid flow modeling based on fluid dynamics are two common approaches to study the behavior of LPBF molten pool.25–28 Finite element simulation focuses on the temperature and thermal stress fields, treats the powder bed as a continuum, and determines the molten pool size by plotting the elemental temperature above the melting point. In contrast, fluid dynamics modeling can simulate the 2D or 3D morphology of the metal powder pile and obtain the powder size and distribution by certain algorithms.29 The flow in the molten pool is mainly affected by recoil pressure and the Marangoni effect. By simulating the molten pool formation, it is possible to predict defects, molten pool shape, and flow characteristics, as well as the effect of process parameters on the molten pool geometry.30–34 In addition, other researchers have been conducted to optimize the laser processing parameters through different simulation methods and experimental data.35–46 Crystal growth during solidification is studied to further understand the effect of laser parameters on dendritic morphology and solute segregation.47–54 A multi-scale system has been developed to describe the fused deposition process during 3D printing, which is combined with the conductive heat transfer model and the dendritic solidification model.55,56
Relevant scholars have adopted various different methods for simulation, such as sequential coupling theory,57 Lagrangian and Eulerian thermal models,58 birth–death element method,25 and finite element method,59 in order to reveal the physical phenomena of the laser melting process and optimize the process parameters. Luo et al.60 compared the LPBF temperature field and molten pool under double ellipsoidal and Gaussian heat sources by ANSYS APDL and found that the diffusion of the laser energy in the powder significantly affects the molten pool size and the temperature field.
The thermal stresses obtained from the simulation correlate with the actual cracks,61 and local preheating can effectively reduce the residual stresses.62 A three-dimensional thermodynamic finite element model investigated the temperature and stress variations during laser-assisted fabrication and found that powder-to-solid conversion increases the temperature gradient, stresses, and warpage.63 Other scholars have predicted residual stresses and part deflection for LPBF specimens and investigated the effects of deposition pattern, heat, laser power, and scanning strategy on residual stresses, noting that high-temperature gradients lead to higher residual stresses.64–67
In short, the process of LPBF forming SS316L is extremely complex and usually involves drastic multi-scale physicochemical changes that will only take place on a very small scale. Existing literature employs DEM-based mesoscopic-scale numerical simulations to investigate the effects of process parameters on the molten pool dynamics of LPBF-formed SS316L. However, a few studies have been reported on the key mechanisms of heating and solidification, spatter, and convective behavior of the molten pool of HP-LPBF-formed SS316L with small laser focal spot diameters. In this paper, the geometrical properties of coarse and fine powder particles under three-dimensional conditions were first calculated using DEM. Then, numerical simulation models for single-track and double-track cases in the single-layer HP-LPBF forming SS316L process were developed at mesoscopic scale using the CFD method. The flow genesis of the melt in the single-track and double-track molten pools is discussed, and their 3D morphology and dimensional characteristics are discussed. In addition, the effects of laser process parameters, powder particle size, and laser focal spot diameter on the temperature field, characterization information, and defects in the molten pool are discussed.
II. MODELING
A. 3D powder bed modeling
HP-LPBF is an advanced processing technique for preparing target parts layer by layer stacking, the process of which involves repetitive spreading and melting of powders. In this process, both the powder spreading and the morphology of the powder bed are closely related to the results of the subsequent melting process, while the melted surface also affects the uniform distribution of the next layer of powder. For this reason, this chapter focuses on the modeling of the physical action during the powder spreading process and the theory of DEM to establish the numerical model of the powder bed, so as to lay a solid foundation for the accuracy of volume of fluid (VOF) and CFD.
1. DEM
DEM is a numerical technique for calculating the interaction of a large number of particles, which calculates the forces and motions of the spheres by considering each powder sphere as an independent unit. The motion of the powder particles follows the laws of classical Newtonian mechanics, including translational and rotational,38,68–70 which are expressed as follows:����¨=���+∑��ij,
(1)����¨=∑�(�ij×�ij),
(2)
where �� is the mass of unit particle i in kg, ��¨ is the advective acceleration in m/s2, And g is the gravitational acceleration in m/s2. �ij is the force in contact with the neighboring particle � in N. �� is the rotational inertia of the unit particle � in kg · m2. ��¨ is the unit particle � angular acceleration in rad/s2. �ij is the vector pointing from unit particle � to the contact point of neighboring particle �.
Equations (1) and (2) can be used to calculate the velocity and angular velocity variations of powder particles to determine their positions and velocities. A three-dimensional powder bed model of SS316L was developed using DEM. The powder particles are assumed to be perfect spheres, and the substrate and walls are assumed to be rigid. To describe the contact between the powder particles and between the particles and the substrate, a non-slip Hertz–Mindlin nonlinear spring-damping model71 was used with the following expression:�hz=��������+��[(�����ij−�eff����)−(�����+�eff����)],
(3)
where �hz is the force calculated using the Hertzian in M. �� and �� are the radius of unit particles � and � in m, respectively. �� is the overlap size of the two powder particles in m. ��, �� are the elastic constants in the normal and tangential directions, respectively. �ij is the unit vector connecting the centerlines of the two powder particles. �eff is the effective mass of the two powder particles in kg. �� and �� are the viscoelastic damping constants in the normal and tangential directions, respectively. �� and �� are the components of the relative velocities of the two powder particles. ��� is the displacement vector between two spherical particles. The schematic diagram of overlapping powder particles is shown in Fig. 1.
Schematic diagram of overlapping powder particles.
Because the particle size of the powder used for HP-LPBF is much smaller than 100 μm, the effect of van der Waals forces must be considered. Therefore, the cohesive force �jkr of the Hertz–Mindlin model was used instead of van der Waals forces,72 with the following expression:�jkr=−4��0�*�1.5+4�*3�*�3,
(4)1�*=(1−��2)��+(1−��2)��,
(5)1�*=1��+1��,
(6)
where �* is the equivalent Young’s modulus in GPa; �* is the equivalent particle radius in m; �0 is the surface energy of the powder particles in J/m2; α is the contact radius in m; �� and �� are the Young’s modulus of the unit particles � and �, respectively, in GPa; and �� and �� are the Poisson’s ratio of the unit particles � and �, respectively.
2. Model building
Figure 2 shows a 3D powder bed model generated using DEM with a coarse powder geometry of 1000 × 400 × 30 μm3. The powder layer thickness is 30 μm, and the powder bed porosity is 40%. The average particle size of this spherical powder is 31.7 μm and is normally distributed in the range of 15–53 μm. The geometry of the fine powder was 1000 × 400 × 20 μm3, with a layer thickness of 20 μm, and the powder bed porosity of 40%. The average particle size of this spherical powder is 11.5 μm and is normally distributed in the range of 5–25 μm. After the 3D powder bed model is generated, it needs to be imported into the CFD simulation software for calculation, and the imported geometric model is shown in Fig. 3. This geometric model is mainly composed of three parts: protective gas, powder bed, and substrate. Under the premise of ensuring the accuracy of the calculation, the mesh size is set to 3 μm, and the total number of coarse powder meshes is 1 704 940. The total number of fine powder meshes is 3 982 250.
Geometric modeling of the powder bed computational domain: (a) coarse powder, (b) fine powder.
B. Modeling of fluid mechanics simulation
In order to solve the flow, melting, and solidification problems involved in HP-LPBF molten pool, the study must follow the three governing equations of conservation of mass, conservation of energy, and conservation of momentum.73 The VOF method, which is the most widely used in fluid dynamics, is used to solve the molten pool dynamics model.
1. VOF
VOF is a method for tracking the free interface between the gas and liquid phases on the molten pool surface. The core idea of the method is to define a volume fraction function F within each grid, indicating the proportion of the grid space occupied by the material, 0 ≤ F ≤ 1 in Fig. 4. Specifically, when F = 0, the grid is empty and belongs to the gas-phase region; when F = 1, the grid is completely filled with material and belongs to the liquid-phase region; and when 0 < F < 1, the grid contains free surfaces and belongs to the mixed region. The direction normal to the free surface is the direction of the fastest change in the volume fraction F (the direction of the gradient of the volume fraction), and the direction of the gradient of the volume fraction can be calculated from the values of the volume fractions in the neighboring grids.74 The equations controlling the VOF are expressed as follows:𝛻����+�⋅(��→)=0,
(7)
where t is the time in s and �→ is the liquid velocity in m/s.
The material parameters of the mixing zone are altered due to the inclusion of both the gas and liquid phases. Therefore, in order to represent the density of the mixing zone, the average density �¯ is used, which is expressed as follows:72�¯=(1−�1)�gas+�1�metal,
(8)
where �1 is the proportion of liquid phase, �gas is the density of protective gas in kg/m3, and �metal is the density of metal in kg/m3.
2. Control equations and boundary conditions
Figure 5 is a schematic diagram of the HP-LPBF melting process. First, the laser light strikes a localized area of the material and rapidly heats up the area. Next, the energy absorbed in the region is diffused through a variety of pathways (heat conduction, heat convection, and surface radiation), and this process triggers complex phase transition phenomena (melting, evaporation, and solidification). In metals undergoing melting, the driving forces include surface tension and the Marangoni effect, recoil due to evaporation, and buoyancy due to gravity and uneven density. The above physical phenomena interact with each other and do not occur independently.
Laser heat sourceThe Gaussian surface heat source model is used as the laser heat source model with the following expression:�=2�0����2exp(−2�12��2),(9)where � is the heat flow density in W/m2, �0 is the absorption rate of SS316L, �� is the radius of the laser focal spot in m, and �1 is the radial distance from the center of the laser focal spot in m. The laser focal spot can be used for a wide range of applications.
Energy absorptionThe formula for calculating the laser absorption �0 of SS316L is as follows:�0=0.365(�0[1+�0(�−20)]/�)0.5,(10)where �0 is the direct current resistivity of SS316L at 20 °C in Ω m, �0 is the resistance temperature coefficient in ppm/°C, � is the temperature in °C, and � is the laser wavelength in m.
Heat transferThe basic principle of heat transfer is conservation of energy, which is expressed as follows:𝛻𝛻𝛻�(��)��+�·(��→�)=�·(�0����)+��,(11)where � is the density of liquid phase SS316L in kg/m3, �� is the specific heat capacity of SS316L in J/(kg K), 𝛻� is the gradient operator, t is the time in s, T is the temperature in K, 𝛻�� is the temperature gradient, �→ is the velocity vector, �0 is the coefficient of thermal conduction of SS316L in W/(m K), and �� is the thermal energy dissipation term in the molten pool.
Molten pool flowThe following three conditions need to be satisfied for the molten pool to flow:
Conservation of mass with the following expression:𝛻�·(��→)=0.(12)
Conservation of momentum (Navier–Stokes equation) with the following expression:𝛻𝛻𝛻𝛻���→��+�(�→·�)�→=�·[−pI+�(��→+(��→)�)]+�,(13)where � is the pressure in Pa exerted on the liquid phase SS316L microelement, � is the unit matrix, � is the fluid viscosity in N s/m2, and � is the volumetric force (gravity, atmospheric pressure, surface tension, vapor recoil, and the Marangoni effect).
Surface tension and the Marangoni effectThe effect of temperature on the surface tension coefficient is considered and set as a linear relationship with the following expression:�=�0−��dT(�−��),(14)where � is the surface tension of the molten pool at temperature T in N/m, �� is the melting temperature of SS316L in K, �0 is the surface tension of the molten pool at temperature �� in Pa, and σdσ/ dT is the surface tension temperature coefficient in N/(m K).In general, surface tension decreases with increasing temperature. A temperature gradient causes a gradient in surface tension that drives the liquid to flow, known as the Marangoni effect.
Metal vapor recoilAt higher input energy densities, the maximum temperature of the molten pool surface reaches the evaporation temperature of the material, and a gasification recoil pressure occurs vertically downward toward the molten pool surface, which will be the dominant driving force for the molten pool flow.75 The expression is as follows:��=0.54�� exp ���−���0���,(15)where �� is the gasification recoil pressure in Pa, �� is the ambient pressure in kPa, �� is the latent heat of evaporation in J/kg, �0 is the gas constant in J/(mol K), T is the surface temperature of the molten pool in K, and Te is the evaporation temperature in K.
Solid–liquid–gas phase transitionWhen the laser hits the powder layer, the powder goes through three stages: heating, melting, and solidification. During the solidification phase, mutual transformations between solid, liquid, and gaseous states occur. At this point, the latent heat of phase transition absorbed or released during the phase transition needs to be considered.68 The phase transition is represented based on the relationship between energy and temperature with the following expression:�=�����,(�<��),�(��)+�−����−����,(��<�<��)�(��)+(�−��)����,(��<�),,(16)where �� and �� are solid and liquid phase density, respectively, of SS316L in kg/m3. �� and �� unit volume of solid and liquid phase-specific heat capacity, respectively, of SS316L in J/(kg K). �� and ��, respectively, are the solidification temperature and melting temperature of SS316L in K. �� is the latent heat of the phase transition of SS316L melting in J/kg.
3. Assumptions
The CFD model was computed using the commercial software package FLOW-3D.76 In order to simplify the calculation and solution process while ensuring the accuracy of the results, the model makes the following assumptions:
It is assumed that the effects of thermal stress and material solid-phase thermal expansion on the calculation results are negligible.
The molten pool flow is assumed to be a Newtonian incompressible laminar flow, while the effects of liquid thermal expansion and density on the results are neglected.
It is assumed that the surface tension can be simplified to an equivalent pressure acting on the free surface of the molten pool, and the effect of chemical composition on the results is negligible.
Neglecting the effect of the gas flow field on the molten pool.
The mass loss due to evaporation of the liquid metal is not considered.
The influence of the plasma effect of the molten metal on the calculation results is neglected.
It is worth noting that the formulation of assumptions requires a trade-off between accuracy and computational efficiency. In the above models, some physical phenomena that have a small effect or high difficulty on the calculation results are simplified or ignored. Such simplifications make numerical simulations more efficient and computationally tractable, while still yielding accurate results.
4. Initial conditions
The preheating temperature of the substrate was set to 393 K, at which time all materials were in the solid state and the flow rate was zero.
5. Material parameters
The material used is SS316L and the relevant parameters required for numerical simulations are shown in Table I.46,77,78
TABLE I.
SS316L-related parameters.
Property
Symbol
Value
Density of solid metal (kg/m3)
�metal
7980
Solid phase line temperature (K)
��
1658
Liquid phase line temperature (K)
��
1723
Vaporization temperature (K)
��
3090
Latent heat of melting ( J/kg)
��
2.60×10⁵
Latent heat of evaporation ( J/kg)
��
7.45×10⁶
Surface tension of liquid phase (N /m)
�
1.60
Liquid metal viscosity (kg/m s)
��
6×10⁻³
Gaseous metal viscosity (kg/m s)
�gas
1.85×10⁻⁵
Temperature coefficient of surface tension (N/m K)
��/�T
0.80×10⁻³
Molar mass ( kg/mol)
M
0.05 593
Emissivity
�
0.26
Laser absorption
�0
0.35
Ambient pressure (kPa)
��
101 325
Ambient temperature (K)
�0
300
Stefan–Boltzmann constant (W/m2 K4)
�
5.67×10⁻⁸
Thermal conductivity of metals ( W/m K)
�
24.55
Density of protective gas (kg/m3)
�gas
1.25
Coefficient of thermal expansion (/K)
��
16×10−6
Generalized gas constant ( J/mol K)
R
8.314
III. RESULTS AND DISCUSSION
With the objective of studying in depth the evolutionary patterns of single-track and double-track molten pool development, detailed observations were made for certain specific locations in the model, as shown in Fig. 6. In this figure, P1 and P2 represent the longitudinal tangents to the centers of the two melt tracks in the XZ plane, while L1 is the transverse profile in the YZ plane. The scanning direction is positive and negative along the X axis. Points A and B are the locations of the centers of the molten pool of the first and second melt tracks, respectively (x = 1.995 × 10⁻⁴, y = 5 × 10⁻⁷, and z = −4.85 × 10⁻⁵).
A series of single-track molten pool simulation experiments were carried out in order to investigate the influence law of laser power as well as scanning speed on the HP-LPBF process. Figure 7 demonstrates the evolution of the 3D morphology and temperature field of the single-track molten pool in the time period of 50–500 μs under a laser power of 100 W and a scanning speed of 800 mm/s. The powder bed is in the natural cooling state. When t = 50 μs, the powder is heated by the laser heat and rapidly melts and settles to form the initial molten pool. This process is accompanied by partial melting of the substrate and solidification together with the melted powder. The molten pool rapidly expands with increasing width, depth, length, and temperature, as shown in Fig. 7(a). When t = 150 μs, the molten pool expands more obviously, and the temperature starts to transfer to the surrounding area, forming a heat-affected zone. At this point, the width of the molten pool tends to stabilize, and the temperature in the center of the molten pool has reached its peak and remains largely stable. However, the phenomenon of molten pool spatter was also observed in this process, as shown in Fig. 7(b). As time advances, when t = 300 μs, solidification begins to occur at the tail of the molten pool, and tiny ripples are produced on the solidified surface. This is due to the fact that the melt flows toward the region with large temperature gradient under the influence of Marangoni convection and solidifies together with the melt at the end of the bath. At this point, the temperature gradient at the front of the bath is significantly larger than at the end. While the width of the molten pool was gradually reduced, the shape of the molten pool was gradually changed to a “comet” shape. In addition, a slight depression was observed at the top of the bath because the peak temperature at the surface of the bath reached the evaporation temperature, which resulted in a recoil pressure perpendicular to the surface of the bath downward, creating a depressed region. As the laser focal spot moves and is paired with the Marangoni convection of the melt, these recessed areas will be filled in as shown in Fig. 7(c). It has been shown that the depressed regions are the result of the coupled effect of Marangoni convection, recoil pressure, and surface tension.79 By t = 500 μs, the width and height of the molten pool stabilize and show a “comet” shape in Fig. 7(d).
Single-track molten pool process: (a) t = 50 ��, (b) t = 150 ��, (c) t = 300 ��, (d) t = 500 ��.
Figure 8 depicts the velocity vector diagram of the P1 profile in a single-track molten pool, the length of the arrows represents the magnitude of the velocity, and the maximum velocity is about 2.36 m/s. When t = 50 μs, the molten pool takes shape, and the velocities at the two ends of the pool are the largest. The variation of the velocities at the front end is especially more significant in Fig. 8(a). As the time advances to t = 150 μs, the molten pool expands rapidly, in which the velocity at the tail increases and changes more significantly, while the velocity at the front is relatively small. At this stage, the melt moves backward from the center of the molten pool, which in turn expands the molten pool area. The melt at the back end of the molten pool center flows backward along the edge of the molten pool surface and then converges along the edge of the molten pool to the bottom center, rising to form a closed loop. Similarly, a similar closed loop is formed at the front end of the center of the bath, but with a shorter path. However, a large portion of the melt in the center of the closed loop formed at the front end of the bath is in a nearly stationary state. The main cause of this melt flow phenomenon is the effect of temperature gradient and surface tension (the Marangoni effect), as shown in Figs. 8(b) and 8(e). This dynamic behavior of the melt tends to form an “elliptical” pool. At t = 300 μs, the tendency of the above two melt flows to close the loop is more prominent and faster in Fig. 8(c). When t = 500 μs, the velocity vector of the molten pool shows a stable trend, and the closed loop of melt flow also remains stable. With the gradual laser focal spot movement, the melt is gradually solidified at its tail, and finally, a continuous and stable single track is formed in Fig. 8(d).
Vector plot of single-track molten pool velocity in XZ longitudinal section: (a) t = 50 ��, (b) t = 150 ��, (c) t = 300 ��, (d) t = 500 ��, (e) molten pool flow.
In order to explore in depth the transient evolution of the molten pool, the evolution of the single-track temperature field and the melt flow was monitored in the YZ cross section. Figure 9(a) shows the state of the powder bed at the initial moment. When t = 250 μs, the laser focal spot acts on the powder bed and the powder starts to melt and gradually collects in the molten pool. At this time, the substrate will also start to melt, and the melt flow mainly moves in the downward and outward directions and the velocity is maximum at the edges in Fig. 9(b). When t = 300 μs, the width and depth of the molten pool increase due to the recoil pressure. At this time, the melt flows more slowly at the center, but the direction of motion is still downward in Fig. 9(c). When t = 350 μs, the width and depth of the molten pool further increase, at which time the intensity of the melt flow reaches its peak and the direction of motion remains the same in Fig. 9(d). When t = 400 μs, the melt starts to move upward, and the surrounding powder or molten material gradually fills up, causing the surface of the molten pool to begin to flatten. At this time, the maximum velocity of the melt is at the center of the bath, while the velocity at the edge is close to zero, and the edge of the melt starts to solidify in Fig. 9(e). When t = 450 μs, the melt continues to move upward, forming a convex surface of the melt track. However, the melt movement slows down, as shown in Fig. 9(f). When t = 500 μs, the melt further moves upward and its speed gradually becomes smaller. At the same time, the melt solidifies further, as shown in Fig. 9(g). When t = 550 μs, the melt track is basically formed into a single track with a similar “mountain” shape. At this stage, the velocity is close to zero only at the center of the molten pool, and the flow behavior of the melt is poor in Fig. 9(h). At t = 600 μs, the melt stops moving and solidification is rapidly completed. Up to this point, a single track is formed in Fig. 9(i). During the laser action on the powder bed, the substrate melts and combines with the molten state powder. The powder-to-powder fusion is like the convergence of water droplets, which are rapidly fused by surface tension. However, the fusion between the molten state powder and the substrate occurs driven by surface tension, and the molten powder around the molten pool is pulled toward the substrate (a wetting effect occurs), which ultimately results in the formation of a monolithic whole.38,80,81
Evolution of single-track molten pool temperature and melt flow in the YZ cross section: (a) t = 0 ��, (b) t = 250 ��, (c) t = 300 ��, (d) t = 350 ��, (e) t = 400 ��, (f) t = 450 ��, (g) t = 500 ��, (h) t = 550 ��, (i) t = 600 ��.
The wetting ability between the liquid metal and the solid substrate in the molten pool directly affects the degree of balling of the melt,82,83 and the wetting ability can be measured by the contact angle of a single track in Fig. 10. A smaller value of contact angle represents better wettability. The contact angle α can be calculated by�=�1−�22,
(17)
where �1 and �2 are the contact angles of the left and right regions, respectively.
Relevant studies have confirmed that the wettability is better at a contact angle α around or below 40°.84 After measurement, a single-track contact angle α of about 33° was obtained under this process parameter, which further confirms the good wettability.
B. Double-track simulation
In order to deeply investigate the influence of hatch spacing on the characteristics of the HP-LPBF process, a series of double-track molten pool simulation experiments were systematically carried out. Figure 11 shows in detail the dynamic changes of the 3D morphology and temperature field of the double-track molten pool in the time period of 2050–2500 μs under the conditions of laser power of 100 W, scanning speed of 800 mm/s, and hatch spacing of 0.06 mm. By comparing the study with Fig. 7, it is observed that the basic characteristics of the 3D morphology and temperature field of the second track are similar to those of the first track. However, there are subtle differences between them. The first track exhibits a basically symmetric shape, but the second track morphology shows a slight deviation influenced by the difference in thermal diffusion rate between the solidified metal and the powder. Otherwise, the other characteristic information is almost the same as that of the first track. Figure 12 shows the velocity vector plot of the P2 profile in the double-track molten pool, with a maximum velocity of about 2.63 m/s. The melt dynamics at both ends of the pool are more stable at t = 2050 μs, where the maximum rate of the second track is only 1/3 of that of the first one. Other than that, the rest of the information is almost no significant difference from the characteristic information of the first track. Figure 13 demonstrates a detailed observation of the double-track temperature field and melts flow in the YZ cross section, and a comparative study with Fig. 9 reveals that the width of the second track is slightly wider. In addition, after the melt direction shifts from bottom to top, the first track undergoes four time periods (50 μs) to reach full solidification, while the second track takes five time periods. This is due to the presence of significant heat buildup in the powder bed after the forming of the first track, resulting in a longer dynamic time of the melt and an increased molten pool lifetime. In conclusion, the level of specimen forming can be significantly optimized by adjusting the laser power and hatch spacing.
Evolution of double-track molten pool temperature and melt flow in the YZ cross section: (a) t = 2250 ��, (b) t = 2300 ��, (c) t = 2350 ��, (d) t = 2400 ��, (e) t = 2450 ��, (f) t = 2500 ��, (g) t = 2550 ��, (h) t = 2600 ��, (i) t = 2650 ��.
In order to quantitatively detect the molten pool dimensions as well as the remolten region dimensions, the molten pool characterization information in Fig. 14 is constructed by drawing the boundary on the YZ cross section based on the isothermal surface of the liquid phase line. It can be observed that the heights of the first track and second track are basically the same, but the depth of the second track increases relative to the first track. The molten pool width is mainly positively correlated with the laser power as well as the scanning speed (the laser line energy density �). However, the remelted zone width is negatively correlated with the hatch spacing (the overlapping ratio). Overall, the forming quality of the specimens can be directly influenced by adjusting the laser power, scanning speed, and hatch spacing.
Double-track molten pool characterization information on YZ cross section.
In order to study the variation rule of the temperature in the center of the molten pool with time, Fig. 15 demonstrates the temperature variation curves with time for two reference points, A and B. Among them, the red dotted line indicates the liquid phase line temperature of SS316L. From the figure, it can be seen that the maximum temperature at the center of the molten pool in the first track is lower than that in the second track, which is mainly due to the heat accumulation generated after passing through the first track. The maximum temperature gradient was calculated to be 1.69 × 10⁸ K/s. When the laser scanned the first track, the temperature in the center of the molten pool of the second track increased slightly. Similarly, when the laser scanned the second track, a similar situation existed in the first track. Since the temperature gradient in the second track is larger than that in the first track, the residence time of the liquid phase in the molten pool of the first track is longer than that of the second track.
Temperature profiles as a function of time for two reference points A and B.
C. Simulation analysis of molten pool under different process parameters
In order to deeply investigate the effects of various process parameters on the mesoscopic-scale temperature field, molten pool characteristic information and defects of HP-LPBF, numerical simulation experiments on mesoscopic-scale laser power, scanning speed, and hatch spacing of double-track molten pools were carried out.
1. Laser power
Figure 16 shows the effects of different laser power on the morphology and temperature field of the double-track molten pool at a scanning speed of 800 mm/s and a hatch spacing of 0.06 mm. When P = 50 W, a smaller molten pool is formed due to the lower heat generated by the Gaussian light source per unit time. This leads to a smaller track width, which results in adjacent track not lapping properly and the presence of a large number of unmelted powder particles, resulting in an increase in the number of defects, such as pores in the specimen. The surface of the track is relatively flat, and the depth is small. In addition, the temperature gradient before and after the molten pool was large, and the depression location appeared at the biased front end in Fig. 16(a). When P = 100 W, the surface of the track is flat and smooth with excellent lap. Due to the Marangoni effect, the velocity field of the molten pool is in the form of “vortex,” and the melt has good fluidity, and the maximum velocity reaches 2.15 m/s in Fig. 16(b). When P = 200 W, the heat generated by the Gaussian light source per unit time is too large, resulting in the melt rapidly reaching the evaporation temperature, generating a huge recoil pressure, forming a large molten pool, and the surface of the track is obviously raised. The melt movement is intense, especially the closed loop at the center end of the molten pool. At this time, the depth and width of the molten pool are large, leading to the expansion of the remolten region and the increased chance of the appearance of porosity defects in Fig. 16(c). The results show that at low laser power, the surface tension in the molten pool is dominant. At high laser power, recoil pressure is its main role.
Simulation results of double-track molten pool under different laser powers: (a) P = 50 W, (b) P = 100 W, (c) P = 200 W.
Table II shows the effect of different laser powers on the characteristic information of the double-track molten pool at a scanning speed of 800 mm/s and a hatch spacing of 0.06 mm. The negative overlapping ratio in the table indicates that the melt tracks are not lapped, and 26/29 indicates the melt depth of the first track/second track. It can be seen that with the increase in laser power, the melt depth, melt width, melt height, and remelted zone show a gradual increase. At the same time, the overlapping ratio also increases. Especially in the process of laser power from 50 to 200 W, the melting depth and melting width increased the most, which increased nearly 2 and 1.5 times, respectively. Meanwhile, the overlapping ratio also increases with the increase in laser power, which indicates that the melting and fusion of materials are better at high laser power. On the other hand, the dimensions of the molten pool did not change uniformly with the change of laser power. Specifically, the depth-to-width ratio of the molten pool increased from about 0.30 to 0.39 during the increase from 50 to 120 W, which further indicates that the effective heat transfer in the vertical direction is greater than that in the horizontal direction with the increase in laser power. This dimensional response to laser power is mainly affected by the recoil pressure and also by the difference in the densification degree between the powder layer and the metal substrate. In addition, according to the experimental results, the contact angle shows a tendency to increase and then decrease during the process of laser power increase, and always stays within the range of less than 33°. Therefore, in practical applications, it is necessary to select the appropriate laser power according to the specific needs in order to achieve the best processing results.
TABLE II.
Double-track molten pool characterization information at different laser powers.
Laser power (W)
Depth (μm)
Width (μm)
Height (μm)
Remolten region (μm)
Overlapping ratio (%)
Contact angle (°)
50
16
54
11
/
−10
23
100
26/29
74
14
18
23.33
33
200
37/45
116
21
52
93.33
28
2. Scanning speed
Figure 17 demonstrates the effect of different scanning speeds on the morphology and temperature field of the double-track molten pool at a laser power of 100 W and a hatch spacing of 0.06 mm. With the gradual increase in scanning speed, the surface morphology of the molten pool evolves from circular to elliptical. When � = 200 mm/s, the slow scanning speed causes the material to absorb too much heat, which is very easy to trigger the overburning phenomenon. At this point, the molten pool is larger and the surface morphology is uneven. This situation is consistent with the previously discussed scenario with high laser power in Fig. 17(a). However, when � = 1600 mm/s, the scanning speed is too fast, resulting in the material not being able to absorb sufficient heat, which triggers the powder particles that fail to melt completely to have a direct effect on the bonding of the melt to the substrate. At this time, the molten pool volume is relatively small and the neighboring melt track cannot lap properly. This result is consistent with the previously discussed case of low laser power in Fig. 17(b). Overall, the ratio of the laser power to the scanning speed (the line energy density �) has a direct effect on the temperature field and surface morphology of the molten pool.
Simulation results of double-track molten pool under different scanning speed: (a) � = 200 mm/s, (b) � = 1600 mm/s.
Table III shows the effects of different scanning speed on the characteristic information of the double-track molten pool under the condition of laser power of 100 W and hatch spacing of 0.06 mm. It can be seen that the scanning speed has a significant effect on the melt depth, melt width, melt height, remolten region, and overlapping ratio. With the increase in scanning speed, the melt depth, melt width, melt height, remelted zone, and overlapping ratio show a gradual decreasing trend. Among them, the melt depth and melt width decreased faster, while the melt height and remolten region decreased relatively slowly. In addition, when the scanning speed was increased from 200 to 800 mm/s, the decreasing speeds of melt depth and melt width were significantly accelerated, while the decreasing speeds of overlapping ratio were relatively slow. When the scanning speed was further increased to 1600 mm/s, the decreasing speeds of melt depth and melt width were further accelerated, and the un-lapped condition of the melt channel also appeared. In addition, the contact angle increases and then decreases with the scanning speed, and both are lower than 33°. Therefore, when selecting the scanning speed, it is necessary to make reasonable trade-offs according to the specific situation, and take into account the factors of melt depth, melt width, melt height, remolten region, and overlapping ratio, in order to achieve the best processing results.
TABLE III.
Double-track molten pool characterization information at different scanning speeds.
Scanning speed (mm/s)
Depth (μm)
Width (μm)
Height (μm)
Remolten region (μm)
Overlapping ratio (%)
Contact angle (°)
200
55/68
182
19/32
124
203.33
22
1600
13
50
11
/
−16.67
31
3. Hatch spacing
Figure 18 shows the effect of different hatch spacing on the morphology and temperature field of the double-track molten pool under the condition of laser power of 100 W and scanning speed of 800 mm/s. The surface morphology and temperature field of the first track and second track are basically the same, but slightly different. The first track shows a basically symmetric morphology along the scanning direction, while the second track shows a slight offset due to the difference in the heat transfer rate between the solidified material and the powder particles. When the hatch spacing is too small, the overlapping ratio increases and the probability of defects caused by remelting phenomenon grows. When the hatch spacing is too large, the neighboring melt track cannot overlap properly, and the powder particles are not completely melted, leading to an increase in the number of holes. In conclusion, the ratio of the line energy density � to the hatch spacing (the volume energy density E) has a significant effect on the temperature field and surface morphology of the molten pool.
Simulation results of double-track molten pool under different hatch spacings: (a) H = 0.03 mm, (b) H = 0.12 mm.
Table IV shows the effects of different hatch spacing on the characteristic information of the double-track molten pool under the condition of laser power of 100 W and scanning speed of 800 mm/s. It can be seen that the hatch spacing has little effect on the melt depth, melt width, and melt height, but has some effect on the remolten region. With the gradual expansion of hatch spacing, the remolten region shows a gradual decrease. At the same time, the overlapping ratio also decreased with the increase in hatch spacing. In addition, it is observed that the contact angle shows a tendency to increase and then remain stable when the hatch spacing increases, which has a more limited effect on it. Therefore, trade-offs and decisions need to be made on a case-by-case basis when selecting the hatch spacing.
TABLE IV.
Double-track molten pool characterization information at different hatch spacings.
Hatch spacing (mm)
Depth (μm)
Width (μm)
Height (μm)
Remolten region (μm)
Overlapping ratio (%)
Contact angle (°)
0.03
25/27
82
14
59
173.33
30
0.12
26
78
14
/
−35
33
In summary, the laser power, scanning speed, and hatch spacing have a significant effect on the formation of the molten pool, and the correct selection of these three process parameters is crucial to ensure the forming quality. In addition, the melt depth of the second track is slightly larger than that of the first track at higher line energy density � and volume energy density E. This is mainly due to the fact that a large amount of heat accumulation is generated after the first track, forming a larger molten pool volume, which leads to an increase in the melt depth.
D. Simulation analysis of molten pool with powder particle size and laser focal spot diameter
Figure 19 demonstrates the effect of different powder particle sizes and laser focal spot diameters on the morphology and temperature field of the double-track molten pool under a laser power of 100 W, a scanning speed of 800 mm/s, and a hatch spacing of 0.06 mm. In the process of melting coarse powder with small laser focal spot diameter, the laser energy cannot completely melt the larger powder particles, resulting in their partial melting and further generating excessive pore defects. The larger powder particles tend to generate zigzag molten pool edges, which cause an increase in the roughness of the melt track surface. In addition, the molten pool is also prone to generate the present spatter phenomenon, which can directly affect the quality of forming. The volume of the formed molten pool is relatively small, while the melt depth, melt width, and melt height are all smaller relative to the fine powder in Fig. 19(a). In the process of melting fine powders with a large laser focal spot diameter, the laser energy is able to melt the fine powder particles sufficiently, even to the point of overmelting. This results in a large number of fine spatters being generated at the edge of the molten pool, which causes porosity defects in the melt track in Fig. 19(b). In addition, the maximum velocity of the molten pool is larger for large powder particle sizes compared to small powder particle sizes, which indicates that the temperature gradient in the molten pool is larger for large powder particle sizes and the melt motion is more intense. However, the size of the laser focal spot diameter has a relatively small effect on the melt motion. However, a larger focal spot diameter induces a larger melt volume with greater depth, width, and height. In conclusion, a small powder size helps to reduce the surface roughness of the specimen, and a small laser spot diameter reduces the minimum forming size of a single track.
Simulation results of double-track molten pool with different powder particle size and laser focal spot diameter: (a) focal spot = 25 μm, coarse powder, (b) focal spot = 80 μm, fine powder.
Table V shows the maximum temperature gradient at the reference point for different powder sizes and laser focal spot diameters. As can be seen from the table, the maximum temperature gradient is lower than that of HP-LPBF for both coarse powders with a small laser spot diameter and fine powders with a large spot diameter, a phenomenon that leads to an increase in the heat transfer rate of HP-LPBF, which in turn leads to a corresponding increase in the cooling rate and, ultimately, to the formation of finer microstructures.
TABLE V.
Maximum temperature gradient at the reference point for different powder particle sizes and laser focal spot diameters.
Laser power (W)
Scanning speed (mm/s)
Hatch spacing (mm)
Average powder size (μm)
Laser focal spot diameter (μm)
Maximum temperature gradient (×107 K/s)
100
800
0.06
31.7
25
7.89
11.5
80
7.11
IV. CONCLUSIONS
In this study, the geometrical characteristics of 3D coarse and fine powder particles were first calculated using DEM and then numerical simulations of single track and double track in the process of forming SS316L from monolayer HP-LPBF at mesoscopic scale were developed using CFD method. The effects of Marangoni convection, surface tension, recoil pressure, gravity, thermal convection, thermal radiation, and evaporative heat dissipation on the heat and mass transfer in the molten pool were considered in this model. The effects of laser power, scanning speed, and hatch spacing on the dynamics of the single-track and double-track molten pools, as well as on other characteristic information, were investigated. The effects of the powder particle size on the molten pool were investigated comparatively with the laser focal spot diameter. The main conclusions are as follows:
The results show that the temperature gradient at the front of the molten pool is significantly larger than that at the tail, and the molten pool exhibits a “comet” morphology. At the top of the molten pool, there is a slightly concave region, which is the result of the coupling of Marangoni convection, recoil pressure, and surface tension. The melt flow forms two closed loops, which are mainly influenced by temperature gradients and surface tension. This special dynamic behavior of the melt tends to form an “elliptical” molten pool and an almost “mountain” shape in single-track forming.
The basic characteristics of the three-dimensional morphology and temperature field of the second track are similar to those of the first track, but there are subtle differences. The first track exhibits a basically symmetrical shape; however, due to the difference in thermal diffusion rates between the solidified metal and the powder, a slight asymmetry in the molten pool morphology of the second track occurs. After forming through the first track, there is a significant heat buildup in the powder bed, resulting in a longer dynamic time of the melt, which increases the life of the molten pool. The heights of the first track and second track remained essentially the same, but the depth of the second track was greater relative to the first track. In addition, the maximum temperature gradient was 1.69 × 10⁸ K/s during HP-LPBF forming.
At low laser power, the surface tension in the molten pool plays a dominant role. At high laser power, recoil pressure becomes the main influencing factor. With the increase of laser power, the effective heat transfer in the vertical direction is superior to that in the horizontal direction. With the gradual increase of scanning speed, the surface morphology of the molten pool evolves from circular to elliptical. In addition, the scanning speed has a significant effect on the melt depth, melt width, melt height, remolten region, and overlapping ratio. Too large or too small hatch spacing will lead to remelting or non-lap phenomenon, which in turn causes the formation of defects.
When using a small laser focal spot diameter, it is difficult to completely melt large powder particle sizes, resulting in partial melting and excessive porosity generation. At the same time, large powder particles produce curved edges of the molten pool, resulting in increased surface roughness of the melt track. In addition, spatter occurs, which directly affects the forming quality. At small focal spot diameters, the molten pool volume is relatively small, and the melt depth, the melt width, and the melt height are correspondingly small. Taken together, the small powder particle size helps to reduce surface roughness, while the small spot diameter reduces the forming size.
REFERENCES
S. L. Sing and W. Y. Yeong , “ Laser powder bed fusion for metal additive manufacturing: Perspectives on recent developments,” Virtual Phys. Prototyping. 15, 359–370 (2020).https://doi.org/10.1080/17452759.2020.1779999 Google ScholarCrossref
A. M. Khorasani , I. G. Jithin , J. K. Veetil , and A. H. Ghasemi , “ A review of technological improvements in laser-based powder bed fusion of metal printers,” Int. J. Adv. Manuf. Technol. 108, 191–209 (2020).https://doi.org/10.1007/s00170-020-05361-3 Google ScholarCrossref
Y. Qin , A. Brockett , Y. Ma , A. Razali , J. Zhao , C. Harrison , W. Pan , X. Dai , and D. Loziak , “ Micro-manufacturing: Research, technology outcomes and development issues,” Int. J. Adv. Manuf. Technol. 47, 821–837 (2010).https://doi.org/10.1007/s00170-009-2411-2 Google ScholarCrossref
B. Nagarajan , Z. Hu , X. Song , W. Zhai , and J. Wei , “ Development of micro selective laser melting: The state of the art and future perspectives,” Engineering. 5, 702–720 (2019).https://doi.org/10.1016/j.eng.2019.07.002 Google ScholarCrossref
Y. Wei , G. Chen , W. Li , Y. Zhou , Z. Nie , J. Xu , and W. Zhou , “ Micro selective laser melting of SS316L: Single tracks, defects, microstructures and thermal/mechanical properties,” Opt. Laser Technol. 145, 107469 (2022).https://doi.org/10.1016/j.optlastec.2021.107469 Google ScholarCrossref
Y. Wei , G. Chen , W. Li , M. Li , Y. Zhou , Z. Nie , and J. Xu , “ Process optimization of micro selective laser melting and comparison of different laser diameter for forming different powder,” Opt. Laser Technol. 150, 107953 (2022).https://doi.org/10.1016/j.optlastec.2022.107953 Google ScholarCrossref
H. Zhiheng , B. Nagarajan , X. Song , R. Huang , W. Zhai , and J. Wei , “ Formation of SS316L single tracks in micro selective laser melting: Surface, geometry, and defects,” Adv. Mater. Sci. Eng. 2019, 9451406.https://doi.org/10.1155/2019/9451406 Crossref
B. Nagarajan , Z. Hu , S. Gao , X. Song , R. Huang , M. Seita , and J. Wei , “ Effect of in-situ laser remelting on the microstructure of SS316L fabricated by micro selective laser melting,” in Advanced Surface Enhancement, edited by Sho Itoh and Shashwat Shukla , Lecture Notes in Mechanical Engineering ( Springer Singapore, Singapore, 2020), pp. 330–336. Google ScholarCrossref
H. Zhiheng , B. Nagarajan , X. Song , R. Huang , W. Zhai , and J. Wei , “ Tailoring surface roughness of micro selective laser melted SS316L by in-situ laser remelting,” in Advanced Surface Enhancement, edited by Sho Itoh and Shashwat Shukla , Lecture Notes in Mechanical Engineering ( Springer Singapore, Singapore, 2020), pp. 337–343. Google Scholar
J. Fu , Z. Hu , X. Song , W. Zhai , Y. Long , H. Li , and M. Fu , “ Micro selective laser melting of NiTi shape memory alloy: Defects, microstructures and thermal/mechanical properties,” Opt. Laser Technol. 131, 106374 (2020).https://doi.org/10.1016/j.optlastec.2020.106374 Google ScholarCrossref
E. Abele and M. Kniepkamp , “ Analysis and optimisation of vertical surface roughness in micro selective laser melting,” Surf. Topogr.: Metrol. Prop. 3, 034007 (2015).https://doi.org/10.1088/2051-672X/3/3/034007 Google ScholarCrossref
S. Qu , J. Ding , J. Fu , M. Fu , B. Zhang , and X. Song , “ High-precision laser powder bed fusion processing of pure copper,” Addit. Manuf. 48, 102417 (2021).https://doi.org/10.1016/j.addma.2021.102417 Google ScholarCrossref
Y. Wei , G. Chen , M. Li , W. Li , Y. Zhou , J. Xu , and Z. wei , “ High-precision laser powder bed fusion of 18Ni300 maraging steel and its SiC reinforcement composite materials,” J. Manuf. Process. 84, 750–763 (2022).https://doi.org/10.1016/j.jmapro.2022.10.049 Google ScholarCrossref
B. Liu , R. Wildman , T. Christopher , I. Ashcroft , and H. Richard , “ Investigation the effect of particle size distribution on processing parameters optimisation in selective laser melting process,” in 2011 International Solid Freeform Fabrication Symposium ( University of Texas at Austin, 2011). Google Scholar
T. D. McLouth , G. E. Bean , D. B. Witkin , S. D. Sitzman , P. M. Adams , D. N. Patel , W. Park , J.-M. Yang , and R. J. Zaldivar , “ The effect of laser focus shift on microstructural variation of Inconel 718 produced by selective laser melting,” Mater. Des. 149, 205–213 (2018).https://doi.org/10.1016/j.matdes.2018.04.019 Google ScholarCrossref
Y. Qian , Y. Wentao , and L. Feng , “ Mesoscopic simulations of powder bed fusion: Research progresses and conditions,” Electromachining Mould 06, 46–52 (2017).https://doi.org/10.3969/j.issn.1009-279X.2017.06.012 Google Scholar
J. Fu , S. Qu , J. Ding , X. Song , and M. W. Fu , “ Comparison of the microstructure, mechanical properties and distortion of stainless Steel 316L fabricated by micro and conventional laser powder bed fusion,” Addit. Manuf. 44, 102067 (2021).https://doi.org/10.1016/j.addma.2021.102067 Google ScholarCrossref
N. T. Aboulkhair , I. Maskery , C. Tuck , I. Ashcroft , and N. M. Everitt , “ The microstructure and mechanical properties of selectively laser Melted AlSi10Mg: The effect of a conventional T6-like heat treatment,” Mater. Sci. Eng. A 667, 139–146 (2016).https://doi.org/10.1016/j.msea.2016.04.092 Google ScholarCrossref
S. Y. Chen , J. C. Huang , C. T. Pan , C. H. Lin , T. L. Yang , Y. S. Huang , C. H. Ou , L. Y. Chen , D. Y. Lin , H. K. Lin , T. H. Li , J. S. C. Jang , and C. C. Yang , “ Microstructure and mechanical properties of open-cell porous Ti-6Al-4V fabricated by selective laser melting,” J. Alloys Compd. 713, 248–254 (2017).https://doi.org/10.1016/j.jallcom.2017.04.190 Google ScholarCrossref
Y. Bai , Y. Yang , D. Wang , and M. Zhang , “ Influence mechanism of parameters process and mechanical properties evolution mechanism of Maraging steel 300 by selective laser melting,” Mater. Sci. Eng. A 703, 116–123 (2017).https://doi.org/10.1016/j.msea.2017.06.033 Google ScholarCrossref
Y. Bai , Y. Yang , Z. Xiao , M. Zhang , and D. Wang , “ Process optimization and mechanical property evolution of AlSiMg0.75 by selective laser melting,” Mater. Des. 140, 257–266 (2018).https://doi.org/10.1016/j.matdes.2017.11.045 Google ScholarCrossref
Y. Liu , M. Zhang , W. Shi , Y. Ma , and J. Yang , “ Study on performance optimization of 316L stainless steel parts by high-efficiency selective laser melting,” Opt. Laser Technol. 138, 106872 (2021).https://doi.org/10.1016/j.optlastec.2020.106872 Google ScholarCrossref
D. Gu , Y.-C. Hagedorn , W. Meiners , G. Meng , R. J. S. Batista , K. Wissenbach , and R. Poprawe , “ Densification behavior, microstructure evolution, and wear performance of selective laser melting processed commercially pure titanium,” Acta Mater. 60, 3849–3860 (2012).https://doi.org/10.1016/j.actamat.2012.04.006 Google ScholarCrossref
N. Read , W. Wang , K. Essa , and M. M. Attallah , “ Selective laser melting of AlSi10Mg alloy: Process optimisation and mechanical properties development,” Mater. Des. 65, 417–424 (2015).https://doi.org/10.1016/j.matdes.2014.09.044 Google ScholarCrossref
I. A. Roberts , C. J. Wang , R. Esterlein , M. Stanford , and D. J. Mynors , “ A three-dimensional finite element analysis of the temperature field during laser melting of metal powders in additive layer manufacturing,” Int. J. Mach. Tools Manuf. 49(12–13), 916–923 (2009).https://doi.org/10.1016/j.ijmachtools.2009.07.004 Google ScholarCrossref
K. Dai and L. Shaw , “ Finite element analysis of the effect of volume shrinkage during laser densification,” Acta Mater. 53(18), 4743–4754 (2005).https://doi.org/10.1016/j.actamat.2005.06.014 Google ScholarCrossref
K. Carolin , E. Attar , and P. Heinl , “ Mesoscopic simulation of selective beam melting processes,” J. Mater. Process. Technol. 211(6), 978–987 (2011).https://doi.org/10.1016/j.jmatprotec.2010.12.016 Google ScholarCrossref
F.-J. Gürtler , M. Karg , K.-H. Leitz , and M. Schmidt , “ Simulation of laser beam melting of steel powders using the three-dimensional volume of fluid method,” Phys. Procedia 41, 881–886 (2013).https://doi.org/10.1016/j.phpro.2013.03.162 Google ScholarCrossref
P. Meakin and R. Jullien , “ Restructuring effects in the rain model for random deposition,” J. Phys. France 48(10), 1651–1662 (1987).https://doi.org/10.1051/jphys:0198700480100165100 Google ScholarCrossref
J-m Wang , G-h Liu , Y-l Fang , and W-k Li , “ Marangoni effect in nonequilibrium multiphase system of material processing,” Rev. Chem. Eng. 32(5), 551–585 (2016).https://doi.org/10.1515/revce-2015-0067 Google ScholarCrossref
W. Ye , S. Zhang , L. L. Mendez , M. Farias , J. Li , B. Xu , P. Li , and Y. Zhang , “ Numerical simulation of the melting and alloying processes of elemental titanium and boron powders using selective laser alloying,” J. Manuf. Process. 64, 1235–1247 (2021).https://doi.org/10.1016/j.jmapro.2021.02.044 Google ScholarCrossref
U. S. Bertoli , A. J. Wolfer , M. J. Matthews , J.-P. R. Delplanque , and J. M. Schoenung , “ On the limitations of volumetric energy density as a design parameter for selective laser melting,” Mater. Des. 113, 331–340 (2017).https://doi.org/10.1016/j.matdes.2016.10.037 Google ScholarCrossref
W. E. King , H. D. Barth , V. M. Castillo , G. F. Gallegos , J. W. Gibbs , D. E. Hahn , C. Kamath , and A. M. Rubenchik , “ Observation of keyhole-mode laser melting in laser powder-bed fusion additive manufacturing,” J. Mater. Process. Technol. 214(12), 2915–2925 (2014).https://doi.org/10.1016/j.jmatprotec.2014.06.005 Google ScholarCrossref
L. Cao , “ Numerical simulation of the impact of laying powder on selective laser melting single-pass formation,” Int. J. Heat Mass Transfer 141, 1036–1048 (2019).https://doi.org/10.1016/j.ijheatmasstransfer.2019.07.053 Google ScholarCrossref
L. Huang , X. Hua , D. Wu , and F. Li , “ Numerical study of keyhole instability and porosity formation mechanism in laser welding of aluminum alloy and steel,” J. Mater. Process. Technol. 252, 421–431 (2018).https://doi.org/10.1016/j.jmatprotec.2017.10.011 Google ScholarCrossref
K. Q. Le , C. Tang , and C. H. Wong , “ On the study of keyhole-mode melting in selective laser melting process,” Int. J. Therm. Sci. 145, 105992 (2019).https://doi.org/10.1016/j.ijthermalsci.2019.105992 Google ScholarCrossref
J.-H. Cho and S.-J. Na , “ Theoretical analysis of keyhole dynamics in polarized laser drilling,” J. Phys. D: Appl. Phys. 40(24), 7638 (2007).https://doi.org/10.1088/0022-3727/40/24/007 Google ScholarCrossref
W. Ye , “ Mechanism analysis of selective laser melting and metallurgy process based on base element powder of titanium and boron,” Ph.D. dissertation ( Nanchang University, 2021). Google Scholar
R. Ammer , M. Markl , U. Ljungblad , C. Körner , and U. Rüde , “ Simulating fast electron beam melting with a parallel thermal free surface lattice Boltzmann method,” Comput. Math. Appl. 67(2), 318–330 (2014).https://doi.org/10.1016/j.camwa.2013.10.001 Google ScholarCrossref
H. Chen , Q. Wei , S. Wen , Z. Li , and Y. Shi , “ Flow behavior of powder particles in layering process of selective laser melting: Numerical modeling and experimental verification based on discrete element method,” Int. J. Mach. Tools Manuf. 123, 146–159 (2017).https://doi.org/10.1016/j.ijmachtools.2017.08.004 Google ScholarCrossref
F. Verhaeghe , T. Craeghs , J. Heulens , and L. Pandelaers , “ A pragmatic model for selective laser melting with evaporation,” Acta Mater. 57(20), 6006–6012 (2009).https://doi.org/10.1016/j.actamat.2009.08.027 Google ScholarCrossref
C. H. Fu and Y. B. Guo , “ Three-dimensional temperature gradient mechanism in selective laser melting of Ti-6Al-4V,” J. Manuf. Sci. Eng. 136(6), 061004 (2014).https://doi.org/10.1115/1.4028539 Google ScholarCrossref
Y. Xiang , Z. Shuzhe , L. Junfeng , W. Zhengying , Y. Lixiang , and J. Lihao , “ Numerical simulation and experimental verification for selective laser single track melting forming of Ti6Al4V,” J. Zhejiang Univ. (Eng. Sci.) 53(11), 2102–2109 + 2117 (2019).https://doi.org/10.3785/j.issn.1008-973X.2019.11.007 Google Scholar
Q. He , H. Xia , J. Liu , X. Ao , and S. Lin , “ Modeling and numerical studies of selective laser melting: Multiphase flow, solidification and heat transfer,” Mater. Des. 196, 109115 (2020).https://doi.org/10.1016/j.matdes.2020.109115 Google ScholarCrossref
L. Cao , “ Mesoscopic-scale numerical simulation including the influence of process parameters on SLM single-layer multi-pass formation,” Metall. Mater. Trans. A 51, 4130–4145 (2020).https://doi.org/10.1007/s11661-020-05831-z Google ScholarCrossref
L. Cao , “ Mesoscopic-scale numerical investigation including the influence of process parameters on LPBF multi-layer multi-path formation,” Comput. Model. Eng. Sci. 126(1), 5–23 (2021).https://doi.org/10.32604/cmes.2021.014693 Google ScholarCrossref
H. Yin and S. D. Felicelli , “ Dendrite growth simulation during solidification in the LENS process,” Acta Mater. 58(4), 1455–1465 (2010).https://doi.org/10.1016/j.actamat.2009.10.053 Google ScholarCrossref
P. Nie , O. A. Ojo , and Z. Li , “ Numerical modeling of microstructure evolution during laser additive manufacturing of a nickel-based superalloy,” Acta Mater. 77, 85–95 (2014).https://doi.org/10.1016/j.actamat.2014.05.039 Google ScholarCrossref
Z. Liu and H. Qi , “ Effects of substrate crystallographic orientations on crystal growth and microstructure formation in laser powder deposition of nickel-based superalloy,” Acta Mater. 87, 248–258 (2015).https://doi.org/10.1016/j.actamat.2014.12.046 Google ScholarCrossref
L. Wei , L. Xin , W. Meng , and H. Weidong , “ Cellular automaton simulation of the molten pool of laser solid forming process,” Acta Phys. Sin. 64(01), 018103–018363 (2015).https://doi.org/10.7498/aps.64.018103 Google ScholarCrossref
R. Acharya , J. A. Sharon , and A. Staroselsky , “ Prediction of microstructure in laser powder bed fusion process,” Acta Mater. 124, 360–371 (2017).https://doi.org/10.1016/j.actamat.2016.11.018 Google ScholarCrossref
M. R. Rolchigo and R. LeSar , “ Modeling of binary alloy solidification under conditions representative of additive manufacturing,” Comput. Mater. Sci. 150, 535–545 (2018).https://doi.org/10.1016/j.commatsci.2018.04.004 Google ScholarCrossref
S. Geng , P. Jiang , L. Guo , X. Gao , and G. Mi , “ Multi-scale simulation of grain/sub-grain structure evolution during solidification in laser welding of aluminum alloys,” Int. J. Heat Mass Transfer 149, 119252 (2020).https://doi.org/10.1016/j.ijheatmasstransfer.2019.119252 Google ScholarCrossref
W. L. Wang , W. Q. Liu , X. Yang , R. R. Xu , and Q. Y. Dai , “ Multi-scale simulation of columnar-to-equiaxed transition during laser selective melting of rare earth magnesium alloy,” J. Mater. Sci. Technol. 119, 11–24 (2022).https://doi.org/10.1016/j.jmst.2021.12.029 Google ScholarCrossref
Q. Xia , J. Yang , and Y. Li , “ On the conservative phase-field method with the N-component incompressible flows,” Phys. Fluids 35, 012120 (2023).https://doi.org/10.1063/5.0135490 Google ScholarCrossref
Q. Xia , G. Sun , J. Kim , and Y. Li , “ Multi-scale modeling and simulation of additive manufacturing based on fused deposition technique,” Phys. Fluids 35, 034116 (2023).https://doi.org/10.1063/5.0141316 Google ScholarCrossref
A. Hussein , L. Hao , C. Yan , and R. Everson , “ Finite element simulation of the temperature and stress fields in single layers built without-support in selective laser melting,” Mater. Des. 52, 638–647 (2013).https://doi.org/10.1016/j.matdes.2013.05.070 Google ScholarCrossref
J. Ding , P. Colegrove , J. Mehnen , S. Ganguly , P. M. Sequeira Almeida , F. Wang , and S. Williams , “ Thermo-mechanical analysis of wire and arc additive layer manufacturing process on large multi-layer parts,” Comput. Mater. Sci. 50(12), 3315–3322 (2011).https://doi.org/10.1016/j.commatsci.2011.06.023 Google ScholarCrossref
Y. Du , X. You , F. Qiao , L. Guo , and Z. Liu , “ A model for predicting the temperature field during selective laser melting,” Results Phys. 12, 52–60 (2019).https://doi.org/10.1016/j.rinp.2018.11.031 Google ScholarCrossref
X. Luo , M. Liu , L. Zhenhua , H. Li , and J. Shen , “ Effect of different heat-source models on calculated temperature field of selective laser melted 18Ni300,” Chin. J. Lasers 48(14), 1402005–1402062 (2021).https://doi.org/10.3788/CJL202148.1402005 Google ScholarCrossref
J. F. Li , L. Li , and F. H. Stott , “ Thermal stresses and their implication on cracking during laser melting of ceramic materials,” Acta Mater. 52(14), 4385–4398 (2004).https://doi.org/10.1016/j.actamat.2004.06.005 Google ScholarCrossref
P. Aggarangsi and J. L. Beuth , “ Localized preheating approaches for reducing residual stress in additive manufacturing,” paper presented at the 2006 International Solid Freeform Fabrication Symposium, The University of Texas in Austin on August 14–16, 2006.
K. Dai and L. Shaw , “ Thermal and mechanical finite element modeling of laser forming from metal and ceramic powders,” Acta Mater. 52(1), 69–80 (2004).https://doi.org/10.1016/j.actamat.2003.08.028 Google ScholarCrossref
A. H. Nickel , D. M. Barnett , and F. B. Prinz , “ Thermal stresses and deposition patterns in layered manufacturing,” Mater. Sci. Eng. A 317(1–2), 59–64 (2001).https://doi.org/10.1016/S0921-5093(01)01179-0 Google ScholarCrossref
M. F. Zaeh and G. Branner , “ Investigations on residual stresses and deformations in selective laser melting,” Prod. Eng. 4(1), 35–45 (2010).https://doi.org/10.1007/s11740-009-0192-y Google ScholarCrossref
P. Bian , J. Shi , Y. Liu , and Y. Xie , “ Influence of laser power and scanning strategy on residual stress distribution in additively manufactured 316L steel,” Opt. Laser Technol. 132, 106477 (2020).https://doi.org/10.1016/j.optlastec.2020.106477 Google ScholarCrossref
B. M. Marques , C. M. Andrade , D. M. Neto , M. C. Oliveira , J. L. Alves , and L. F. Menezes , “ Numerical analysis of residual stresses in parts produced by selective laser melting process,” Procedia Manuf. 47, 1170–1177 (2020).https://doi.org/10.1016/j.promfg.2020.04.167 Google ScholarCrossref
W. Mu , “ Numerical simulation of SLM forming process and research and prediction of forming properties,” MA thesis ( Anhui Jianzhu University, 2022). Google Scholar
Y. Zhang , “ Multi-scale multi-physics modeling of laser powder bed fusion process of metallic materials with experiment validation,” Ph.D. dissertation ( Purdue University, 2018). Google Scholar
Y. Qian , “ Mesoscopic simulation studies of key processing issues for powder bed fusion technology,” Ph.D. dissertation ( Tsinghua University, 2019). Google Scholar
N. V. Brilliantov , S. Frank , J.-M. Hertzsch , and T. Pöschel , “ Model for collisions in granular gases,” Phys. Rev. E 53(5), 5382–5392 (1996).https://doi.org/10.1103/PhysRevE.53.5382 Google ScholarCrossref
Z. Xiao , “ Research on microscale selective laser melting process of high strength pure copper specimens,” MA thesis ( Hunan University, 2022). Google Scholar
Z. Li , K. Mukai , M. Zeze , and K. C. Mills , “ Determination of the surface tension of liquid stainless steel,” J. Mater. Sci. 40(9–10), 2191–2195 (2005).https://doi.org/10.1007/s10853-005-1931-x Google ScholarCrossref
R. Scardovelli and S. Zaleski , “ Analytical relations connecting linear interfaces and volume fractions in rectangular grids,” J. Comput. Phys. 164(1), 228–237 (2000).https://doi.org/10.1006/jcph.2000.6567 Google ScholarCrossref
D.-W. Cho , W.-I. Cho , and S.-J. Na , “ Modeling and simulation of arc: Laser and hybrid welding process,” J. Manuf. Process. 16(1), 26–55 (2014).https://doi.org/10.1016/j.jmapro.2013.06.012 Google ScholarCrossref 76.Flow3D. Version 11.1.0: User Manual ( FlowScience, Santa Fe, NM, USA, 2015).
Y. Tian , L. Yang , D. Zhao , Y. Huang , and J. Pan , “ Numerical analysis of powder bed generation and single track forming for selective laser melting of ss316l stainless steel,” J. Manuf. Process. 58, 964–974 (2020).https://doi.org/10.1016/j.jmapro.2020.09.002 Google ScholarCrossref
C. Tang , K. Q. Le , and C. H. Wong , “ Physics of humping formation in laser powder bed fusion,” Int. J. Heat Mass Transfer 149, 119172 (2020).https://doi.org/10.1016/j.ijheatmasstransfer.2019.119172 Google ScholarCrossref
L. Cao , “ Mesoscopic-scale simulation of pore evolution during laser powder bed fusion process,” Comput. Mater. Sci. 179, 109686 (2020).https://doi.org/10.1016/j.commatsci.2020.109686 Google ScholarCrossref
R. Li , J. Liu , Y. Shi , W. Li , and W. Jiang , “ Balling behavior of stainless steel and nickel powder during selective laser melting process,” Int. J. Adv. Manuf. Technol. 59(9–12), 1025–1035 (2012).https://doi.org/10.1007/s00170-011-3566-1 Google ScholarCrossref
S. A. Khairallah and A. Anderson , “ Mesoscopic simulation model of selective laser melting of stainless steel powder,” J. Mater. Process. Technol. 214(11), 2627–2636 (2014).https://doi.org/10.1016/j.jmatprotec.2014.06.001 Google ScholarCrossref
J. Liu , D. Gu , H. Chen , D. Dai , and H. Zhang , “ Influence of substrate surface morphology on wetting behavior of tracks during selective laser melting of aluminum-based alloys,” J. Zhejiang Univ. Sci. A 19(2), 111–121 (2018).https://doi.org/10.1631/jzus.A1700599 Google ScholarCrossref
L. Li , J. Li , and T. Fan , “ Phase-field modeling of wetting and balling dynamics in powder bed fusion process,” Phys. Fluids 33, 042116 (2021).https://doi.org/10.1063/5.0046771 Google ScholarCrossref
X. Nie , Z. Hu , H. Zhu , Z. Hu , L. Ke , and X. Zeng , “ Analysis of processing parameters and characteristics of selective laser melted high strength Al-Cu-Mg alloys: from single tracks to cubic samples,” J. Mater. Process. Technol. 256, 69–77 (2018).https://doi.org/10.1016/j.jmatprotec.2018.01.030 Google ScholarCrossref
금속 적층 제조 중 고체 상 변형 예측: Inconel-738의 전자빔 분말층 융합에 대한 사례 연구
Nana Kwabena Adomako a, Nima Haghdadi a, James F.L. Dingle bc, Ernst Kozeschnik d, Xiaozhou Liao bc, Simon P. Ringer bc, Sophie Primig a
Abstract
Metal additive manufacturing (AM) has now become the perhaps most desirable technique for producing complex shaped engineering parts. However, to truly take advantage of its capabilities, advanced control of AM microstructures and properties is required, and this is often enabled via modeling. The current work presents a computational modeling approach to studying the solid-state phase transformation kinetics and the microstructural evolution during AM. Our approach combines thermal and thermo-kinetic modelling. A semi-analytical heat transfer model is employed to simulate the thermal history throughout AM builds. Thermal profiles of individual layers are then used as input for the MatCalc thermo-kinetic software. The microstructural evolution (e.g., fractions, morphology, and composition of individual phases) for any region of interest throughout the build is predicted by MatCalc. The simulation is applied to an IN738 part produced by electron beam powder bed fusion to provide insights into how γ′ precipitates evolve during thermal cycling. Our simulations show qualitative agreement with our experimental results in predicting the size distribution of γ′ along the build height, its multimodal size character, as well as the volume fraction of MC carbides. Our findings indicate that our method is suitable for a range of AM processes and alloys, to predict and engineer their microstructures and properties.
Additive manufacturing (AM) is an advanced manufacturing method that enables engineering parts with intricate shapes to be fabricated with high efficiency and minimal materials waste. AM involves building up 3D components layer-by-layer from feedstocks such as powder [1]. Various alloys, including steel, Ti, Al, and Ni-based superalloys, have been produced using different AM techniques. These techniques include directed energy deposition (DED), electron- and laser powder bed fusion (E-PBF and L-PBF), and have found applications in a variety of industries such as aerospace and power generation[2], [3], [4]. Despite the growing interest, certain challenges limit broader applications of AM fabricated components in these industries and others. One of such limitations is obtaining a suitable and reproducible microstructure that offers the desired mechanical properties consistently. In fact, the AM as-built microstructure is highly complex and considerably distinctive from its conventionally processed counterparts owing to the complicated thermal cycles arising from the deposition of several layers upon each other [5], [6].
Several studies have reported that the solid-state phases and solidification microstructure of AM processed alloys such as CMSX-4, CoCr [7], [8], Ti-6Al-4V [9], [10], [11], IN738[6], 304L stainless steel[12], and IN718 [13], [14] exhibit considerable variations along the build direction. For instance, references [9], [10] have reported that there is a variation in the distribution of α and β phases along the build direction in Ti-alloys. Similarly, the microstructure of an L-PBF fabricated martensitic steel exhibits variations in the fraction of martensite [15]. Furthermore, some of the present authors and others [6], [16], [17], [18], [19], [20] have recently reviewed and reported that there is a difference in the morphology and fraction of nanoscale precipitates as a function of build height in Ni-based superalloys. These non-uniformities in the as-built microstructure result in an undesired heterogeneity in mechanical and other important properties such as corrosion and oxidation[19], [21], [22], [23]. To obtain the desired microstructure and properties, additional processing treatments are utilized, but this incurs extra costs and may lead to precipitation of detrimental phases and grain coarsening. Therefore, a through-process understanding of the microstructure evolution under repeated heating and cooling is now needed to further advance 3D printed microstructure and property control.
It is now commonly understood that the microstructure evolution during printing is complex, and most AM studies concentrate on the microstructure and mechanical properties of the final build only. Post-printing studies of microstructure characteristics at room temperature miss crucial information on how they evolve. In-situ measurements and modelling approaches are required to better understand the complex microstructural evolution under repeated heating and cooling. Most in-situ measurements in AM focus on monitoring the microstructural changes, such as phase transformations and melt pool dynamics during fabrication using X-ray scattering and high-speed X-ray imaging [24], [25], [26], [27]. For example, Zhao et al. [25] measured the rate of solidification and described the α/β phase transformation during L-PBF of Ti-6Al-4V in-situ. Also, Wahlmann et al. [21] recently used an L-PBF machine coupled with X-ray scattering to investigate the changes in CMSX-4 phase during successive melting processes. Although these techniques provide significant understanding of the basic principles of AM, they are not widely accessible. This is due to the great cost of the instrument, competitive application process, and complexities in terms of the experimental set-up, data collection, and analysis [26], [28].
Computational modeling techniques are promising and more widely accessible tools that enable advanced understanding, prediction, and engineering of microstructures and properties during AM. So far, the majority of computational studies have concentrated on physics based process models for metal AM, with the goal of predicting the temperature profile, heat transfer, powder dynamics, and defect formation (e.g., porosity) [29], [30]. In recent times, there have been efforts in modeling of the AM microstructure evolution using approaches such as phase-field [31], Monte Carlo (MC) [32], and cellular automata (CA) [33], coupled with finite element simulations for temperature profiles. However, these techniques are often restricted to simulating the evolution of solidification microstructures (e.g., grain and dendrite structure) and defects (e.g., porosity). For example, Zinovieva et al. [33] predicted the grain structure of L-PBF Ti-6Al-4V using finite difference and cellular automata methods. However, studies on the computational modelling of the solid-state phase transformations, which largely determine the resulting properties, remain limited. This can be attributed to the multi-component and multi-phase nature of most engineering alloys in AM, along with the complex transformation kinetics during thermal cycling. This kind of research involves predictions of the thermal cycle in AM builds, and connecting it to essential thermodynamic and kinetic data as inputs for the model. Based on the information provided, the thermokinetic model predicts the history of solid-state phase microstructure evolution during deposition as output. For example, a multi-phase, multi-component mean-field model has been developed to simulate the intermetallic precipitation kinetics in IN718 [34] and IN625 [35] during AM. Also, Basoalto et al. [36] employed a computational framework to examine the contrasting distributions of process-induced microvoids and precipitates in two Ni-based superalloys, namely IN718 and CM247LC. Furthermore, McNamara et al. [37] established a computational model based on the Johnson-Mehl-Avrami model for non-isothermal conditions to predict solid-state phase transformation kinetics in L-PBF IN718 and DED Ti-6Al-4V. These models successfully predicted the size and volume fraction of individual phases and captured the repeated nucleation and dissolution of precipitates that occur during AM.
In the current study, we propose a modeling approach with appreciably short computational time to investigate the detailed microstructural evolution during metal AM. This may include obtaining more detailed information on the morphologies of phases, such as size distribution, phase fraction, dissolution and nucleation kinetics, as well as chemistry during thermal cycling and final cooling to room temperature. We utilize the combination of the MatCalc thermo-kinetic simulator and a semi-analytical heat conduction model. MatCalc is a software suite for simulation of phase transformations, microstructure evolution and certain mechanical properties in engineering alloys. It has successfully been employed to simulate solid-state phase transformations in Ni-based superalloys [38], [39], steels [40], and Al alloys[41] during complex thermo-mechanical processes. MatCalc uses the classical nucleation theory as well as the so-called Svoboda-Fischer-Fratzl-Kozeschnik (SFFK) growth model as the basis for simulating precipitation kinetics [42]. Although MatCalc was originally developed for conventional thermo-mechanical processes, we will show that it is also applicable for AM if the detailed time-temperature profile of the AM build is known. The semi-analytical heat transfer code developed by Stump and Plotkowski [43] is used to simulate these profile throughout the AM build.
1.1. Application to IN738
Inconel-738 (IN738) is a precipitation hardening Ni-based superalloy mainly employed in high-temperature components, e.g. in gas turbines and aero-engines owing to its exceptional mechanical properties at temperatures up to 980 °C, coupled with high resistance to oxidation and corrosion [44]. Its superior high-temperature strength (∼1090 MPa tensile strength) is provided by the L12 ordered Ni3(Al,Ti) γ′ phase that precipitates in a face-centered cubic (FCC) γ matrix [45], [46]. Despite offering great properties, IN738, like most superalloys with high γ′ fractions, is challenging to process owing to its propensity to hot cracking [47], [48]. Further, machining of such alloys is challenging because of their high strength and work-hardening rates. It is therefore difficult to fabricate complex INC738 parts using traditional manufacturing techniques like casting, welding, and forging.
The emergence of AM has now made it possible to fabricate such parts from IN738 and other superalloys. Some of the current authors’ recent research successfully applied E-PBF to fabricate defect-free IN738 containing γ′ throughout the build [16], [17]. The precipitated γ′ were heterogeneously distributed. In particular, Haghdadi et al. [16] studied the origin of the multimodal size distribution of γ′, while Lim et al. [17] investigated the gradient in γ′ character with build height and its correlation to mechanical properties. Based on these results, the present study aims to extend the understanding of the complex and site-specific microstructural evolution in E-PBF IN738 by using a computational modelling approach. New experimental evidence (e.g., micrographs not published previously) is presented here to support the computational results.
2. Materials and Methods
2.1. Materials preparation
IN738 Ni-based superalloy (59.61Ni-8.48Co-7.00Al-17.47Cr-3.96Ti-1.01Mo-0.81W-0.56Ta-0.49Nb-0.47C-0.09Zr-0.05B, at%) gas-atomized powder was used as feedstock. The powders, with average size of 60 ± 7 µm, were manufactured by Praxair and distributed by Astro Alloys Inc. An Arcam Q10 machine by GE Additive with an acceleration voltage of 60 kV was used to fabricate a 15 × 15 × 25 mm3 block (XYZ, Z: build direction) on a 316 stainless steel substrate. The block was 3D-printed using a ‘random’ spot melt pattern. The random spot melt pattern involves randomly selecting points in any given layer, with an equal chance of each point being melted. Each spot melt experienced a dwell time of 0.3 ms, and the layer thickness was 50 µm. Some of the current authors have previously characterized the microstructure of the very same and similar builds in more detail [16], [17]. A preheat temperature of ∼1000 °C was set and kept during printing to reduce temperature gradients and, in turn, thermal stresses [49], [50], [51]. Following printing, the build was separated from the substrate through electrical discharge machining. It should be noted that this sample was simultaneously printed with the one used in [17] during the same build process and on the same build plate, under identical conditions.
2.2. Microstructural characterization
The printed sample was longitudinally cut in the direction of the build using a Struers Accutom-50, ground, and then polished to 0.25 µm suspension via standard techniques. The polished x-z surface was electropolished and etched using Struers A2 solution (perchloric acid in ethanol). Specimens for image analysis were polished using a 0.06 µm colloidal silica. Microstructure analyses were carried out across the height of the build using optical microscopy (OM) and scanning electron microscopy (SEM) with focus on the microstructure evolution (γ′ precipitates) in individual layers. The position of each layer being analyzed was determined by multiplying the layer number by the layer thickness (50 µm). It should be noted that the position of the first layer starts where the thermal profile is tracked (in this case, 2 mm from the bottom). SEM images were acquired using a JEOL 7001 field emission microscope. The brightness and contrast settings, acceleration voltage of 15 kV, working distance of 10 mm, and other SEM imaging parameters were all held constant for analysis of the entire build. The ImageJ software was used for automated image analysis to determine the phase fraction and size of γ′ precipitates and carbides. A 2-pixel radius Gaussian blur, following a greyscale thresholding and watershed segmentation was used [52]. Primary γ′ sizes (>50 nm), were measured using equivalent spherical diameters. The phase fractions were considered equal to the measured area fraction. Secondary γ′ particles (<50 nm) were not considered here. The γ′ size in the following refers to the diameter of a precipitate.
2.3. Hardness testing
A Struers DuraScan tester was utilized for Vickers hardness mapping on a polished x-z surface, from top to bottom under a maximum load of 100 mN and 10 s dwell time. 30 micro-indentations were performed per row. According to the ASTM standard [53], the indentations were sufficiently distant (∼500 µm) to assure that strain-hardened areas did not interfere with one another.
2.4. Computational simulation of E-PBF IN738 build
2.4.1. Thermal profile modeling
The thermal history was generated using the semi-analytical heat transfer code (also known as the 3DThesis code) developed by Stump and Plotkowski [43]. This code is an open-source C++ program which provides a way to quickly simulate the conductive heat transfer found in welding and AM. The key use case for the code is the simulation of larger domains than is practicable with Computational Fluid Dynamics/Finite Element Analysis programs like FLOW-3D AM. Although simulating conductive heat transfer will not be an appropriate simplification for some investigations (for example the modelling of keyholding or pore formation), the 3DThesis code does provide fast estimates of temperature, thermal gradient, and solidification rate which can be useful for elucidating microstructure formation across entire layers of an AM build. The mathematics involved in the code is as follows:
In transient thermal conduction during welding and AM, with uniform and constant thermophysical properties and without considering fluid convection and latent heat effects, energy conservation can be expressed as:(1)��∂�∂�=�∇2�+�̇where � is density, � specific heat, � temperature, � time, � thermal conductivity, and �̇ a volumetric heat source. By assuming a semi-infinite domain, Eq. 1 can be analytically solved. The solution for temperature at a given time (t) using a volumetric Gaussian heat source is presented as:(2)��,�,�,�−�0=33�����32∫0�1������exp−3�′�′2��+�′�′2��+�′�′2����′(3)and��=12��−�′+��2for�=�,�,�(4)and�′�′=�−���′Where � is the vector �,�,� and �� is the location of the heat source.
The numerical integration scheme used is an adaptive Gaussian quadrature method based on the following nondimensionalization:(5)�=��xy2�,�′=��xy2�′,�=��xy,�=��xy,�=��xy,�=���xy
A more detailed explanation of the mathematics can be found in reference [43].
The main source of the thermal cycling present within a powder-bed fusion process is the fusion of subsequent layers. Therefore, regions near the top of a build are expected to undergo fewer thermal cycles than those closer to the bottom. For this purpose, data from the single scan’s thermal influence on multiple layers was spliced to represent the thermal cycles experienced at a single location caused by multiple subsequent layers being fused.
The cross-sectional area simulated by this model was kept constant at 1 × 1 mm2, and the depth was dependent on the build location modelled with MatCalc. For a build location 2 mm from the bottom, the maximum number of layers to simulate is 460. Fig. 1a shows a stitched overview OM image of the entire build indicating the region where this thermal cycle is simulated and tracked. To increase similarity with the conditions of the physical build, each thermal history was constructed from the results of two simulations generated with different versions of a random scan path. The parameters used for these thermal simulations can be found in Table 1. It should be noted that the main purpose of the thermal profile modelling was to demonstrate how the conditions at different locations of the build change relative to each other. Accurately predicting the absolute temperature during the build would require validation via a temperature sensor measurement during the build process which is beyond the scope of the study. Nonetheless, to establish the viability of the heat source as a suitable approximation for this study, an additional sensitivity analysis was conducted. This analysis focused on the influence of energy input on γ′ precipitation behavior, the central aim of this paper. This was achieved by employing varying beam absorption energies (0.76, 0.82 – the values utilized in the simulation, and 0.9). The direct impact of beam absorption efficiency on energy input into the material was investigated. Specifically, the initial 20 layers of the build were simulated and subsequently compared to experimental data derived from SEM. While phase fractions were found to be consistent across all conditions, disparities emerged in the mean size of γ′ precipitates. An absorption efficiency of 0.76 yielded a mean size of approximately 70 nm. Conversely, absorption efficiencies of 0.82 and 0.9 exhibited remarkably similar mean sizes of around 130 nm, aligning closely with the outcomes of the experiments.
The numerical analyses of the evolution of precipitates was performed using MatCalc version 6.04 (rel 0.011). The thermodynamic (‘mc_ni.tdb’, version 2.034) and diffusion (‘mc_ni.ddb’, version 2.007) databases were used. MatCalc’s basic principles are elaborated as follows:
The nucleation kinetics of precipitates are computed using a computational technique based on a classical nucleation theory[54] that has been modified for systems with multiple components [42], [55]. Accordingly, the transient nucleation rate (�), which expresses the rate at which nuclei are formed per unit volume and time, is calculated as:(6)�=�0��*∙�xp−�*�∙�∙exp−��where �0 denotes the number of active nucleation sites, �* the rate of atomic attachment, � the Boltzmann constant, � the temperature, �* the critical energy for nucleus formation, τ the incubation time, and t the time. � (Zeldovich factor) takes into consideration that thermal excitation destabilizes the nucleus as opposed to its inactive state [54]. Z is defined as follows:(7)�=−12�kT∂2∆�∂�2�*12where ∆� is the overall change in free energy due to the formation of a nucleus and n is the nucleus’ number of atoms. ∆�’s derivative is evaluated at n* (critical nucleus size). �* accounts for the long-range diffusion of atoms required for nucleation, provided that the matrix’ and precipitates’ composition differ. Svoboda et al. [42] developed an appropriate multi-component equation for �*, which is given by:(8)�*=4��*2�4�∑�=1��ki−�0�2�0��0�−1where �* denotes the critical radius for nucleation, � represents atomic distance, and � is the molar volume. �ki and �0� represent the concentration of elements in the precipitate and matrix, respectively. The parameter �0� denotes the rate of diffusion of the ith element within the matrix. The expression for the incubation time � is expressed as [54]:(9)�=12�*�2
and �*, which represents the critical energy for nucleation:(10)�*=16�3�3∆�vol2where � is the interfacial energy, and ∆Gvol the change in the volume free energy. The critical nucleus’ composition is similar to the γ′ phase’s equilibrium composition at the same temperature. � is computed based on the precipitate and matrix compositions, using a generalized nearest neighbor broken bond model, with the assumption of interfaces being planar, sharp, and coherent [56], [57], [58].
In Eq. 7, it is worth noting that �* represents the fundamental variable in the nucleation theory. It contains �3/∆�vol2 and is in the exponent of the nucleation rate. Therefore, even small variations in γ and/or ∆�vol can result in notable changes in �, especially if �* is in the order of �∙�. This is demonstrated in [38] for UDIMET 720 Li during continuous cooling, where these quantities change steadily during precipitation due to their dependence on matrix’ and precipitate’s temperature and composition. In the current work, these changes will be even more significant as the system is exposed to multiple cycles of rapid cooling and heating.
Once nucleated, the growth of a precipitate is assessed using the radius and composition evolution equations developed by Svoboda et al. [42] with a mean-field method that employs the thermodynamic extremal principle. The expression for the total Gibbs free energy of a thermodynamic system G, which consists of n components and m precipitates, is given as follows:(11)�=∑���0��0�+∑�=1�4���33��+∑�=1��ki�ki+∑�=1�4���2��.
The chemical potential of component � in the matrix is denoted as �0�(�=1,…,�), while the chemical potential of component � in the precipitate is represented by �ki(�=1,…,�,�=1,…,�). These chemical potentials are defined as functions of the concentrations �ki(�=1,…,�,�=1,…,�). The interface energy density is denoted as �, and �� incorporates the effects of elastic energy and plastic work resulting from the volume change of each precipitate.
Eq. (12) establishes that the total free energy of the system in its current state relies on the independent state variables: the sizes (radii) of the precipitates �� and the concentrations of each component �ki. The remaining variables can be determined by applying the law of mass conservation to each component �. This can be represented by the equation:(12)��=�0�+∑�=1�4���33�ki,
Furthermore, the global mass conservation can be expressed by equation:(13)�=∑�=1���When a thermodynamic system transitions to a more stable state, the energy difference between the initial and final stages is dissipated. This model considers three distinct forms of dissipation effects [42]. These include dissipations caused by the movement of interfaces, diffusion within the precipitate and diffusion within the matrix.
Consequently, �̇� (growth rate) and �̇ki (chemical composition’s rate of change) of the precipitate with index � are derived from the linear system of equation system:(14)�ij��=��where �� symbolizes the rates �̇� and �̇ki [42]. Index i contains variables for precipitate radius, chemical composition, and stoichiometric boundary conditions suggested by the precipitate’s crystal structure. Eq. (10) is computed separately for every precipitate �. For a more detailed description of the formulae for the coefficients �ij and �� employed in this work please refer to [59].
The MatCalc software was used to perform the numerical time integration of �̇� and �̇ki of precipitates based on the classical numerical method by Kampmann and Wagner [60]. Detailed information on this method can be found in [61]. Using this computational method, calculations for E-PBF thermal cycles (cyclic heating and cooling) were computed and compared to experimental data. The simulation took approximately 2–4 hrs to complete on a standard laptop.
3. Results
3.1. Microstructure
Fig. 1 displays a stitched overview image and selected SEM micrographs of various γ′ morphologies and carbides after observations of the X-Z surface of the build from the top to 2 mm above the bottom. Fig. 2 depicts a graph that charts the average size and phase fraction of the primary γ′, as it changes with distance from the top to the bottom of the build. The SEM micrographs show widespread primary γ′ precipitation throughout the entire build, with the size increasing in the top to bottom direction. Particularly, at the topmost height, representing the 460th layer (Z = 22.95 mm), as seen in Fig. 1b, the average size of γ′ is 110 ± 4 nm, exhibiting spherical shapes. This is representative of the microstructure after it solidifies and cools to room temperature, without experiencing additional thermal cycles. The γ′ size slightly increases to 147 ± 6 nm below this layer and remains constant until 0.4 mm (∼453rd layer) from the top. At this position, the microstructure still closely resembles that of the 460th layer. After the 453rd layer, the γ′ size grows rapidly to ∼503 ± 19 nm until reaching the 437th layer (1.2 mm from top). The γ′ particles here have a cuboidal shape, and a small fraction is coarser than 600 nm. γ′ continue to grow steadily from this position to the bottom (23 mm from the top). A small fraction of γ′ is > 800 nm.
Besides primary γ′, secondary γ′ with sizes ranging from 5 to 50 nm were also found. These secondary γ′ precipitates, as seen in Fig. 1f, were present only in the bottom and middle regions. A detailed analysis of the multimodal size distribution of γ′ can be found in [16]. There is no significant variation in the phase fraction of the γ′ along the build. The phase fraction is ∼ 52%, as displayed in Fig. 2. It is worth mentioning that the total phase fraction of γ′ was estimated based on the primary γ′ phase fraction because of the small size of secondary γ′. Spherical MC carbides with sizes ranging from 50 to 400 nm and a phase fraction of 0.8% were also observed throughout the build. The carbides are the light grey precipitates in Fig. 1g. The light grey shade of carbides in the SEM images is due to their composition and crystal structure [52]. These carbides are not visible in Fig. 1b-e because they were dissolved during electro-etching carried out after electropolishing. In Fig. 1g, however, the sample was examined directly after electropolishing, without electro-etching.
Table 2 shows the nominal and measured composition of γ′ precipitates throughout the build by atom probe microscopy as determined in our previous study [17]. No build height-dependent composition difference was observed in either of the γ′ precipitate populations. However, there was a slight disparity between the composition of primary and secondary γ′. Among the main γ′ forming elements, the primary γ′ has a high Ti concentration while secondary γ′ has a high Al concentration. A detailed description of the atom distribution maps and the proxigrams of the constituent elements of γ′ throughout the build can be found in [17].
Table 2. Bulk IN738 composition determined using inductively coupled plasma atomic emission spectroscopy (ICP-AES). Compositions of γ, primary γ′, and secondary γ′ at various locations in the build measured by APT. This information is reproduced from data in Ref. [17] with permission.
at%
Ni
Cr
Co
Al
Mo
W
Ti
Nb
C
B
Zr
Ta
Others
Bulk
59.12
17.47
8.48
7.00
1.01
0.81
3.96
0.49
0.47
0.05
0.09
0.56
0.46
γ matrix
Top
50.48
32.91
11.59
1.94
1.39
0.82
0.44
0.8
0.03
0.03
0.02
–
0.24
Mid
50.37
32.61
11.93
1.79
1.54
0.89
0.44
0.1
0.03
0.02
0.02
0.01
0.23
Bot
48.10
34.57
12.08
2.14
1.43
0.88
0.48
0.08
0.04
0.03
0.01
–
0.12
Primary γ′
Top
72.17
2.51
3.44
12.71
0.25
0.39
7.78
0.56
–
0.03
0.02
0.05
0.08
Mid
71.60
2.57
3.28
13.55
0.42
0.68
7.04
0.73
–
0.01
0.03
0.04
0.04
Bot
72.34
2.47
3.86
12.50
0.26
0.44
7.46
0.50
0.05
0.02
0.02
0.03
0.04
Secondary γ′
Mid
70.42
4.20
3.23
14.19
0.63
1.03
5.34
0.79
0.03
–
0.04
0.04
0.05
Bot
69.91
4.06
3.68
14.32
0.81
1.04
5.22
0.65
0.05
–
0.10
0.02
0.11
3.2. Hardness
Fig. 3a shows the Vickers hardness mapping performed along the entire X-Z surface, while Fig. 3b shows the plot of average hardness at different build heights. This hardness distribution is consistent with the γ′ precipitate size gradient across the build direction in Fig. 1, Fig. 2. The maximum hardness of ∼530 HV1 is found at ∼0.5 mm away from the top surface (Z = 22.5), where γ′ particles exhibit the smallest observed size in Fig. 2b. Further down the build (∼ 2 mm from the top), the hardness drops to the 440–490 HV1 range. This represents the region where γ′ begins to coarsen. The hardness drops further to 380–430 HV1 at the bottom of the build.
3.3. Modeling of the microstructural evolution during E-PBF
3.3.1. Thermal profile modeling
Fig. 4 shows the simulated thermal profile of the E-PBF build at a location of 23 mm from the top of the build, using a semi-analytical heat conduction model. This profile consists of the time taken to deposit 460 layers until final cooling, as shown in Fig. 4a. Fig. 4b-d show the magnified regions of Fig. 4a and reveal the first 20 layers from the top, a single layer (first layer from the top), and the time taken for the build to cool after the last layer deposition, respectively.
The peak temperatures experienced by previous layers decrease progressively as the number of layers increases but never fall below the build preheat temperature (1000 °C). Our simulated thermal cycle may not completely capture the complexity of the actual thermal cycle utilized in the E-PBF build. For instance, the top layer (Fig. 4c), also representing the first deposit’s thermal profile without additional cycles (from powder heating, melting, to solidification), recorded the highest peak temperature of 1390 °C. Although this temperature is above the melting range of the alloy (1230–1360 °C) [62], we believe a much higher temperature was produced by the electron beam to melt the powder. Nevertheless, the solidification temperature and dynamics are outside the scope of this study as our focus is on the solid-state phase transformations during deposition. It takes ∼25 s for each layer to be deposited and cooled to the build temperature. The interlayer dwell time is 125 s. The time taken for the build to cool to room temperature (RT) after final layer deposition is ∼4.7 hrs (17,000 s).
3.3.2. MatCalc simulation
During the MatCalc simulation, the matrix phase is defined as γ. γ′, and MC carbide are included as possible precipitates. The domain of these precipitates is set to be the matrix (γ), and nucleation is assumed to be homogenous. In homogeneous nucleation, all atoms of the unit volume are assumed to be potential nucleation sites. Table 3 shows the computational parameters used in the simulation. All other parameters were set at default values as recommended in the version 6.04.0011 of MatCalc. The values for the interfacial energies are automatically calculated according to the generalized nearest neighbor broken bond model and is one of the most outstanding features in MatCalc [56], [57], [58]. It should be noted that the elastic misfit strain was not included in the calculation. The output of MatCalc includes phase fraction, size, nucleation rate, and composition of the precipitates. The phase fraction in MatCalc is the volume fraction. Although the experimental phase fraction is the measured area fraction, it is relatively similar to the volume fraction. This is because of the generally larger precipitate size and similar morphology at the various locations along the build [63]. A reliable phase fraction comparison between experiment and simulation can therefore be made.
Table 3. Computational parameters used in the simulation.
γ′ = 0.080–0.140 J/m2 and MC carbide = 0.410–0.430 J/m2
3.3.2.1. Precipitate phase fraction
Fig. 5a shows the simulated phase fraction of γ′ and MC carbide during thermal cycling. Fig. 5b is a magnified view of 5a showing the simulated phase fraction at the center points of the top 70 layers, whereas Fig. 5c corresponds to the first two layers from the top. As mentioned earlier, the top layer (460th layer) represents the microstructure after solidification. The microstructure of the layers below is determined by the number of thermal cycles, which increases with distance to the top. For example, layers 459, 458, 457, up to layer 1 (region of interest) experience 1, 2, 3 and 459 thermal cycles, respectively. In the top layer in Fig. 5c, the volume fraction of γ′ and carbides increases with temperature. For γ′, it decreases to zero when the temperature is above the solvus temperature after a few seconds. Carbides, however, remain constant in their volume fraction reaching equilibrium (phase fraction ∼ 0.9%) in a short time. The topmost layer can be compared to the first deposit, and the peak in temperature symbolizes the stage where the electron beam heats the powder until melting. This means γ′ and carbide precipitation might have started in the powder particles during heating from the build temperature and electron beam until the onset of melting, where γ′ dissolves, but carbides remain stable [28].
During cooling after deposition, γ′ reprecipitates at a temperature of 1085 °C, which is below its solvus temperature. As cooling progresses, the phase fraction increases steadily to ∼27% and remains constant at 1000 °C (elevated build temperature). The calculated equilibrium fraction of phases by MatCalc is used to show the complex precipitation characteristics in this alloy. Fig. 6 shows that MC carbides form during solidification at 1320 °C, followed by γ′, which precipitate when the solidified layer cools to 1140 °C. This indicates that all deposited layers might contain a negligible amount of these precipitates before subsequent layer deposition, while being at the 1000 °C build temperature or during cooling to RT. The phase diagram also shows that the equilibrium fraction of the γ′ increases as temperature decreases. For instance, at 1000, 900, and 800 °C, the phase fractions are ∼30%, 38%, and 42%, respectively.
Deposition of subsequent layers causes previous layers to undergo phase transformations as they are exposed to several thermal cycles with different peak temperatures. In Fig. 5c, as the subsequent layer is being deposited, γ′ in the previous layer (459th layer) begins to dissolve as the temperature crosses the solvus temperature. This is witnessed by the reduction of the γ′ phase fraction. This graph also shows how this phase dissolves during heating. However, the phase fraction of MC carbide remains stable at high temperatures and no dissolution is seen during thermal cycling. Upon cooling, the γ′ that was dissolved during heating reprecipitates with a surge in the phase fraction until 1000 °C, after which it remains constant. This microstructure is similar to the solidification microstructure (layer 460), with a similar γ′ phase fraction (∼27%).
The complete dissolution and reprecipitation of γ′ continue for several cycles until the 50th layer from the top (layer 411), where the phase fraction does not reach zero during heating to the peak temperature (see Fig. 5d). This indicates the ‘partial’ dissolution of γ′, which continues progressively with additional layers. It should be noted that the peak temperatures for layers that underwent complete dissolution were much higher (1170–1300 °C) than the γ′ solvus.
The dissolution and reprecipitation of γ′ during thermal cycling are further confirmed in Fig. 7, which summarizes the nucleation rate, phase fraction, and concentration of major elements that form γ′ in the matrix. Fig. 7b magnifies a single layer (3rd layer from top) within the full dissolution region in Fig. 7a to help identify the nucleation and growth mechanisms. From Fig. 7b, γ′ nucleation begins during cooling whereby the nucleation rate increases to reach a maximum value of approximately 1 × 10²⁰ m−3s−1. This fast kinetics implies that some rearrangement of atoms is required for γ′ precipitates to form in the matrix [65], [66]. The matrix at this stage is in a non-equilibrium condition. Its composition is similar to the nominal composition and remains unchanged. The phase fraction remains insignificant at this stage although nucleation has started. The nucleation rate starts declining upon reaching the peak value. Simultaneously, diffusion-controlled growth of existing nuclei occurs, depleting the matrix of γ′ forming elements (Al and Ti). Thus, from (7), (11), ∆�vol continuously decreases until nucleation ceases. The growth of nuclei is witnessed by the increase in phase fraction until a constant level is reached at 27% upon cooling to and holding at build temperature. This nucleation event is repeated several times.
At the onset of partial dissolution, the nucleation rate jumps to 1 × 10²¹ m−3s−1, and then reduces sharply at the middle stage of partial dissolution. The nucleation rate reaches 0 at a later stage. Supplementary Fig. S1 shows a magnified view of the nucleation rate, phase fraction, and thermal profile, underpinning this trend. The jump in nucleation rate at the onset is followed by a progressive reduction in the solute content of the matrix. The peak temperatures (∼1130–1160 °C) are lower than those in complete dissolution regions but still above or close to the γ′ solvus. The maximum phase fraction (∼27%) is similar to that of the complete dissolution regions. At the middle stage, the reduction in nucleation rate is accompanied by a sharp drop in the matrix composition. The γ′ fraction drops to ∼24%, where the peak temperatures of the layers are just below or at γ′ solvus. The phase fraction then increases progressively through the later stage of partial dissolution to ∼30% towards the end of thermal cycling. The matrix solute content continues to drop although no nucleation event is seen. The peak temperatures are then far below the γ′ solvus. It should be noted that the matrix concentration after complete dissolution remains constant. Upon cooling to RT after final layer deposition, the nucleation rate increases again, indicating new nucleation events. The phase fraction reaches ∼40%, with a further depletion of the matrix in major γ′ forming elements.
3.3.2.2. γ′ size distribution
Fig. 8 shows histograms of the γ′ precipitate size distributions (PSD) along the build height during deposition. These PSDs are predicted at the end of each layer of interest just before final cooling to room temperature, to separate the role of thermal cycles from final cooling on the evolution of γ′. The PSD for the top layer (layer 460) is shown in Fig. 8a (last solidified region with solidification microstructure). The γ′ size ranges from 120 to 230 nm and is similar to the 44 layers below (2.2 mm from the top).
Further down the build, γ′ begins to coarsen after layer 417 (44th layer from top). Fig. 8c shows the PSD after the 44th layer, where the γ′ size exhibits two peaks at ∼120–230 and ∼300 nm, with most of the population being in the former range. This is the onset of partial dissolution where simultaneously with the reprecipitation and growth of fresh γ′, the undissolved γ′ grows rapidly through diffusive transport of atoms to the precipitates. This is shown in Fig. 8c, where the precipitate class sizes between 250 and 350 represent the growth of undissolved γ′. Although this continues in the 416th layer, the phase fractions plot indicates that the onset of partial dissolution begins after the 411th layer. This implies that partial dissolution started early, but the fraction of undissolved γ′ was too low to impact the phase fraction. The reprecipitated γ′ are mostly in the 100–220 nm class range and similar to those observed during full dissolution.
As the number of layers increases, coarsening intensifies with continued growth of more undissolved γ′, and reprecipitation and growth of partially dissolved ones. Fig. 8d, e, and f show this sequence. Further down the build, coarsening progresses rapidly, as shown in Figs. 8d, 8e, and 8f. The γ′ size ranges from 120 to 1100 nm, with the peaks at 160, 180, and 220 nm in Figs. 8d, 8e, and 8f, respectively. Coarsening continues until nucleation ends during dissolution, where only the already formed γ′ precipitates continue to grow during further thermal cycling. The γ′ size at this point is much larger, as observed in layers 361 and 261, and continues to increase steadily towards the bottom (layer 1). Two populations in the ranges of ∼380–700 and ∼750–1100 nm, respectively, can be seen. The steady growth of γ′ towards the bottom is confirmed by the gradual decrease in the concentration of solute elements in the matrix (Fig. 7a). It should be noted that for each layer, the γ′ class with the largest size originates from continuous growth of the earliest set of the undissolved precipitates.
Fig. 9, Fig. 10 and supplementary Figs. S2 and S3 show the γ′ size evolution during heating and cooling of a single layer in the full dissolution region, and early, middle stages, and later stages of partial dissolution, respectively. In all, the size of γ′ reduces during layer heating. Depending on the peak temperature of the layer which varies with build height, γ′ are either fully or partially dissolved as mentioned earlier. Upon cooling, the dissolved γ′ reprecipitate.
In Fig. 9, those layers that underwent complete dissolution (top layers) were held above γ′ solvus temperature for longer. In Fig. 10, layers at the early stage of partial dissolution spend less time in the γ′ solvus temperature region during heating, leading to incomplete dissolution. In such conditions, smaller precipitates are fully dissolved while larger ones shrink [67]. Layers in the middle stages of partial dissolution have peak temperatures just below or at γ′ solvus, not sufficient to achieve significant γ′ dissolution. As seen in supplementary Fig. S2, only a few smaller γ′ are dissolved back into the matrix during heating, i.e., growth of precipitates is more significant than dissolution. This explains the sharp decrease in concentration of Al and Ti in the matrix in this layer.
The previous sections indicate various phenomena such as an increase in phase fraction, further depletion of matrix composition, and new nucleation bursts during cooling. Analysis of the PSD after the final cooling of the build to room temperature allows a direct comparison to post-printing microstructural characterization. Fig. 11 shows the γ′ size distribution of layer 1 (460th layer from the top) after final cooling to room temperature. Precipitation of secondary γ′ is observed, leading to the multimodal size distribution of secondary and primary γ′. The secondary γ′ size falls within the 10–80 nm range. As expected, a further growth of the existing primary γ′ is also observed during cooling.
3.3.2.3. γ′ chemistry after deposition
Fig. 12 shows the concentration of the major elements that form γ′ (Al, Ti, and Ni) in the primary and secondary γ′ at the bottom of the build, as calculated by MatCalc. The secondary γ′ has a higher Al content (13.5–14.5 at% Al), compared to 13 at% Al in the primary γ′. Additionally, within the secondary γ′, the smallest particles (∼10 nm) have higher Al contents than larger ones (∼70 nm). In contrast, for the primary γ′, there is no significant variation in the Al content as a function of their size. The Ni concentration in secondary γ′ (71.1–72 at%) is also higher in comparison to the primary γ′ (70 at%). The smallest secondary γ′ (∼10 nm) have higher Ni contents than larger ones (∼70 nm), whereas there is no substantial change in the Ni content of primary γ′, based on their size. As expected, Ti shows an opposite size-dependent variation. It ranges from ∼ 7.7–8.7 at% Ti in secondary γ′ to ∼9.2 at% in primary γ′. Similarly, within the secondary γ′, the smallest (∼10 nm) have lower Al contents than the larger ones (∼70 nm). No significant variation is observed for Ti content in primary γ′.
4. Discussion
A combined modelling method is utilized to study the microstructural evolution during E-PBF of IN738. The presented results are discussed by examining the precipitation and dissolution mechanism of γ′ during thermal cycling. This is followed by a discussion on the phase fraction and size evolution of γ′ during thermal cycling and after final cooling. A brief discussion on carbide morphology is also made. Finally, a comparison is made between the simulation and experimental results to assess their agreement.
4.1. γ′ morphology as a function of build height
4.1.1. Nucleation of γ′
The fast precipitation kinetics of the γ′ phase enables formation of γ′ upon quenching from higher temperatures (above solvus) during thermal cycling [66]. In Fig. 7b, for a single layer in the full dissolution region, during cooling, the initial increase in nucleation rate signifies the first formation of nuclei. The slight increase in nucleation rate during partial dissolution, despite a decrease in the concentration of γ′ forming elements, may be explained by the nucleation kinetics. During partial dissolution and as the precipitates shrink, it is assumed that the regions at the vicinity of partially dissolved precipitates are enriched in γ′ forming elements [68], [69]. This differs from the full dissolution region, in which case the chemical composition is evenly distributed in the matrix. Several authors have attributed the solute supersaturation of the matrix around primary γ′ to partial dissolution during isothermal ageing [69], [70], [71], [72]. The enhanced supersaturation in the regions close to the precipitates results in a much higher driving force for nucleation, leading to a higher nucleation rate upon cooling. This phenomenon can be closely related to the several nucleation bursts upon continuous cooling of Ni-based superalloys, where second nucleation bursts exhibit higher nucleation rates [38], [68], [73], [74].
At middle stages of partial dissolution, the reduction in the nucleation rate indicates that the existing composition and low supersaturation did not trigger nucleation as the matrix was closer to the equilibrium state. The end of a nucleation burst means that the supersaturation of Al and Ti has reached a low level, incapable of providing sufficient driving force during cooling to or holding at 1000 °C for further nucleation [73]. Earlier studies on Ni-based superalloys have reported the same phenomenon during ageing or continuous cooling from the solvus temperature to RT [38], [73], [74].
4.1.2. Dissolution of γ′ during thermal cycling
γ′ dissolution kinetics during heating are fast when compared to nucleation due to exponential increase in phase transformation and diffusion activities with temperature [65]. As shown in Fig. 9, Fig. 10, and supplementary Figs. S2 and S3, the reduction in γ′ phase fraction and size during heating indicates γ′ dissolution. This is also revealed in Fig. 5 where phase fraction decreases upon heating. The extent of γ′ dissolution mostly depends on the temperature, time spent above γ′ solvus, and precipitate size[75], [76], [77]. Smaller γ′ precipitates are first to be dissolved [67], [77], [78]. This is mainly because more solute elements need to be transported away from large γ′ precipitates than from smaller ones [79]. Also, a high temperature above γ′ solvus temperature leads to a faster dissolution rate[80]. The equilibrium solvus temperature of γ′ in IN738 in our MatCalc simulation (Fig. 6) and as reported by Ojo et al. [47] is 1140 °C and 1130–1180 °C, respectively. This means the peak temperature experienced by previous layers decreases progressively from γ′ supersolvus to subsolvus, near-solvus, and far from solvus as the number of subsequent layers increases. Based on the above, it can be inferred that the degree of dissolution of γ′ contributes to the gradient in precipitate distribution.
Although the peak temperatures during later stages of partial dissolution are much lower than the equilibrium γ′ solvus, γ′ dissolution still occurs but at a significantly lower rate (supplementary Fig. S3). Wahlmann et al. [28] also reported a similar case where they observed the rapid dissolution of γ′ in CMSX-4 during fast heating and cooling cycles at temperatures below the γ′ solvus. They attributed this to the γ′ phase transformation process taking place in conditions far from the equilibrium. While the same reasoning may be valid for our study, we further believe that the greater surface area to volume ratio of the small γ′ precipitates contributed to this. This ratio means a larger area is available for solute atoms to diffuse into the matrix even at temperatures much below the solvus [81].
4.2. γ′ phase fraction and size evolution
4.2.1. During thermal cycling
In the first layer, the steep increase in γ′ phase fraction during heating (Fig. 5), which also represents γ′ precipitation in the powder before melting, has qualitatively been validated in [28]. The maximum phase fraction of 27% during the first few layers of thermal cycling indicates that IN738 theoretically could reach the equilibrium state (∼30%), but the short interlayer time at the build temperature counteracts this. The drop in phase fraction at middle stages of partial dissolution is due to the low number of γ′ nucleation sites [73]. It has been reported that a reduction of γ′ nucleation sites leads to a delay in obtaining the final volume fraction as more time is required for γ′ precipitates to grow and reach equilibrium [82]. This explains why even upon holding for 150 s before subsequent layer deposition, the phase fraction does not increase to those values that were observed in the previous full γ′ dissolution regions. Towards the end of deposition, the increase in phase fraction to the equilibrium value of 30% is as a result of the longer holding at build temperature or close to it [83].
During thermal cycling, γ′ particles begin to grow immediately after they first precipitate upon cooling. This is reflected in the rapid increase in phase fraction and size during cooling in Fig. 5 and supplementary Fig. S2, respectively. The rapid growth is due to the fast diffusion of solute elements at high temperatures [84]. The similar size of γ′ for the first 44 layers from the top can be attributed to the fact that all layers underwent complete dissolution and hence, experienced the same nucleation event and growth during deposition. This corresponds with the findings by Balikci et al. [85], who reported that the degree of γ′ precipitation in IN738LC does not change when a solution heat treatment is conducted above a certain critical temperature.
The increase in coarsening rate (Fig. 8) during thermal cycling can first be ascribed to the high peak temperature of the layers [86]. The coarsening rate of γ′ is known to increase rapidly with temperature due to the exponential growth of diffusion activity. Also, the simultaneous dissolution with coarsening could be another reason for the high coarsening rate, as γ′ coarsening is a diffusion-driven process where large particles grow by consuming smaller ones [78], [84], [86], [87]. The steady growth of γ′ towards the bottom of the build is due to the much lower layer peak temperature, which is almost close to the build temperature, and reduced dissolution activity, as is seen in the much lower solute concentration in γ′ compared to those in the full and partial dissolution regions.
4.2.2. During cooling
The much higher phase fraction of ∼40% upon cooling signifies the tendency of γ′ to reach equilibrium at lower temperatures (Fig. 4). This is due to the precipitation of secondary γ′ and a further increase in the size of existing primary γ′, which leads to a multimodal size distribution of γ′ after cooling [38], [73], [88], [89], [90]. The reason for secondary γ′ formation during cooling is as follows: As cooling progresses, it becomes increasingly challenging to redistribute solute elements in the matrix owing to their lower mobility [38], [73]. A higher supersaturation level in regions away from or free of the existing γ′ precipitates is achieved, making them suitable sites for additional nucleation bursts. More cooling leads to the growth of these secondary γ′ precipitates, but as the temperature and in turn, the solute diffusivity is low, growth remains slow.
4.3. Carbides
MC carbides in IN738 are known to have a significant impact on the high-temperature strength. They can also act as effective hardening particles and improve the creep resistance [91]. Precipitation of MC carbides in IN738 and several other superalloys is known to occur during solidification or thermal treatments (e.g., hot isostatic pressing) [92]. In our case, this means that the MC carbides within the E-PBF build formed because of the thermal exposure from the E-PBF thermal cycle in addition to initial solidification. Our simulation confirms this as MC carbides appear during layer heating (Fig. 5). The constant and stable phase fraction of MC carbides during thermal cycling can be attributed to their high melting point (∼1360 °C) and the short holding time at peak temperatures [75], [93], [94]. The solvus temperature for most MC carbides exceeds most of the peak temperatures observed in our simulation, and carbide dissolution kinetics at temperatures above the solvus are known to be comparably slow [95]. The stable phase fraction and random distribution of MC carbides signifies the slight influence on the gradient in hardness.
4.4. Comparison of simulations and experiments
4.4.1. Precipitate phase fraction and morphology as a function of build height
A qualitative agreement is observed for the phase fraction of carbides, i.e. ∼0.8% in the experiment and ∼0.9% in the simulation. The phase fraction of γ′ differs, with the experiment reporting a value of ∼51% and the simulation, 40%. Despite this, the size distribution of primary γ′ along the build shows remarkable consistency between experimental and computational analyses. It is worth noting that the primary γ′ morphology in the experimental analysis is observed in the as-fabricated state, whereas the simulation (Fig. 8) captures it during deposition process. The primary γ′ size in the experiment is expected to experience additional growth during the cooling phase. Regardless, both show similar trends in primary γ′ size increments from the top to the bottom of the build. The larger primary γ’ size in the simulation versus the experiment can be attributed to the fact that experimental and simulation results are based on 2D and 3D data, respectively. The absence of stereological considerations [96] in our analysis could have led to an underestimation of the precipitate sizes from SEM measurements. The early starts of coarsening (8th layer) in the experiment compared to the simulation (45th layer) can be attributed to a higher actual γ′ solvus temperature than considered in our simulation [47]. The solvus temperature of γ′ in a Ni-based superalloy is mainly determined by the detailed composition. A high amount of Cr and Co are known to reduce the solvus temperature, whereas Ta and Mo will increase it [97], [98], [99]. The elemental composition from our experimental work was used for the simulation except for Ta. It should be noted that Ta is not included in the thermodynamic database in MatCalc used, and this may have reduced the solvus temperature. This could also explain the relatively higher γ′ phase fraction in the experiment than in simulation, as a higher γ′ solvus temperature will cause more γ′ to precipitate and grow early during cooling [99], [100].
Another possible cause of this deviation can be attributed to the extent of γ′ dissolution, which is mainly determined by the peak temperature. It can be speculated that individual peak temperatures at different layers in the simulation may have been over-predicted. However, one needs to consider that the true thermal profile is likely more complicated in the actual E-PBF process [101]. For example, the current model assumes that the thermophysical properties of the material are temperature-independent, which is not realistic. Many materials, including IN738, exhibit temperature-dependent properties such as thermal conductivity, specific heat capacity, and density [102]. This means that heat transfer simulations may underestimate or overestimate the temperature gradients and cooling rates within the powder bed and the solidified part. Additionally, the model does not account for the reduced thermal diffusivity through unmelted powder, where gas separating the powder acts as insulation, impeding the heat flow [1]. In E-PBF, the unmelted powder regions with trapped gas have lower thermal diffusivity compared to the fully melted regions, leading to localized temperature variations, and altered solidification behavior. These limitations can impact the predictions, particularly in relation to the carbide dissolution, as the peak temperatures may be underestimated.
While acknowledging these limitations, it is worth emphasizing that achieving a detailed and accurate representation of each layer’s heat source would impose tough computational challenges. Given the substantial layer count in E-PBF, our decision to employ a semi-analytical approximation strikes a balance between computational feasibility and the capture of essential trends in thermal profiles across diverse build layers. In future work, a dual-calibration strategy is proposed to further reduce simulation-experiment disparities. By refining temperature-independent thermophysical property approximations and absorptivity in the heat source model, and by optimizing interfacial energy descriptions in the kinetic model, the predictive precision could be enhanced. Further refining the simulation controls, such as adjusting the precipitate class size may enhance quantitative comparisons between modeling outcomes and experimental data in future work.
4.4.2. Multimodal size distribution of γ′ and concentration
Another interesting feature that sees qualitative agreement between the simulation and the experiment is the multimodal size distribution of γ′. The formation of secondary γ′ particles in the experiment and most E-PBF Ni-based superalloys is suggested to occur at low temperatures, during final cooling to RT [16], [73], [90]. However, so far, this conclusion has been based on findings from various continuous cooling experiments, as the study of the evolution during AM would require an in-situ approach. Our simulation unambiguously confirms this in an AM context by providing evidence for secondary γ′ precipitation during slow cooling to RT. Additionally, it is possible to speculate that the chemical segregation occurring during solidification, due to the preferential partitioning of certain elements between the solid and liquid phases, can contribute to the multimodal size distribution during deposition [51]. This is because chemical segregation can result in variations in the local composition of superalloys, which subsequently affects the nucleation and growth of γ′. Regions with higher concentrations of alloying elements will encourage the formation of larger γ′ particles, while regions with lower concentrations may favor the nucleation of smaller precipitates. However, it is important to acknowledge that the elevated temperature during the E-PBF process will largely homogenize these compositional differences [103], [104].
A good correlation is also shown in the composition of major γ′ forming elements (Al and Ti) in primary and secondary γ′. Both experiment and simulation show an increasing trend for Al content and a decreasing trend for Ti content from primary to secondary γ′. The slight composition differences between primary and secondary γ′ particles are due to the different diffusivity of γ′ stabilizers at different thermal conditions [105], [106]. As the formation of multimodal γ′ particles with different sizes occurs over a broad temperature range, the phase chemistry of γ′ will be highly size dependent. The changes in the chemistry of various γ′ (primary, secondary, and tertiary) have received significant attention since they have a direct influence on the performance [68], [105], [107], [108], [109]. Chen et al. [108], [109], reported a high Al content in the smallest γ′ precipitates compared to the largest, while Ti showed an opposite trend during continuous cooling in a RR1000 Ni-based superalloy. This was attributed to the temperature and cooling rate at which the γ′ precipitates were formed. The smallest precipitates formed last, at the lowest temperature and cooling rate. A comparable observation is evident in the present investigation, where the secondary γ′ forms at a low temperature and cooling rate in comparison to the primary. The temperature dependence of γ′ chemical composition is further evidenced in supplementary Fig. S4, which shows the equilibrium chemical composition of γ′ as a function of temperature.
5. Conclusions
A correlative modelling approach capable of predicting solid-state phase transformations kinetics in metal AM was developed. This approach involves computational simulations with a semi-analytical heat transfer model and the MatCalc thermo-kinetic software. The method was used to predict the phase transformation kinetics and detailed morphology and chemistry of γ′ and MC during E-PBF of IN738 Ni-based superalloy. The main conclusions are:
1.The computational simulations are in qualitative agreement with the experimental observations. This is particularly true for the γ′ size distribution along the build height, the multimodal size distribution of particles, and the phase fraction of MC carbides.
2.The deviations between simulation and experiment in terms of γ′ phase fraction and location in the build are most likely attributed to a higher γ′ solvus temperature during the experiment than in the simulation, which is argued to be related to the absence of Ta in the MatCalc database.
3.The dissolution and precipitation of γ′ occur fast and under non-equilibrium conditions. The level of γ′ dissolution determines the gradient in γ′ size distribution along the build. After thermal cycling, the final cooling to room temperature has further significant impacts on the final γ′ size, morphology, and distribution.
4.A negligible amount of γ′ forms in the first deposited layer before subsequent layer deposition, and a small amount of γ′ may also form in the powder induced by the 1000 °C elevated build temperature before melting.
Our findings confirm the suitability of MatCalc to predict the microstructural evolution at various positions throughout a build in a Ni-based superalloy during E-PBF. It also showcases the suitability of a tool which was originally developed for traditional thermo-mechanical processing of alloys to the new additive manufacturing context. Our simulation capabilities are likely extendable to other alloy systems that undergo solid-state phase transformations implemented in MatCalc (various steels, Ni-based superalloys, and Al-alloys amongst others) as well as other AM processes such as L-DED and L-PBF which have different thermal cycle characteristics. New tools to predict the microstructural evolution and properties during metal AM are important as they provide new insights into the complexities of AM. This will enable control and design of AM microstructures towards advanced materials properties and performances.
The authors declare that they have no known competing financial interests or personal relationships that could have appeared to influence the work reported in this paper.
Acknowledgements
This research was sponsored by the Department of Industry, Innovation, and Science under the auspices of the AUSMURI program – which is a part of the Commonwealth’s Next Generation Technologies Fund. The authors acknowledge the facilities and the scientific and technical assistance at the Electron Microscope Unit (EMU) within the Mark Wainwright Analytical Centre (MWAC) at UNSW Sydney and Microscopy Australia. Nana Adomako is supported by a UNSW Scientia PhD scholarship. Michael Haines’ (UNSW Sydney) contribution to the revised version of the original manuscript is thankfully acknowledged.
[1]T. Debroy, H.L. Wei, J.S. Zuback, T. Mukherjee, J.W. Elmer, J.O. Milewski, A.M. Beese, A. Wilson-heid, A. De, W. ZhangAdditive manufacturing of metallic components – process, structure and propertiesProg. Mater. Sci., 92 (2018), pp. 112-224, 10.1016/j.pmatsci.2017.10.001View PDFView articleView in ScopusGoogle Scholar
[4]N.K. Adomako, J.J. Lewandowski, B.M. Arkhurst, H. Choi, H.J. Chang, J.H. KimMicrostructures and mechanical properties of multi-layered materials composed of Ti-6Al-4V, vanadium, and 17–4PH stainless steel produced by directed energy depositionAddit. Manuf., 59 (2022), Article 103174, 10.1016/j.addma.2022.103174View PDFView articleView in ScopusGoogle Scholar
[5]H. Wang, Z.G. Zhu, H. Chen, A.G. Wang, J.Q. Liu, H.W. Liu, R.K. Zheng, S.M.L. Nai, S. Primig, S.S. Babu, S.P. Ringer, X.Z. LiaoEffect of cyclic rapid thermal loadings on the microstructural evolution of a CrMnFeCoNi high-entropy alloy manufactured by selective laser meltingActa Mater., 196 (2020), pp. 609-625, 10.1016/J.ACTAMAT.2020.07.006View PDFView articleView in ScopusGoogle Scholar
[10]S.S. Al-Bermani, M.L. Blackmore, W. Zhang, I. ToddThe origin of microstructural diversity, texture, and mechanical properties in electron beam melted Ti-6Al-4VMetall. Mater. Trans. A Phys. Metall. Mater. Sci., 41 (2010), pp. 3422-3434, 10.1007/s11661-010-0397-xView article View in ScopusGoogle Scholar
[13]H. Helmer, A. Bauereiß, R.F. Singer, C. KörnerErratum to: ‘Grain structure evolution in Inconel 718 during selective electron beam melting’ (Materials Science & Engineering A (2016) 668 (180–187 (S0921509316305536) (10.1016/j.msea.2016.05.046))Mater. Sci. Eng. A., 676 (2016), p. 546, 10.1016/j.msea.2016.09.016View PDFView articleView in ScopusGoogle Scholar
[16]N. Haghdadi, E. Whitelock, B. Lim, H. Chen, X. Liao, S.S. Babu, S.P. Ringer, S. PrimigMultimodal γ′ precipitation in Inconel-738 Ni-based superalloy during electron-beam powder bed fusion additive manufacturingJ. Mater. Sci., 55 (2020), pp. 13342-13350, 10.1007/s10853-020-04915-wView article View in ScopusGoogle Scholar
[17]B. Lim, H. Chen, Z. Chen, N. Haghdadi, X. Liao, S. Primig, S.S. Babu, A. Breen, S.P. RingerMicrostructure–property gradients in Ni-based superalloy (Inconel 738) additively manufactured via electron beam powder bed fusionAddit. Manuf. (2021), Article 102121, 10.1016/j.addma.2021.102121View PDFView articleView in ScopusGoogle Scholar
[18]P. Karimi, E. Sadeghi, P. Åkerfeldt, J. Ålgårdh, J. AnderssonInfluence of successive thermal cycling on microstructure evolution of EBM-manufactured alloy 718 in track-by-track and layer-by-layer designMater. Des., 160 (2018), pp. 427-441, 10.1016/j.matdes.2018.09.038View PDFView articleView in ScopusGoogle Scholar
[19]E. Chauvet, P. Kontis, E.A. Jägle, B. Gault, D. Raabe, C. Tassin, J.J. Blandin, R. Dendievel, B. Vayre, S. Abed, G. MartinHot cracking mechanism affecting a non-weldable Ni-based superalloy produced by selective electron Beam MeltingActa Mater., 142 (2018), pp. 82-94, 10.1016/j.actamat.2017.09.047View PDFView articleView in ScopusGoogle Scholar
[20]M. Ramsperger, R.F. Singer, C. KörnerMicrostructure of the nickel-base superalloy CMSX-4 fabricated by selective electron beam meltingMetall. Mater. Trans. A Phys. Metall. Mater. Sci., 47 (2016), pp. 1469-1480, 10.1007/s11661-015-3300-y View PDF This article is free to access.View in ScopusGoogle Scholar
[21]B. Zhang, P. Wang, Y. Chew, Y. Wen, M. Zhang, P. Wang, G. Bi, J. WeiMechanical properties and microstructure evolution of selective laser melting Inconel 718 along building direction and sectional dimensionMater. Sci. Eng. A, 794 (2020), Article 139941, 10.1016/j.msea.2020.139941View PDFView articleView in ScopusGoogle Scholar
[22]C. Körner, M. Ramsperger, C. Meid, D. Bürger, P. Wollgramm, M. Bartsch, G. EggelerMicrostructure and mechanical properties of CMSX-4 single crystals prepared by additive manufacturingMetall. Mater. Trans. A Phys. Metall. Mater. Sci., 49 (2018), pp. 3781-3792, 10.1007/s11661-018-4762-5 View PDF This article is free to access.View in ScopusGoogle Scholar
[23]B. Lim, H. Chen, K. Nomoto, Z. Chen, A.I. Saville, S. Vogel, A.J. Clarke, A. Paradowska, M. Reid, S. Primig, X. Liao, S.S. Babu, A.J. Breen, S.P. RingerAdditively manufactured Haynes-282 monoliths containing thin wall struts of varying thicknessesAddit. Manuf., 59 (2022), Article 103120, 10.1016/j.addma.2022.103120View PDFView articleView in ScopusGoogle Scholar
[24]C.L.A. Leung, S. Marussi, R.C. Atwood, M. Towrie, P.J. Withers, P.D. LeeIn situ X-ray imaging of defect and molten pool dynamics in laser additive manufacturingNat. Commun., 9 (2018), pp. 1-9, 10.1038/s41467-018-03734-7 View PDF This article is free to access.View in ScopusGoogle Scholar
[25]C. Zhao, K. Fezzaa, R.W. Cunningham, H. Wen, F. De Carlo, L. Chen, A.D. Rollett, T. SunReal-time monitoring of laser powder bed fusion process using high-speed X-ray imaging and diffractionSci. Rep., 7 (2017), pp. 1-11, 10.1038/s41598-017-03761-2 View PDF This article is free to access.View in ScopusGoogle Scholar
[26]C. Kenel, D. Grolimund, X. Li, E. Panepucci, V.A. Samson, D.F. Sanchez, F. Marone, C. LeinenbachIn situ investigation of phase transformations in Ti-6Al-4V under additive manufacturing conditions combining laser melting and high-speed micro-X-ray diffractionSci. Rep., 7 (2017), pp. 1-10, 10.1038/s41598-017-16760-0 View PDF This article is free to access.Google Scholar
[27]W.L. Bevilaqua, J. Epp, H. Meyer, J. Dong, H. Roelofs, A. da, S. Rocha, A. RegulyRevealing the dynamic transformation of austenite to bainite during uniaxial warm compression through in-situ synchrotron X-ray diffractionMetals, 11 (2021), pp. 1-14, 10.3390/met11030467View article View in ScopusGoogle Scholar
[28]B. Wahlmann, E. Krohmer, C. Breuning, N. Schell, P. Staron, E. Uhlmann, C. KörnerIn situ observation of γ′ phase transformation dynamics during selective laser melting of CMSX-4Adv. Eng. Mater., 23 (2021), 10.1002/adem.202100112 View PDF This article is free to access.Google Scholar
[35]M.J. Anderson, J. Benson, J.W. Brooks, B. Saunders, H.C. BasoaltoPredicting precipitation kinetics during the annealing of additive manufactured Inconel 625 componentsIntegr. Mater. Manuf. Innov., 8 (2019), pp. 154-166, 10.1007/S40192-019-00134-7/FIGURES/11 View PDFThis article is free to access.View in ScopusGoogle Scholar
[36]H.C. Basoalto, C. Panwisawas, Y. Sovani, M.J. Anderson, R.P. Turner, B. Saunders, J.W. BrooksA computational study on the three-dimensional printability of precipitate-strengthened nickel-based superalloysProc. R. Soc. A, 474 (2018), 10.1098/RSPA.2018.0295View article Google Scholar
[37]K. McNamara, Y. Ji, F. Lia, P. Promoppatum, S.C. Yao, H. Zhou, Y. Wang, L.Q. Chen, R.P. MartukanitzPredicting phase transformation kinetics during metal additive manufacturing using non-isothermal Johnson-Mehl-Avrami models: application to Inconel 718 and Ti-6Al-4VAddit. Manuf., 49 (2022), Article 102478, 10.1016/J.ADDMA.2021.102478View PDFView articleView in ScopusGoogle Scholar
[39]A. Drexler, B. Oberwinkler, S. Primig, C. Turk, E. Povoden-karadeniz, A. Heinemann, W. Ecker, M. StockingerMaterials Science & Engineering A Experimental and numerical investigations of the γ ″ and γ ′ precipitation kinetics in Alloy 718Mater. Sci. Eng. A., 723 (2018), pp. 314-323, 10.1016/j.msea.2018.03.013View PDFView articleView in ScopusGoogle Scholar
[44]A.V. Sotov, A.V. Agapovichev, V.G. Smelov, V.V. Kokareva, M.O. Dmitrieva, A.A. Melnikov, S.P. Golanov, Y.M. AnurovInvestigation of the IN-738 superalloy microstructure and mechanical properties for the manufacturing of gas turbine engine nozzle guide vane by selective laser meltingInt. J. Adv. Manuf. Technol., 107 (2020), pp. 2525-2535, 10.1007/s00170-020-05197-xView article View in ScopusGoogle Scholar
[49]S. Sanchez, P. Smith, Z. Xu, G. Gaspard, C.J. Hyde, W.W. Wits, I.A. Ashcroft, H. Chen, A.T. ClarePowder Bed Fusion of nickel-based superalloys: a reviewInt. J. Mach. Tools Manuf., 165 (2021), 10.1016/j.ijmachtools.2021.103729 View PDF This article is free to access.Google Scholar
[50]C.L.A. Leung, R. Tosi, E. Muzangaza, S. Nonni, P.J. Withers, P.D. LeeEffect of preheating on the thermal, microstructural and mechanical properties of selective electron beam melted Ti-6Al-4V componentsMater. Des., 174 (2019), Article 107792, 10.1016/j.matdes.2019.107792View PDFView articleView in ScopusGoogle Scholar
[51]S. Griffiths, H. Ghasemi Tabasi, T. Ivas, X. Maeder, A. De Luca, K. Zweiacker, R. Wróbel, J. Jhabvala, R.E. Logé, C. LeinenbachCombining alloy and process modification for micro-crack mitigation in an additively manufactured Ni-base superalloyAddit. Manuf., 36 (2020), 10.1016/j.addma.2020.101443View article Google Scholar
[52]P. Soille, L. Vincent Pierre Soille, L.M. Vincent, Determining watersheds in digital pictures via flooding simulations, Https://Doi.Org/10.1117/12.24211. 1360 (1990) 240–250. https://doi.org/10.1117/12.24211.Google Scholar
[53]ASTM Standard Test Method for Microindentation Hardness of MaterialsKnoop and Vickers Hardness of Materials 1, Annu. B ASTM Stand. i 2010 1 42.Google Scholar
[56]B. Sonderegger, E. KozeschnikGeneralized nearest-neighbor broken-bond analysis of randomly oriented coherent interfaces in multicomponent Fcc and Bcc structuresMetall. Mater. Trans. A Phys. Metall. Mater. Sci., 40 (2009), pp. 499-510, 10.1007/S11661-008-9752-6/FIGURES/8View articleView in ScopusGoogle Scholar
[58]B. Sonderegger, E. KozeschnikInterfacial energy of diffuse phase boundaries in the generalized broken-bond approachMetall. Mater. Trans. A Phys. Metall. Mater. Sci., 41 (2010), pp. 3262-3269, 10.1007/S11661-010-0370-8/FIGURES/4View articleView in ScopusGoogle Scholar
[67]P. Strunz, M. Petrenec, J. Polák, U. Gasser, G. FarkasFormation and dissolution of’ precipitates in IN792 superalloy at elevated temperaturesMetals, 6 (2016), 10.3390/met6020037View article Google Scholar
[68]A.R.P. Singh, S. Nag, J.Y. Hwang, G.B. Viswanathan, J. Tiley, R. Srinivasan, H.L. Fraser, R. BanerjeeInfluence of cooling rate on the development of multiple generations of γ′ precipitates in a commercial nickel base superalloyMater. Charact., 62 (2011), pp. 878-886, 10.1016/j.matchar.2011.06.002View PDFView articleView in ScopusGoogle Scholar
[69]E. Balikci, A. Raman, R. MirshamsMicrostructure evolution in polycrystalline IN738LC in the range 1120 to 1250C, Zeitschrift FuerMet, 90 (1999), pp. 132-140View in ScopusGoogle Scholar
[71]Ł. Rakoczy, M. Grudzień-Rakoczy, F. Hanning, G. Cempura, R. Cygan, J. Andersson, A. Zielińska-LipiecInvestigation of the γ′ precipitates dissolution in a Ni-based superalloy during stress-free short-term annealing at high homologous temperaturesMetall. Mater. Trans. A Phys. Metall. Mater. Sci., 52 (2021), pp. 4767-4784, 10.1007/s11661-021-06420-4 View PDF This article is free to access.View in ScopusGoogle Scholar
[73]F. Masoumi, D. Shahriari, M. Jahazi, J. Cormier, A. DevauxKinetics and Mechanisms of γ′ Reprecipitation in a Ni-based SuperalloySci. Rep., 6 (2016), pp. 1-16, 10.1038/srep28650View articleGoogle Scholar
[74]A.R.P. Singh, S. Nag, S. Chattopadhyay, Y. Ren, J. Tiley, G.B. Viswanathan, H.L. Fraser, R. BanerjeeMechanisms related to different generations of γ′ precipitation during continuous cooling of a nickel base superalloyActa Mater., 61 (2013), pp. 280-293, 10.1016/j.actamat.2012.09.058View PDFView articleView in ScopusGoogle Scholar
[76]N.D. Souza, M.C. Hardy, B. Roebuck, W.E.I. Li, G.D. West, D.M. Collins, On the Rate Dependence of Precipitate Formation and Dissolution in a Nickel-Base Superalloy, Metall. Mater. Trans. A. (n.d.). https://doi.org/10.1007/s11661–022-06680–8.Google Scholar
[79]H. Huang, G. Liu, H. Wang, A. Ullah, B. HuDissolution behavior and kinetics of γ′ phase during solution treatment in powder metallurgy nickel-based superalloyMetall. Mater. Trans. A Phys. Metall. Mater. Sci., 51 (2020), pp. 1075-1084, 10.1007/s11661-019-05581-7View article View in ScopusGoogle Scholar
[80]A.J. Goodfellow, E.I. Galindo-Nava, K.A. Christofidou, N.G. Jones, T. Martin, P.A.J. Bagot, C.D. Boyer, M.C. Hardy, H.J. StoneGamma prime precipitate evolution during aging of a model nickel-based superalloyMetall. Mater. Trans. A Phys. Metall. Mater. Sci., 49 (2018), pp. 718-728, 10.1007/s11661-017-4336-y View PDF This article is free to access.View in ScopusGoogle Scholar
[81]T.P. Gabb, D.G. Backman, D.Y. Wei, D.P. Mourer, D. Furrer, A. Garg, D.L. Ellis, #947;’ Form. a Nickel-Base Disk Superalloy 2012 405 414 doi: 10.7449/2000/superalloys_2000_405_414.Google Scholar
[82]A. PlatiModelling of γ precipitation in superalloys University of CambridgeMater. Sci. (2003), p. 73Google Scholar
[91]F. Theska, W.F. Tse, B. Schulz, R. Buerstmayr, S.R. Street, M. Lison-Pick, S. PrimigReview of microstructure–mechanical property relationships in cast and wrought ni-based superalloys with boron, carbon, and zirconium microalloying additionsAdv. Eng. Mater. (2022), p. 2201514, 10.1002/ADEM.202201514 View PDF This article is free to access.Google Scholar
[93]L. Zhang, Y. Li, Q. Zhang, S. ZhangMicrostructure evolution, phase transformation and mechanical properties of IN738 superalloy fabricated by selective laser melting under different heat treatmentsMater. Sci. Eng. A, 844 (2022), Article 142947, 10.1016/j.msea.2022.142947View PDFView articleView in ScopusGoogle Scholar
[94]J.C. Franco-Correa, E. Martínez-Franco, J.M. Alvarado-Orozco, L.A. Cáceres-Díaz, D.G. Espinosa-Arbelaez, J.A. VilladaEffect of conventional heat treatments on the microstructure and microhardness of IN718 obtained by wrought and additive manufacturingJ. Mater. Eng. Perform., 30 (2021), pp. 7035-7045, 10.1007/s11665-021-06138-9View article View in ScopusGoogle Scholar
[96]N. Li, M.J. Anderson, H.C. BasoaltoAutomated stereology and uncertainty quantification considering spherical non-penetrating dispersionsPage 464.Cryst 2023, Vol. 13 (13) (2023), p. 464, 10.3390/CRYST13030464View article Google Scholar
[97]W.T. Loomis, J.W. Freeman, D.L. SponsellerInfluence of molybdenum on the γ′- phase in experimental nickelbase superalloysMet. Trans., 3 (1972), pp. 989-1000Google Scholar
[98]A.S. Shaikh Development of a γ’ Precipitation Hardening Ni-Base Superalloy for Additive Manufacturing Thesis 2018 102.〈https://odr.chalmers.se/handle/20.500.12380/255645%0Ahttps://www.researchgate.net/profile/Abdul_Shaafi_Shaikh2/publication/326226200%0Ahttps://drive.google.com/open?id=1BIez-aJyBTjnSgazzzTvv3jlrYpFC0N-〉.Google Scholar
[102]P.N. Quested, R.F. Brooks, L. Chapman, R. Morrell, Y. Youssef, K.C. MillsMeasurement and estimation of thermophysical properties of nickel based superalloysMater. Sci. Technol., 25 (2009), pp. 154-162, 10.1179/174328408×361454View articleView in ScopusGoogle Scholar
Thermo-fluid modeling of influence of attenuated laser beam intensity profile on melt pool behavior in laser-assisted powder-based direct energy deposition
Mohammad Sattari, Amin Ebrahimi, Martin Luckabauer, Gert-willem R.B.E. Römer
A numerical framework based on computational fluid dynamics (CFD), using the finite volume method (FVM) and volume of fluid (VOF) technique is presented to investigate the effect of the laser beam intensity profile on melt pool behavior in laser-assisted powder-based directed energy deposition (L-DED). L-DED is an additive manufacturing (AM) process that utilizes a laser beam to fuse metal powder particles. To assure high-fidelity modeling, it was found that it is crucial to accurately model the interaction between the powder stream and the laser beam in the gas region above the substrate. The proposed model considers various phenomena including laser energy attenuation and absorption, multiple reflections of the laser rays, powder particle stream, particle-fluid interaction, temperature-dependent properties, buoyancy effects, thermal expansion, solidification shrinkage and drag, and Marangoni flow. The latter is induced by temperature and element-dependent surface tension. The model is validated using experimental results and highlights the importance of considering laser energy attenuation. Furthermore, the study investigates how the laser beam intensity profile affects melt pool size and shape, influencing the solidification microstructure and mechanical properties of the deposited material. The proposed model has the potential to optimize the L-DED process for a variety of materials and provides insights into the capability of numerical modeling for additive manufacturing optimization.
As a highly efficient thick plate welding resolution, narrow gap gas tungsten arc welding (NG-GTAW) is in the face of a series of problems like inter-layer defects like pores, lack of fusion, inclusion of impurity, and the sensitivity to poor sidewall fusion, which is hard to be repaired after the welding process. This study employs numerical simulation to investigate the molten pool behavior in NG-GTAW root welding. A 3D numerical model was established, where a body-fitted coordinate system was applied to simulate the electromagnetic force, and a bridge transition model was developed to investigate the wire–feed root welding. The simulated results were validated experimentally. Results show that the molten pool behavior is dominated by electromagnetic force when the welding current is relatively high, and the dynamic change of the vortex actually determines the molten pool morphology. For self-fusion welding, there are two symmetric inward vortices in the cross-section and one clockwise vortex in the longitudinal section. With the increasing welding current, the vortices in the cross-section gradually move to the arc center with a decreasing range, while the vortex in the longitudinal section moves backward. With the increasing traveling speed, the vortices in the cross-section move toward the surface of the molten pool with a decreasing range, and the horizontal component of liquid metal velocity changes in the longitudinal section. For wire–feed welding, the filling metal strengthens the downward velocity component; as a result, the vortex formation is blocked in the cross-section and is strengthened in the longitudinal section.
The raw/processed data required cannot be shared at this time as the data also forms part of an ongoing study.
References
Wang X, Nan Y, Xie Z, Tsai Y, Yang J, Shang C (2017) Influence of welding pass on microstructure and toughness in the reheated zone of multi-pass weld metal of 550 MPa offshore engineering steel. Mater Sci Eng : A 702:196–205. https://doi.org/10.1016/j.msea.2017.06.081ArticleGoogle Scholar
Mitra A, Rajan Babu V, Puthiyavinayagam P, Varier NV, Ghosh M, Desai H, Chellapandi P, Chetal SC (2012) Design and development of thick plate concept for rotatable plugs and technology development for future Indian FBR. Nucl Eng Des 246:245–255. https://doi.org/10.1016/j.nucengdes.2012.01.008ArticleGoogle Scholar
Alemdar ASA, Jalal SR, Mulapeer MMS (2022) Influence of friction stir welding process on the mechanical characteristics of the hybrid joints aa2198-t8 to aa2024-t3. Adv Mater Sci Eng 2022:1–11. https://doi.org/10.1155/2022/7055446ArticleGoogle Scholar
Ohnishi T, Kawahito Y, Mizutani M, Katayama S (2013) Butt welding of thick, high strength steel plate with a high power laser and hot wire to improve tolerance to gap variance and control weld metal oxygen content. Sci Technol Welding Join 18:314–322. https://doi.org/10.1179/1362171813Y.0000000108ArticleGoogle Scholar
Miao R, Shan Z, Zhou Q, Wu Y, Ge L, Zhang J, Hu H (2022) Real-time defect identification of narrow overlap welds and application based on convolutional neural networks. J Manuf Syst 62:800–810. https://doi.org/10.1016/j.jmsy.2021.01.012ArticleGoogle Scholar
Mikihito H, Yoshito I (2016) A simplified Fe simulation method with shell element for welding deformation and residual stress generated by multi-pass butt welding. Int J Steel Struct 16:51–58. https://doi.org/10.1007/s13296-016-3005-0ArticleGoogle Scholar
Cai W, Saez M, Spicer P, Chakraborty D, Skurkis R, Carlson B, Okigami F, Robertson J (2023) Distortion simulation of gas metal arc welding (gmaw) processes for automotive body assembly. Weld World 67:109–139. https://doi.org/10.1007/s40194-022-01369-3ArticleGoogle Scholar
Pazilova UA, Il In AV, Kruglova AA, Motovilina GD, Khlusova EI (2015) Influence of the temperature and strain rate on the structure and fracture mode of high-strength steels upon the simulation of the thermal cycle of welding and post-welding tempering. Phys Metals Metallogr 116:606–614. https://doi.org/10.1134/S0031918X1506006XArticleGoogle Scholar
Zeng Z, Wang Z, Hu S, Wu S (2022) Dynamic molten pool behavior of pulsed gas tungsten arc welding with filler wire in horizontal position and its characterization based on arc voltage. J Manuf Proc 75:1–12. https://doi.org/10.1016/j.jmapro.2021.12.051ArticleGoogle Scholar
Ma C, Chen B, Meng Z, Tan C, Song X, Li Y (2023) Characteristic of keyhole, molten pool and microstructure of oscillating laser TIG hybrid welding. Optics Laser Technol. https://doi.org/10.1016/j.optlastec.2023.109142.161:109142
Meng X, Artinov A, Bachmann M, Üstündağ Ö, Gumenyuk A, Rethmeier M (2022) The detrimental molten pool narrowing phenomenon in wire feed laser beam welding and its suppression by magnetohydrodynamic technique. Int J Heat Mass Transf 193:122913. https://doi.org/10.1016/j.ijheatmasstransfer.2022.122913ArticleGoogle Scholar
Li X, Wei X, Zhang L, Lv Q (2023) Numerical simulation for the effect of scanning speed and in situ laser shock peening on molten pool and solidification characteristics. Int J Adv Manuf Technol 125:5031–5046. https://doi.org/10.1007/s00170-023-10897-1ArticleGoogle Scholar
Ye W, Bao J, Lei J Huang Y, Li Z, Li P, Zhang Y (2022) Multiphysics modeling of thermal behavior of commercial pure titanium powder during selective laser melting. Met Mater Int 28:282-296. https://doi.org/10.1007/s12540-021-01019-1.
Cheng H, Kang L, Wang C, Li Q, Chang B, Chang B (2022) Dynamic behavior of molten pool backside during full-penetration laser welding of Ni-based superalloys. Int J Adv Manuf Technol 119:4587–4598. https://doi.org/10.1007/s00170-021-08187-9ArticleGoogle Scholar
The elimination of internal macro-defects is a key issue in Ti–6Al–4V alloys fabricated via powder bed fusion using electron beams (PBF-EB), wherein internal macro-defects mainly originate from the virgin powder and inappropriate printing parameters. This study compares different types powders by combining support vector machine techniques to determine the most suitable powder for PBF-EB and to predict the processing window for the printing parameters without internal macro-defects. The results show that powders fabricated via plasma rotating electrode process have the best sphericity, flowability, and minimal porosity and are most suitable for printing. Surface roughness criterion was also applied to determine the quality of the even surfaces, and support vector machine was used to construct processing maps capable of predicting a wide range of four-dimensional printing parameters to obtain macro-defect-free samples, offering the possibility of subsequent development of Ti–6Al–4V alloys with excellent properties. The macro-defect-free samples exhibited good elongation, with the best overall mechanical properties being the ultimate tensile strength and elongation of 934.7 MPa and 24.3%, respectively. The elongation of the three macro-defect-free samples was much higher than that previously reported for additively manufactured Ti–6Al–4V alloys. The high elongation of the samples in this work is mainly attributed to the elimination of internal macro-defects.
Introduction
Additive manufacturing (AM) technologies can rapidly manufacture complex or custom parts, reducing process steps and saving manufacturing time [[1], [2], [3], [4]], and are widely used in the aerospace, automotive, and other precision industries [5,6]. Powder bed fusion using an electron beam (PBF-EB) is an additive manufacturing method that uses a high-energy electron beam to melt metal powders layer by layer to produce parts. In contrast to selective laser melting, PBF-EB involves the preparation of samples in a high vacuum environment, which effectively prevents the introduction of impurities such as O and N. It also involves a preheating process for the print substrate and powder, which reduces residual thermal stress on the sample and subsequent heat treatment processes [[2], [3], [4],7]. Due to these features and advantages, PBF-EB technology is a very important AM technology with great potential in metallic materials. Moreover, PBF-EB is the ideal AM technology for the manufacture of complex components made of many alloys, such as titanium alloys, nickel-based superalloys, aluminum alloys and stainless steels [[2], [3], [4],8].
Ti–6Al–4V alloy is one of the prevalent commercial titanium alloys possessing high specific strength, excellent mechanical properties, excellent corrosion resistance, and good biocompatibility [9,10]. It is widely used in applications requiring low density and excellent corrosion resistance, such as the aerospace industry and biomechanical applications [11,12]. The mechanical properties of PBF-EB-processed Ti–6Al–4V alloys are superior to those fabricated by casting or forging, because the rapid cooling rate in PBF-EB results in finer grains [[12], [13], [14], [15], [16], [17], [18]]. However, the PBF-EB-fabricated parts often include internal macro-defects, which compromises their mechanical properties [[19], [20], [21], [22]]. This study focused on the elimination of macro-defects, such as porosity, lack of fusion, incomplete penetration and unmelted powders, which distinguishes them from micro-defects such as vacancies, dislocations, grain boundaries and secondary phases, etc. Large-sized fusion defects cause a severe reduction in mechanical strength. Smaller defects, such as pores and cracks, lead to the initiation of fatigue cracking and rapidly accelerate the cracking process [23]. The issue of internal macro-defects must be addressed to expand the application of the PBF-EB technology. The main studies for controlling internal macro-defects are online monitoring of defects, remelting and hot isostatic pressing (HIP). The literatures [24,25] report the use of infrared imaging or other imaging techniques to identify defects, but the monitoring of smaller sized defects is still not adequate. And in some cases remelting does not reduce the internal macro-defects of the part, but instead causes coarsening of the macrostructure and volatilization of some metal elements [23]. The HIP treatment does not completely eliminate the internal macro-defects, the original defect location may still act as a point of origin of the crack, and the subsequent treatment will consume more time and economic costs [23]. Therefore, optimizing suitable printing parameters to avoid internal macro-defects in printed parts at source is of great industrial value and research significance, and is an urgent issue in PBF-EB related technology.
There are two causes of internal macro-defects in the AM process: gas pores trapped in the virgin powder and the inappropriate printing parameters [7,23]. Gui et al. [26] classify internal macro-defects during PBF-EB process according to their shape, such as spherical defects, elongated shape defects, flat shape defects and other irregular shape defects. Of these, spherical defects mainly originate from raw material powders. Other shape defects mainly originate from lack of fusion or unmelted powders caused by unsuitable printing parameters, etc. The PBF-EB process requires powders with good flowability, and spherical powders are typically chosen as raw materials. The prevalent techniques for the fabrication of pre-alloyed powders are gas atomization (GA), plasma atomization (PA), and the plasma rotating electrode process (PREP) [27,28]. These methods yield powders with different characteristics that affect the subsequent fabrication. The selection of a suitable powder for PBF-EB is particularly important to produce Ti–6Al–4V alloys without internal macro-defects. The need to optimize several printing parameters such as beam current, scan speed, line offset, and focus offset make it difficult to eliminate internal macro-defects that occur during printing [23]. Most of the studies [11,12,22,[29], [30], [31], [32], [33]] on the optimization of AM processes for Ti–6Al–4V alloys have focused on samples with a limited set of parameters (e.g., power–scan speed) and do not allow for the guidance and development of unknown process windows for macro-defect-free samples. In addition, process optimization remains a time-consuming problem, with the traditional ‘trial and error’ method demanding considerable time and economic costs. The development of a simple and efficient method to predict the processing window for alloys without internal macro-defects is a key issue. In recent years, machine learning techniques have increasingly been used in the field of additive manufacturing and materials development [[34], [35], [36], [37]]. Aoyagi et al. [38] recently proposed a novel and efficient method based on a support vector machine (SVM) to optimize the two-dimensional process parameters (current and scan speed) and obtain PBF-EB-processed CoCr alloys without internal macro-defects. The method is one of the potential approaches toward effective optimization of more than two process parameters and makes it possible for the machine learning techniques to accelerate the development of alloys without internal macro-defects.
Herein, we focus on the elimination of internal macro-defects, such as pores, lack of fusion, etc., caused by raw powders and printing parameters. The Ti–6Al–4V powders produced by three different methods were compared, and the powder with the best sphericity, flowability, and minimal porosity was selected as the feedstock for subsequent printing. The relationship between the surface roughness and internal macro-defects in the Ti–6Al–4V components was also investigated. The combination of SVM and surface roughness indices (Sdr) predicted a wider four-dimensional processing window for obtaining Ti–6Al–4V alloys without internal macro-defects. Finally, we investigated the tensile properties of Ti–6Al–4V alloys at room temperature with different printing parameters, as well as the corresponding microstructures and fracture types.
Section snippets
Starting materials
Three types of Ti–6Al–4V alloy powders, produced by GA, PA, and PREP, were compared. The particle size distribution of the powders was determined using a laser particle size analyzer (LS230, Beckman Coulter, USA), and the flowability was measured using a Hall flowmeter (JIS-Z2502, Tsutsui Scientific Instruments Co., Ltd., Japan), according to the ASTM B213 standard. The powder morphology and internal macro-defects were determined using scanning electron microscopy (SEM, JEOL JCM-6000) and X-ray
Comparison of the characteristics of GA, PA, and PREP Ti–6Al–4V powders
The particle size distributions (PSDs) and flowability of the three types of Ti–6Al–4V alloy powders produced by GA, PA, and PREP are shown in Fig. 2. Although the average particle sizes are similar (89.4 μm for GA, 82.5 μm for PA, and 86.1μm for PREP), the particle size range is different for the three types of powder (6.2–174.8 μm for GA, 27.3–139.2 μm for PA, and 39.4–133.9 μm for PREP). The flowability of the GA, PA, and PREP powders was 30.25 ± 0.98, 26.54 ± 0.37, and 25.03 ± 0.22 (s/50
Conclusions
The characteristics of the three types of Ti–6Al–4V alloy powders produced via GA, PA, and PREP were compared. The PREP powder with the best sphericity, flowability, and low porosity was found to be the most favorable powder for subsequent printing of Ti–6Al–4V alloys without internal macro-defects. The quantitative criterion of Sdr <0.015 for even surfaces was also found to be applicable to Ti–6Al–4V alloys. The process maps of Ti–6Al–4V alloys include two regions, high beam current/scan speed
The authors declare that they have no known competing financial interests or personal relationships that could have appeared to influence the work reported in this paper.
Acknowledgments
This study was based on the results obtained from project JPNP19007, commissioned by the New Energy and Industrial Technology Development Organization (NEDO). This work was also supported by JSPS KAKENHI (Proposal No. 21K03801) and the Inter-University Cooperative Research Program (Proposal nos. 18G0418, 19G0411, and 20G0418) of the Cooperative Research and Development Center for Advanced Materials, Institute for Materials Research, Tohoku University. It was also supported by the Council for
에피택셜 과 등축 응고 사이의 경쟁은 적층 제조에서 실행되는 레이저 용융 동안 CMSX-4 단결정 초합금에서 조사되었습니다. 단일 트랙 레이저 스캔은 레이저 출력과 스캐닝 속도의 여러 조합으로 방향성 응고된 CMSX-4 합금의 분말 없는 표면에서 수행되었습니다. EBSD(Electron Backscattered Diffraction) 매핑은 새로운 방향의 식별을 용이하게 합니다. 영역 분율 및 공간 분포와 함께 융합 영역 내에서 핵을 형성한 “스트레이 그레인”은 충실도가 높은 전산 유체 역학 시뮬레이션을 사용하여 용융 풀 내의 온도 및 유체 속도 필드를 모두 추정했습니다. 이 정보를 핵 생성 모델과 결합하여 용융 풀에서 핵 생성이 발생할 확률이 가장 높은 위치를 결정했습니다. 금속 적층 가공의 일반적인 경험에 따라 레이저 용융 트랙의 응고된 미세 구조는 에피택셜 입자 성장에 의해 지배됩니다. 더 높은 레이저 스캐닝 속도와 더 낮은 출력이 일반적으로 흩어진 입자 감소에 도움이 되지만,그럼에도 불구하고 길쭉한 용융 풀에서 흩어진 입자가 분명했습니다.
The competition between epitaxial vs. equiaxed solidification has been investigated in CMSX-4 single crystal superalloy during laser melting as practiced in additive manufacturing. Single-track laser scans were performed on a powder-free surface of directionally solidified CMSX-4 alloy with several combinations of laser power and scanning velocity. Electron backscattered diffraction (EBSD) mapping facilitated identification of new orientations, i.e., “stray grains” that nucleated within the fusion zone along with their area fraction and spatial distribution. Using high-fidelity computational fluid dynamics simulations, both the temperature and fluid velocity fields within the melt pool were estimated. This information was combined with a nucleation model to determine locations where nucleation has the highest probability to occur in melt pools. In conformance with general experience in metals additive manufacturing, the as-solidified microstructure of the laser-melted tracks is dominated by epitaxial grain growth; nevertheless, stray grains were evident in elongated melt pools. It was found that, though a higher laser scanning velocity and lower power are generally helpful in the reduction of stray grains, the combination of a stable keyhole and minimal fluid velocity further mitigates stray grains in laser single tracks.
Introduction
니켈 기반 초합금은 고온에서 긴 노출 시간 동안 높은 인장 강도, 낮은 산화 및 우수한 크리프 저항성을 포함하는 우수한 특성의 고유한 조합으로 인해 가스 터빈 엔진 응용 분야에서 광범위하게 사용됩니다. CMSX-4는 특히 장기 크리프 거동과 관련하여 초고강도의 2세대 레늄 함유 니켈 기반 단결정 초합금입니다. [ 1 , 2 ]입계의 존재가 크리프를 가속화한다는 인식은 가스 터빈 엔진의 고온 단계를 위한 단결정 블레이드를 개발하게 하여 작동 온도를 높이고 효율을 높이는 데 기여했습니다. 이러한 구성 요소는 사용 중 마모될 수 있습니다. 즉, 구성 요소의 무결성을 복원하고 단결정 미세 구조를 유지하는 수리 방법을 개발하기 위한 지속적인 작업이 있었습니다. [ 3 , 4 , 5 ]
적층 제조(AM)가 등장하기 전에는 다양한 용접 공정을 통해 단결정 초합금에 대한 수리 시도가 수행되었습니다. 균열 [ 6 , 7 ] 및 흩어진 입자 [ 8 , 9 ] 와 같은 심각한 결함 이 이 수리 중에 자주 발생합니다. 일반적으로 “스트레이 그레인”이라고 하는 응고 중 모재의 방향과 다른 결정학적 방향을 가진 새로운 그레인의 형성은 니켈 기반 단결정 초합금의 수리 중 유해한 영향으로 인해 중요한 관심 대상입니다. [ 3 , 10 ]결과적으로 재료의 단결정 구조가 손실되고 원래 구성 요소에 비해 기계적 특성이 손상됩니다. 이러한 흩어진 입자는 특정 조건에서 에피택셜 성장을 대체하는 등축 응고의 시작에 해당합니다.
떠돌이 결정립 형성을 완화하기 위해 이전 작업은 용융 영역(FZ) 내에서 응고하는 동안 떠돌이 결정립 형성에 영향을 미치는 수지상 응고 거동 및 처리 조건을 이해하는 데 중점을 두었습니다. [ 11 , 12 , 13 , 14 ] 연구원들은 단결정 합금의 용접 중에 표류 결정립 형성에 대한 몇 가지 가능한 메커니즘을 제안했습니다. [ 12 , 13 , 14 , 15 ]응고 전단에 앞서 국부적인 구성 과냉각은 이질적인 핵 생성 및 등축 결정립의 성장을 유발할 수 있습니다. 또한 용융 풀에서 활발한 유체 흐름으로 인해 발생하는 덴드라이트 조각화는 용융 풀 경계 근처에서 새로운 결정립을 형성할 수도 있습니다. 두 메커니즘 모두에서, 표류 결정립 형성은 핵 생성 위치에 의존하며, 차이점은 수상 돌기 조각화는 수상 돌기 조각이 핵 생성 위치로 작용한다는 것을 의미하는 반면 다른 메커니즘은 재료, 예 를 들어 산화물 입자에서 발견되는 다른 유형의 핵 생성 위치를 사용한다는 것을 의미합니다. 잘 알려진 바와 같이, 많은 주물에 대한 반대 접근법은 TiB와 같은 핵제의 도입을 통해 등축 응고를 촉진하는 것입니다.22알루미늄 합금에서.
헌법적 과냉 메커니즘에서 Hunt [ 11 ] 는 정상 상태 조건에서 기둥에서 등축으로의 전이(CET)를 설명하는 모델을 개발했습니다. Gaumann과 Kurz는 Hunt의 모델을 수정하여 단결정이 응고되는 동안 떠돌이 결정립이 핵을 생성하고 성장할 수 있는 정도를 설명했습니다. [ 12 , 14 ] 이후 연구에서 Vitek은 Gaumann의 모델을 개선하고 출력 및 스캐닝 속도와 같은 용접 조건의 영향에 대한 보다 자세한 분석을 포함했습니다. Vitek은 또한 실험 및 모델링 기술을 통해 표류 입자 형성에 대한 기판 방향의 영향을 포함했습니다. [ 3 , 10 ]일반적으로 높은 용접 속도와 낮은 출력은 표류 입자의 양을 최소화하고 레이저 용접 공정 중 에피택셜 단결정 성장을 최대화하는 것으로 나타났습니다. [ 3,10 ] 그러나 Vitek은 덴드라이트 조각화를 고려하지 않았으며 그의 연구는 불균질 핵형성이 레이저 용접된 CMSX -4 단결정 합금에서 표류 결정립 형성을 이끄는 주요 메커니즘임을 나타냅니다. 현재 작업에서 Vitek의 수치적 방법이 채택되고 금속 AM의 급속한 특성의 더 높은 속도와 더 낮은 전력 특성으로 확장됩니다.
AM을 통한 금속 부품 제조 는 지난 10년 동안 급격한 인기 증가를 목격했습니다. [ 16 ] EBM(Electron Beam Melting)에 의한 CMSX-4의 제작 가능성은 자주 조사되었으나 [ 17 , 18 , 19 , 20 , 21 ] CMSX의 제조 및 수리에 대한 조사는 매우 제한적이었다. – 4개의 단결정 구성요소는 레이저 분말 베드 융합(LPBF)을 사용하며, AM의 인기 있는 하위 집합으로, 특히 표류 입자 형성을 완화하는 메커니즘과 관련이 있습니다. [ 22 ]이러한 조사 부족은 주로 이러한 합금 시스템과 관련된 처리 문제로 인해 발생합니다. [ 2 , 19 , 22 , 23 , 24 ] 공정 매개변수( 예: 열원 전력, 스캐닝 속도, 스폿 크기, 예열 온도 및 스캔 전략)의 엄격한 제어는 완전히 조밀한 부품을 만들고 유지 관리할 수 있도록 하는 데 필수적입니다. 단결정 미세구조. [ 25 ] EBM을 사용하여 단결정 합금의 균열 없는 수리가 현재 가능하지만 [ 19 , 24 ] 표류 입자를 생성하지 않는 수리는 쉽게 달성할 수 없습니다.[ 23 , 26 ]
이 작업에서 LPBF를 대표하는 조건으로 레이저 용융을 사용하여 단결정 CMSX-4에서 표류 입자 완화를 조사했습니다. LPBF는 스캐닝 레이저 빔을 사용하여 금속 분말의 얇은 층을 기판에 녹이고 융합합니다. 층별 증착에서 레이저 빔의 사용은 급격한 온도 구배, 빠른 가열/냉각 주기 및 격렬한 유체 흐름을 경험하는 용융 풀을 생성 합니다 . 이것은 일반적으로 부품에 결함을 일으킬 수 있는 매우 동적인 물리적 현상으로 이어집니다. [ 28 , 29 , 30 ] 레이저 유도 키홀의 동역학( 예:, 기화 유발 반동 압력으로 인한 위상 함몰) 및 열유체 흐름은 AM 공정에서 응고 결함과 강하게 결합되고 관련됩니다. [ 31 , 32 , 33 , 34 ] 기하 구조의 급격한 변화가 발생하기 쉬운 불안정한 키홀은 다공성, 볼링, 스패터 형성 및 흔하지 않은 미세 구조 상을 포함하는 유해한 물리적 결함을 유발할 수 있습니다. 그러나 키홀 진화와 유체 흐름은 자연적으로 다음을 통해 포착 하기 어렵 습니다 .전통적인 사후 특성화 기술. 고충실도 수치 모델링을 활용하기 위해 이 연구에서는 전산유체역학(CFD)을 적용하여 표면 아래의 레이저-물질 상호 작용을 명확히 했습니다. [ 36 ] 이것은 응고된 용융물 풀의 단면에 대한 오랫동안 확립된 사후 특성화와 비교하여 키홀 및 용융물 풀 유체 흐름 정량화를 실행합니다.
CMSX-4 구성 요소의 레이저 기반 AM 수리 및 제조를 위한 적절한 절차를 개발하기 위해 적절한 공정 창을 설정하고 응고 중 표류 입자 형성 경향에 대한 예측 기능을 개발하는 것부터 시작합니다. 다중 합금에 대한 단일 트랙 증착은 분말 층이 있거나 없는 AM 공정에서 용융 풀 형상 및 미세 구조의 정확한 분석을 제공하는 것으로 나타났습니다. [ 37 , 38 , 39 ]따라서 본 연구에서는 CMSX-4의 응고 거동을 알아보기 위해 분말을 사용하지 않는 단일 트랙 레이저 스캔 실험을 사용하였다. 이는 CMSX-4 단결정의 LPBF 제조를 위한 예비 실험 지침을 제공합니다. 또한 응고 모델링은 기존 용접에서 LPBF와 관련된 급속 용접으로 확장되어 표류 입자 감소를 위한 최적의 레이저 용융 조건을 식별했습니다. 가공 매개변수 최적화를 위한 추가 지침을 제공하기 위해 용융물 풀의 매우 동적인 유체 흐름을 모델링했습니다.
재료 및 방법
단일 트랙 실험
방전 가공(EDM)을 사용하여 CMSX-4 방향성 응고 단결정 잉곳으로부터 샘플을 제작했습니다. 샘플의 최종 기하학은 치수 20의 직육면체 형태였습니다.××20××6mm. 6개 중 하나⟨ 001 ⟩⟨001⟩잉곳의 결정학적 방향은 레이저 트랙이 이 바람직한 성장 방향을 따라 스캔되도록 절단 표면에 수직으로 위치했습니다. 단일 레이저 용융 트랙은 EOS M290 기계를 사용하여 분말이 없는 샘플 표면에 만들어졌습니다. 이 기계는 최대 출력 400W, 가우시안 빔 직경 100의 이터븀 파이버 레이저가 장착된 LPBF 시스템입니다. μμ초점에서 m. 실험 중에 직사각형 샘플을 LPBF 기계용 맞춤형 샘플 홀더의 포켓에 끼워 표면을 동일한 높이로 유지했습니다. 이 맞춤형 샘플 홀더에 대한 자세한 내용은 다른 곳에서 설명합니다. 실험 은 아르곤 퍼지 분위기에서 수행되었으며 예열은 적용되지 않았습니다 . 단일 트랙 레이저 용융 실험은 다양한 레이저 출력(200~370W)과 스캔 속도(0.4~1.4m/s)에서 수행되었습니다.
성격 묘사
레이저 스캐닝 후, 레이저 빔 스캐닝 방향에 수직인 평면에서 FZ를 통해 다이아몬드 톱을 사용하여 샘플을 절단했습니다. 그 후, 샘플을 장착하고 220 그릿 SiC 페이퍼로 시작하여 콜로이드 실리카 현탁액 광택제로 마무리하여 자동 연마했습니다. 결정학적 특성화는 20kV의 가속 전압에서 TESCAN MIRA 3XMH 전계 방출 주사 전자 현미경(SEM)에서 수행되었습니다. EBSD 지도는0.4μm _0.4μ미디엄단계 크기. Bruker 시스템을 사용하여 EBSD 데이터를 정리하고 분석했습니다. EBSD 클린업은 그레인을 접촉시키기 위한 그레인 확장 루틴으로 시작한 다음 인덱스되지 않은 회절 패턴과 관련된 검은색 픽셀을 해결하기 위해 이웃 방향 클린업 루틴으로 이어졌습니다. 용융 풀 형태를 분석하기 위해 단면을 광학 현미경으로 분석했습니다. 광학 특성화의 대비를 향상시키기 위해 10g CuSO로 구성된 Marbles 시약의 변형으로 샘플을 에칭했습니다.44, 50mL HCl 및 70mL H22영형.
응고 모델링
구조적 과냉 기준에 기반한 응고 모델링을 수행하여 표유 입자의 성향 및 분포에 대한 가공 매개변수의 영향을 평가했습니다. 이 분석 모델링 접근 방식에 대한 자세한 내용은 이전 작업에서 제공됩니다. [ 3 , 10 ] 참고문헌 3 에 기술된 바와 같이 , 기본 재료의 결정학적 배향을 가진 용융 풀에서 총 표유 입자 면적 분율의 변화는 최소이므로 기본 재료 배향의 영향은 이 작업에서 고려되지 않았습니다. 우리의 LPBF 결과를 이전 작업과 비교하기 위해 Vitek의 작업에서 사용된 수학적으로 간단한 Rosenthal 방정식 [ 3 ]또한 레이저 매개변수의 함수로 용융 풀의 모양과 FZ의 열 조건을 계산하기 위한 기준으로 여기에서 채택되었습니다. Rosenthal 솔루션은 열이 일정한 재료 특성을 가진 반무한 판의 정상 상태 점원을 통해서만 전도를 통해 전달된다고 가정하며 일반적으로 다음과 같이 표현 됩니다 [ 40 , 41 ] .
티=티0+η피2 파이케이엑스2+와이2+지2———-√경험치[- 브이(엑스2+와이2+지2———-√− 엑스 )2α _] ,티=티0+η피2파이케이엑스2+와이2+지2경험치[-V(엑스2+와이2+지2-엑스)2α],(1)
여기서 T 는 온도,티0티0본 연구에서 313K( 즉 , EOS 기계 챔버 온도)로 설정된 주변 온도, P 는 레이저 빔 파워, V 는 레이저 빔 스캐닝 속도,ηη는 레이저 흡수율, k 는 열전도율,αα베이스 합금의 열확산율입니다. x , y , z 는 각각 레이저 스캐닝 방향, 가로 방향 및 세로 방향의 반대 방향과 정렬된 방향입니다 . 이 직교 좌표는 참조 3 의 그림 1에 있는 시스템을 따랐습니다 . CMSX-4에 대한 고상선 온도(1603K)와 액상선 온도(1669K)의 등온선 평균으로 응고 프런트( 즉 , 고체-액체 계면)를 정의했습니다. [ 42 , 43 , 44 ] 시뮬레이션에 사용된 열물리적 특성은 표 I 에 나열되어 있습니다.표 I CMSX-4의 응고 모델링에 사용된 열물리적 특성
어디θθ는 스캔 방향과 응고 전면의 법선 방향( 즉 , 최대 열 흐름 방향) 사이의 각도입니다. 이 연구의 용접 조건과 같은 제한된 성장에서 수지상 응고 전면은 고체-액체 등온선의 속도로 성장하도록 강제됩니다.V티V티. [ 46 ]
응고 전선이 진행되기 전에 새로 핵 생성된 입자의 국지적 비율ΦΦ, 액체 온도 구배 G 에 의해 결정 , 응고 선단 속도V티V티및 핵 밀도N0N0. 고정된 임계 과냉각에서 모든 입자가 핵형성된다고 가정함으로써△티N△티N, 등축 결정립의 반경은 결정립이 핵 생성을 시작하는 시점부터 주상 전선이 결정립에 도달하는 시간까지의 성장 속도를 통합하여 얻습니다. 과냉각으로 대체 시간d (ΔT_) / dt = – _V티G디(△티)/디티=-V티G, 열 구배 G 사이의 다음 관계 , 등축 입자의 국부적 부피 분율ΦΦ, 수상 돌기 팁 과냉각ΔT _△티, 핵 밀도N0N0, 재료 매개변수 n 및 핵생성 과냉각△티N△티N, Gäumann 외 여러분 에 의해 파생되었습니다 . [ 12 , 14 ] Hunt의 모델 [ 11 ] 의 수정에 기반함 :
계산을 단순화하기 위해 덴드라이트 팁 과냉각을 전적으로 구성 과냉각의 것으로 추정합니다.△티씨△티씨, 멱법칙 형식으로 근사화할 수 있습니다.△티씨= ( _V티)1 / 엔△티씨=(ㅏV티)1/N, 여기서 a 와 n 은 재료 종속 상수입니다. CMSX-4의 경우 이 값은a = 1.25 ×10⁶ㅏ=1.25×10⁶ s K 3.4m− 1-1,엔 = 3.4N=3.4, 그리고N0= 2 ×10¹⁵N0=2×10¹⁵미디엄− 3,-삼,참고문헌 3 에 의해 보고된 바와 같이 .△티N△티N2.5K이며 보다 큰 냉각 속도에서 응고에 대해 무시할 수 있습니다.106106 K/s. 에 대한 표현ΦΦ위의 방정식을 재배열하여 해결됩니다.
As proposed by Hunt,[11] a value of Φ≤0.66Φ≤0.66 pct represents fully columnar epitaxial growth condition, and, conversely, a value of Φ≥49Φ≥49 pct indicates that the initial single crystal microstructure is fully replaced by an equiaxed microstructure. To calculate the overall stray grain area fraction, we followed Vitek’s method by dividing the FZ into roughly 19 to 28 discrete parts (depending on the length of the melt pool) of equal length from the point of maximum width to the end of melt pool along the x direction. The values of G and vTvT were determined at the center on the melt pool boundary of each section and these values were used to represent the entire section. The area-weighted average of ΦΦ over these discrete sections along the length of melt pool is designated as Φ¯¯¯¯Φ¯, and is given by:
Φ¯¯¯¯=∑kAkΦk∑kAk,Φ¯=∑kAkΦk∑kAk,
(6)
where k is the index for each subsection, and AkAk and ΦkΦk are the areas and ΦΦ values for each subsection. The summation is taken over all the sections along the melt pool. Vitek’s improved model allows the calculation of stray grain area fraction by considering the melt pool geometry and variations of G and vTvT around the tail end of the pool.
수년에 걸쳐 용융 풀 현상 모델링의 정확도를 개선하기 위해 많은 고급 수치 방법이 개발되었습니다. 우리는 FLOW-3D와 함께 고충실도 CFD를 사용했습니다. FLOW-3D는 여러 물리 모델을 통합하는 상용 FVM(Finite Volume Method)입니다. [ 47 , 48 ] CFD는 유체 운동과 열 전달을 수치적으로 시뮬레이션하며 여기서 사용된 기본 물리 모델은 레이저 및 표면력 모델이었습니다. 레이저 모델에서는 레이 트레이싱 기법을 통해 다중 반사와 프레넬 흡수를 구현합니다. [ 36 ]먼저, 레이저 빔은 레이저 빔에 의해 조명되는 각 그리드 셀을 기준으로 여러 개의 광선으로 이산화됩니다. 그런 다음 각 입사 광선에 대해 입사 벡터가 입사 위치에서 금속 표면의 법선 벡터와 정렬될 때 에너지의 일부가 금속에 의해 흡수됩니다. 흡수율은 Fresnel 방정식을 사용하여 추정됩니다. 나머지 에너지는 반사광선 에 의해 유지되며 , 반사광선은 재료 표면에 부딪히면 새로운 입사광선으로 처리됩니다. 두 가지 주요 힘이 액체 금속 표면에 작용하여 자유 표면을 변형시킵니다. 금속의 증발에 의해 생성된 반동 압력은 증기 억제를 일으키는 주요 힘입니다. 본 연구에서 사용된 반동 압력 모델은피아르 자형= 특급 _{ B ( 1- _티V/ 티) }피아르 자형=ㅏ경험치{비(1-티V/티)}, 어디피아르 자형피아르 자형는 반동압력, A 와 B 는 재료의 물성에 관련된 계수로 각각 75와 15이다.티V티V는 포화 온도이고 T 는 키홀 벽의 온도입니다. 표면 흐름 및 키홀 형성의 다른 원동력은 표면 장력입니다. 표면 장력 계수는 Marangoni 흐름을 포함하기 위해 온도의 선형 함수로 추정되며,σ =1.79-9.90⋅10− 4( 티− 1654케이 )σ=1.79-9.90⋅10-4(티-1654년케이)엔엠− 1-1. [ 49 ] 계산 영역은 베어 플레이트의 절반입니다(2300 μμ미디엄××250 μμ미디엄××500 μμm) xz 평면 에 적용된 대칭 경계 조건 . 메쉬 크기는 8입니다. μμm이고 시간 단계는 0.15입니다. μμs는 계산 효율성과 정확성 간의 균형을 제공합니다.
결과 및 논의
용융 풀 형태
이 작업에 사용된 5개의 레이저 파워( P )와 6개의 스캐닝 속도( V )는 서로 다른 29개의 용융 풀을 생성했습니다.피- 브이피-V조합. P 와 V 값이 가장 높은 것은 그림 1 을 기준으로 과도한 볼링과 관련이 있기 때문에 본 연구에서는 분석하지 않았다 .
단일 트랙 용융 풀은 그림 1 과 같이 형상에 따라 네 가지 유형으로 분류할 수 있습니다 [ 39 ] : (1) 전도 모드(파란색 상자), (2) 키홀 모드(빨간색), (3) 전환 모드(마젠타), (4) 볼링 모드(녹색). 높은 레이저 출력과 낮은 스캐닝 속도의 일반적인 조합인 키홀 모드에서 용융물 풀은 일반적으로 너비/깊이( W / D ) 비율이 0.5보다 훨씬 큰 깊고 가느다란 모양을 나타냅니다 . 스캐닝 속도가 증가함에 따라 용융 풀이 얕아져 W / D 가 약 0.5인 반원형 전도 모드 용융 풀을 나타냅니다. W / D _전환 모드 용융 풀의 경우 1에서 0.5 사이입니다. 스캐닝 속도를 1200 및 1400mm/s로 더 높이면 충분히 큰 캡 높이와 볼링 모드 용융 풀의 특징인 과도한 언더컷이 발생할 수 있습니다.
힘과 속도의 함수로서의 용융 풀 깊이와 너비는 각각 그림 2 (a)와 (b)에 표시되어 있습니다. 용융 풀 폭은 기판 표면에서 측정되었습니다. 그림 2 (a)는 깊이가 레이저 출력과 매우 선형적인 관계를 따른다는 것을 보여줍니다. 속도가 증가함에 따라 깊이 대 파워 곡선의 기울기는 꾸준히 감소하지만 더 높은 속도 곡선에는 약간의 겹침이 있습니다. 이러한 예상치 못한 중첩은 종종 용융 풀 형태의 동적 변화를 유발하는 유체 흐름의 영향과 레이저 스캔당 하나의 이미지만 추출되었다는 사실 때문일 수 있습니다. 이러한 선형 동작은 그림 2 (b) 의 너비에 대해 명확하지 않습니다 . 그림 2(c)는 선형 에너지 밀도 P / V 의 함수로서 용융 깊이와 폭을 보여줍니다 . 선형 에너지 밀도는 퇴적물의 단위 길이당 에너지 투입량을 측정한 것입니다. [ 50 ] 용융 풀 깊이는 에너지 밀도에 따라 달라지며 너비는 더 많은 분산을 나타냅니다. 동일한 에너지 밀도가 준공 부품의 용융 풀, 미세 구조 또는 속성에서 반드시 동일한 유체 역학을 초래하지는 않는다는 점에 유의하는 것이 중요합니다. [ 50 ]
그림 1그림 2
레이저 흡수율 평가
레이저 흡수율은 LPBF 조건에서 재료 및 가공 매개변수에 따라 크게 달라진다는 것은 잘 알려져 있습니다. [ 31 , 51 , 52 ] 적분구를 이용한 전통적인 흡수율의 직접 측정은 일반적으로 높은 비용과 구현의 어려움으로 인해 쉽게 접근할 수 없습니다. [ 51 ] 그 외 . [ 39 ] 전도 모드 용융 풀에 대한 Rosenthal 방정식을 기반으로 경험적 레이저 흡수율 모델을 개발했지만 기본 가정으로 인해 키홀 용융 풀에 대한 정확한 예측을 제공하지 못했습니다. [ 40 ] 최근 간외 . [ 53 ] Ti–6Al–4V에 대한 30개의 고충실도 다중 물리 시뮬레이션 사례를 사용하여 레이저 흡수에 대한 스케일링 법칙을 확인했습니다. 그러나 연구 중인 특정 재료에 대한 최소 흡수(평평한 용융 표면의 흡수율)에 대한 지식이 필요하며 이는 CMSX-4에 대해 알려지지 않았습니다. 다양한 키홀 모양의 용융 풀에 대한 레이저 흡수의 정확한 추정치를 얻기가 어렵기 때문에 상한 및 하한 흡수율로 분석 시뮬레이션을 실행하기로 결정했습니다. 깊은 키홀 모양의 용융 풀의 경우 대부분의 빛을 가두는 키홀 내 다중 반사로 인해 레이저 흡수율이 0.8만큼 높을 수 있습니다. 이것은 기하학적 현상이며 기본 재료에 민감하지 않습니다. [ 51, 52 , 54 ] 따라서 본 연구에서는 흡수율의 상한을 0.8로 설정하였다. 참고 문헌 51 에 나타낸 바와 같이 , 전도 용융 풀에 해당하는 최저 흡수율은 약 0.3이었으며, 이는 이 연구에서 합리적인 하한 값입니다. 따라서 레이저 흡수율이 스트레이 그레인 형성에 미치는 영향을 보여주기 위해 흡수율 값을 0.55 ± 0.25로 설정했습니다. Vitek의 작업에서는 1.0의 고정 흡수율 값이 사용되었습니다. [ 3 ]
퓨전 존 미세구조
그림 3 은 200~300W 및 600~300W 및 600~300W 범위의 레이저 출력 및 속도로 9가지 다른 처리 매개변수에 의해 생성된 CMSX-4 레이저 트랙의 yz 단면 에서 취한 EBSD 역극점도와 해당 역극점도를 보여 줍니다. 각각 1400mm/s. EBSD 맵에서 여러 기능을 쉽게 관찰할 수 있습니다. 스트레이 그레인은 EBSD 맵에서 그 방향에 해당하는 다른 RGB 색상으로 나타나고 그레인 경계를 묘사하기 위해 5도의 잘못된 방향이 사용되었습니다. 여기, 그림 3 에서 스트레이 그레인은 대부분 용융 풀의 상단 중심선에 집중되어 있으며, 이는 용접된 단결정 CMSX-4의 이전 보고서와 일치합니다. [ 10 ]역 극점도에서, 점 근처에 집중된 클러스터⟨ 001 ⟩⟨001⟩융합 경계에서 유사한 방향을 유지하는 단결정 기반 및 에피택셜로 응고된 덴드라이트를 나타냅니다. 그러나 흩어진 곡물은 식별할 수 있는 질감이 없는 흩어져 있는 점으로 나타납니다. 단결정 기본 재료의 결정학적 방향은 주로⟨ 001 ⟩⟨001⟩비록 샘플을 절단하는 동안 식별할 수 없는 기울기 각도로 인해 또는 단결정 성장 과정에서 약간의 잘못된 방향이 있었기 때문에 약간의 편차가 있지만. 용융 풀 내부의 응고된 수상 돌기의 기본 방향은 다시 한 번⟨ 001 ⟩⟨001⟩주상 결정립 구조와 유사한 에피택셜 성장의 결과. 그림 3 과 같이 용융 풀에서 수상돌기의 성장 방향은 하단의 수직 방향에서 상단의 수평 방향으로 변경되었습니다 . 이 전이는 주로 온도 구배 방향의 변화로 인한 것입니다. 두 번째 전환은 CET입니다. FZ의 상단 중심선 주변에서 다양한 방향의 흩어진 입자가 관찰되며, 여기서 안쪽으로 성장하는 수상돌기가 서로 충돌하여 용융 풀에서 응고되는 마지막 위치가 됩니다.
더 깊은 키홀 모양을 특징으로 하는 샘플에서 용융 풀의 경계 근처에 침전된 흩어진 입자가 분명합니다. 이러한 새로운 입자는 나중에 모델링 섹션에서 논의되는 수상돌기 조각화 메커니즘에 의해 잠재적으로 발생합니다. 결정립이 강한 열 구배에서 핵을 생성하고 성장한 결과, 대부분의 흩어진 결정립은 모든 방향에서 동일한 크기를 갖기보다는 장축이 열 구배 방향과 정렬된 길쭉한 모양을 갖습니다. 그림 3 의 전도 모드 용융 풀 흩어진 입자가 없는 것으로 입증되는 더 나은 단결정 품질을 나타냅니다. 상대적으로 낮은 출력과 높은 속도의 스캐닝 레이저에 의해 생성된 이러한 더 얕은 용융 풀에서 최소한의 결정립 핵형성이 발생한다는 것은 명백합니다. 더 큰 면적 분율을 가진 스트레이 그레인은 고출력 및 저속으로 생성된 깊은 용융 풀에서 더 자주 관찰됩니다. 국부 응고 조건에 대한 동력 및 속도의 영향은 후속 모델링 섹션에서 조사할 것입니다.
그림 3
응고 모델링
서론에서 언급한 바와 같이 연구자들은 단결정 용접 중에 표류 결정립 형성의 가능한 메커니즘을 평가했습니다. [ 12 , 13 , 14 , 15 , 55 ]논의된 가장 인기 있는 두 가지 메커니즘은 (1) 응고 전단에 앞서 구성적 과냉각에 의해 도움을 받는 이종 핵형성 및 (2) 용융물 풀의 유체 흐름으로 인한 덴드라이트 조각화입니다. 첫 번째 메커니즘은 광범위하게 연구되었습니다. 이원 합금을 예로 들면, 고체는 액체만큼 많은 용질을 수용할 수 없으므로 응고 중에 용질을 액체로 거부합니다. 결과적으로, 성장하는 수상돌기 앞에서 용질 분할은 실제 온도가 국부 평형 액상선보다 낮은 과냉각 액체를 생성합니다. 충분히 광범위한 체질적으로 과냉각된 구역의 존재는 새로운 결정립의 핵형성 및 성장을 촉진합니다. [ 56 ]전체 과냉각은 응고 전면에서의 구성, 동역학 및 곡률 과냉각을 포함한 여러 기여의 합입니다. 일반적인 가정은 동역학 및 곡률 과냉각이 합금에 대한 용질 과냉각의 더 큰 기여와 관련하여 무시될 수 있다는 것입니다. [ 57 ]
서로 다른 기본 메커니즘을 더 잘 이해하려면피- 브이피-V조건에서 응고 모델링이 수행됩니다. 첫 번째 목적은 스트레이 그레인의 전체 범위를 평가하는 것입니다(Φ¯¯¯¯Φ¯) 처리 매개 변수의 함수로 국부적 표류 입자 비율의 변화를 조사하기 위해 (ΦΦ) 용융 풀의 위치 함수로. 두 번째 목적은 금속 AM의 빠른 응고 동안 응고 미세 구조와 표류 입자 형성 메커니즘 사이의 관계를 이해하는 것입니다.
그림 4
그림 4 는 해석적으로 시뮬레이션된 표류 입자 비율을 보여줍니다.Φ¯¯¯¯Φ¯세 가지 레이저 흡수율 값에서 다양한 레이저 스캐닝 속도 및 레이저 출력에 대해. 결과는 스트레이 그레인 면적 비율이 흡수된 에너지에 민감하다는 것을 보여줍니다. 흡수율을 0.30에서 0.80으로 증가시키면Φ¯¯¯¯Φ¯약 3배이며, 이 효과는 저속 및 고출력 영역에서 더욱 두드러집니다. 다른 모든 조건이 같다면, 흡수된 전력의 큰 영향은 평균 열 구배 크기의 일반적인 감소와 용융 풀 내 평균 응고율의 증가에 기인합니다. 스캐닝 속도가 증가하고 전력이 감소함에 따라 평균 스트레이 그레인 비율이 감소합니다. 이러한 일반적인 경향은 Vitek의 작업에서 채택된 그림 5 의 파란색 영역에서 시뮬레이션된 용접 결과와 일치합니다 . [ 3 ] 더 큰 과냉각 구역( 즉, 지 /V티G/V티영역)은 용접 풀의 표유 입자의 면적 비율이 분홍색 영역에 해당하는 LPBF 조건의 면적 비율보다 훨씬 더 크다는 것을 의미합니다. 그럼에도 불구하고 두 데이터 세트의 일반적인 경향은 유사합니다. 즉 , 레이저 출력이 감소하고 레이저 속도가 증가함에 따라 표류 입자의 비율이 감소합니다. 또한 그림 5 에서 스캐닝 속도가 LPBF 영역으로 증가함에 따라 표유 입자 면적 분율에 대한 레이저 매개변수의 변화 효과가 감소한다는 것을 추론할 수 있습니다. 그림 6 (a)는 그림 3 의 EBSD 분석에서 나온 실험적 표류 결정립 면적 분율 과 그림 4 의 해석 시뮬레이션 결과를 비교합니다.. 열쇠 구멍 모양의 FZ에서 정확한 값이 다르지만 추세는 시뮬레이션과 실험 데이터 모두에서 일관되었습니다. 키홀 모양의 용융 풀, 특히 전력이 300W인 2개는 분석 시뮬레이션 예측보다 훨씬 더 많은 양의 흩어진 입자를 가지고 있습니다. Rosenthal 방정식은 일반적으로 열 전달이 순전히 전도에 의해 좌우된다는 가정으로 인해 열쇠 구멍 체제의 열 흐름을 적절하게 반영하지 못하기 때문에 이러한 불일치가 실제로 예상됩니다. [ 39 , 40 ] 그것은 또한 그림 4 의 발견 , 즉 키홀 모드 동안 흡수된 전력의 증가가 표류 입자 형성에 더 이상적인 조건을 초래한다는 것을 검증합니다. 그림 6 (b)는 실험을 비교Φ¯¯¯¯Φ¯수치 CFD 시뮬레이션Φ¯¯¯¯Φ¯. CFD 모델이 약간 초과 예측하지만Φ¯¯¯¯Φ¯전체적으로피- 브이피-V조건에서 열쇠 구멍 조건에서의 예측은 분석 모델보다 정확합니다. 전도 모드 용융 풀의 경우 실험 값이 분석 시뮬레이션 값과 더 가깝게 정렬됩니다.
그림 5
모의 온도 구배 G 분포 및 응고율 검사V티V티분석 모델링의 쌍은 그림 7 (a)의 CMSX-4 미세 구조 선택 맵에 표시됩니다. 제공지 /V티G/V티( 즉 , 형태 인자)는 형태를 제어하고지 ×V티G×V티( 즉 , 냉각 속도)는 응고된 미세 구조의 규모를 제어하고 , [ 58 , 59 ]지 -V티G-V티플롯은 전통적인 제조 공정과 AM 공정 모두에서 미세 구조 제어를 지원합니다. 이 플롯의 몇 가지 분명한 특징은 등축, 주상, 평면 전면 및 이러한 경계 근처의 전이 영역을 구분하는 경계입니다. 그림 7 (a)는 몇 가지 선택된 분석 열 시뮬레이션에 대한 미세 구조 선택 맵을 나타내는 반면 그림 7 (b)는 수치 열 모델의 결과와 동일한 맵을 보여줍니다. 등축 미세구조의 형성은 낮은 G 이상 에서 명확하게 선호됩니다.V티V티정황. 이 플롯에서 각 곡선의 평면 전면에 가장 가까운 지점은 용융 풀의 최대 너비 위치에 해당하는 반면 등축 영역에 가까운 지점의 끝은 용융 풀의 후면 꼬리에 해당합니다. 그림 7 (a)에서 대부분의지 -V티G-V티응고 전면의 쌍은 원주형 영역에 속하고 점차 CET 영역으로 위쪽으로 이동하지만 용융 풀의 꼬리는 다음에 따라 완전히 등축 영역에 도달하거나 도달하지 않을 수 있습니다.피- 브이피-V조합. 그림 7 (a) 의 곡선 중 어느 것도 평면 전면 영역을 통과하지 않지만 더 높은 전력의 경우에 가까워집니다. 저속 레이저 용융 공정을 사용하는 이전 작업에서는 곡선이 평면 영역을 통과할 수 있습니다. 레이저 속도가 증가함에 따라 용융 풀 꼬리는 여전히 CET 영역에 있지만 완전히 등축 영역에서 멀어집니다. CET 영역으로 떨어지는 섹션의 수도 감소합니다.Φ¯¯¯¯Φ¯응고된 물질에서.
그림 6
그만큼지 -V티G-V티CFD 모델을 사용하여 시뮬레이션된 응고 전면의 쌍이 그림 7 (b)에 나와 있습니다. 세 방향 모두에서 각 점 사이의 일정한 간격으로 미리 정의된 좌표에서 수행된 해석 시뮬레이션과 달리, 고충실도 CFD 모델의 출력은 불규칙한 사면체 좌표계에 있었고 G 를 추출하기 전에 일반 3D 그리드에 선형 보간되었습니다. 그리고V티V티그런 다음 미세 구조 선택 맵에 플롯됩니다. 일반적인 경향은 그림 7 (a)의 것과 일치하지만 이 방법으로 모델링된 매우 동적인 유체 흐름으로 인해 결과에 더 많은 분산이 있었습니다. 그만큼지 -V티G-V티분석 열 모델의 쌍 경로는 더 연속적인 반면 수치 시뮬레이션의 경로는 용융 풀 꼬리 모양의 차이를 나타내는 날카로운 굴곡이 있습니다(이는 G 및V티V티) 두 모델에 의해 시뮬레이션됩니다.
그림 7그림 8
유체 흐름을 통합한 응고 모델링
수치 CFD 모델을 사용하여 유동 입자 형성 정도에 대한 유체 흐름의 영향을 이해하고 시뮬레이션 결과를 분석 Rosenthal 솔루션과 비교했습니다. 그림 8 은 응고 매개변수 G 의 분포를 보여줍니다.V티V티,지 /V티G/V티, 그리고지 ×V티G×V티yz 단면에서 x 는 FLOW-3D에서 (a1–d1) 분석 열 모델링 및 (a2–d2) FVM 방법을 사용하여 시뮬레이션된 용융 풀의 최대 폭입니다. 그림 8 의 값은 응고 전선이 특정 위치에 도달할 때 정확한 값일 수도 있고 아닐 수도 있지만 일반적인 추세를 반영한다는 의미의 임시 가상 값입니다. 이 프로파일은 출력 300W 및 속도 400mm/s의 레이저 빔에서 시뮬레이션됩니다. 용융 풀 경계는 흰색 곡선으로 표시됩니다. (a2–d2)의 CFD 시뮬레이션 용융 풀 깊이는 342입니다. μμm, 측정 깊이 352와 잘 일치 μμ일치하는 길쭉한 열쇠 구멍 모양과 함께 그림 1 에 표시된 실험 FZ의 m . 그러나 분석 모델은 반원 모양의 용융 풀을 출력하고 용융 풀 깊이는 264에 불과합니다. μμ열쇠 구멍의 경우 현실과는 거리가 멀다. CFD 시뮬레이션 결과에서 열 구배는 레이저 반사 증가와 불안정한 액체-증기 상호 작용이 발생하는 증기 함몰의 동적 부분 근처에 있기 때문에 FZ 하단에서 더 높습니다. 대조적으로 해석 결과의 열 구배 크기는 경계를 따라 균일합니다. 두 시뮬레이션 결과 모두 그림 8 (a1) 및 (a2) 에서 응고가 용융 풀의 상단 중심선을 향해 진행됨에 따라 열 구배가 점차 감소합니다 . 응고율은 그림 8 과 같이 경계 근처에서 거의 0입니다. (b1) 및 (b2). 이는 경계 영역이 응고되기 시작할 때 국부 응고 전면의 법선 방향이 레이저 스캐닝 방향에 수직이기 때문입니다. 이것은 드라이브θ → π/ 2θ→파이/2그리고V티→ 0V티→0식에서 [ 3 ]. 대조적으로 용융 풀의 상단 중심선 근처 영역에서 응고 전면의 법선 방향은 레이저 스캐닝 방향과 잘 정렬되어 있습니다.θ → 0θ→0그리고V티→ 브이V티→V, 빔 스캐닝 속도. G 와 _V티V티값이 얻어지면 냉각 속도지 ×V티G×V티및 형태 인자지 /V티G/V티계산할 수 있습니다. 그림 8 (c2)는 용융 풀 바닥 근처의 온도 구배가 매우 높고 상단에서 더 빠른 성장 속도로 인해 냉각 속도가 용융 풀의 바닥 및 상단 중심선 근처에서 더 높다는 것을 보여줍니다. 지역. 그러나 이러한 추세는 그림 8 (c1)에 캡처되지 않았습니다. 그림 8 의 형태 요인 (d1) 및 (d2)는 중심선에 접근함에 따라 눈에 띄게 감소합니다. 경계에서 큰 값은 열 구배를 거의 0인 성장 속도로 나누기 때문에 발생합니다. 이 높은 형태 인자는 주상 미세구조 형성 가능성이 높음을 시사하는 반면, 중앙 영역의 값이 낮을수록 등축 미세구조의 가능성이 더 크다는 것을 나타냅니다. Tanet al. 또한 키홀 모양의 용접 풀 [ 59 ] 에서 이러한 응고 매개변수의 분포 를 비슷한 일반적인 경향으로 보여주었습니다. 그림 3 에서 볼 수 있듯이 용융 풀의 상단 중심선에 있는 흩어진 입자는 낮은 특징을 나타내는 영역과 일치합니다.지 /V티G/V티그림 8 (d1) 및 (d2)의 값. 시뮬레이션과 실험 간의 이러한 일치는 용융 풀의 상단 중심선에 축적된 흩어진 입자의 핵 생성 및 성장이 등온선 속도의 증가와 온도 구배의 감소에 의해 촉진됨을 보여줍니다.
그림 9
그림 9 는 유체 속도 및 국부적 핵형성 성향을 보여줍니다.ΦΦ300W의 일정한 레이저 출력과 400, 800 및 1200mm/s의 세 가지 다른 레이저 속도에 의해 생성된 3D 용융 풀 전체에 걸쳐. 그림 9 (d)~(f)는 로컬ΦΦ해당 3D 보기에서 밝은 회색 평면으로 표시된 특정 yz 단면의 분포. 이 yz 섹션은 가장 높기 때문에 선택되었습니다.Φ¯¯¯¯Φ¯용융 풀 내의 값은 각각 23.40, 11.85 및 2.45pct입니다. 이들은 그림 3 의 실험 데이터와 비교하기에 적절하지 않을 수 있는 액체 용융 풀의 과도 값이며Φ¯¯¯¯Φ¯그림 6 의 값은 이 값이 고체-액체 계면에 가깝지 않고 용융 풀의 중간에서 취해졌기 때문입니다. 온도가 훨씬 낮아서 핵이 생존하고 성장할 수 있기 때문에 핵 형성은 용융 풀의 중간이 아닌 고체-액체 계면에 더 가깝게 발생할 가능성이 있습니다.
그림 3 (a), (d), (g), (h)에서 위쪽 중심선에서 멀리 떨어져 있는 흩어진 결정립이 있었습니다. 그들은 훨씬 더 높은 열 구배와 더 낮은 응고 속도 필드에 위치하기 때문에 과냉각 이론은 이러한 영역에서 표류 입자의 형성에 대한 만족스러운 설명이 아닙니다. 이것은 떠돌이 결정립의 형성을 야기할 수 있는 두 번째 메커니즘, 즉 수상돌기의 팁을 가로지르는 유체 흐름에 의해 유발되는 수상돌기 조각화를 고려하도록 동기를 부여합니다. 유체 흐름이 열 구배를 따라 속도 성분을 갖고 고체-액체 계면 속도보다 클 때, 주상 수상돌기의 국지적 재용융은 용질이 풍부한 액체가 흐물흐물한 구역의 깊은 곳에서 액상선 등온선까지 이동함으로써 발생할 수 있습니다. . [ 55] 분리된 수상돌기는 대류에 의해 열린 액체로 운반될 수 있습니다. 풀이 과냉각 상태이기 때문에 이러한 파편은 고온 조건에서 충분히 오래 생존하여 길 잃은 입자의 핵 생성 사이트로 작용할 수 있습니다. 결과적으로 수상 돌기 조각화 과정은 활성 핵의 수를 효과적으로 증가시킬 수 있습니다.N0N0) 용융 풀 [ 15 , 60 , 61 ] 에서 생성된 미세 구조에서 표류 입자의 면적을 증가시킵니다.
그림 9 (a) 및 (b)에서 반동 압력은 용융 유체를 아래쪽으로 흐르게 하여 결과 흐름을 지배합니다. 유체 속도의 역방향 요소는 V = 400 및 800mm/s에 대해 각각 최대값 1.0 및 1.6m/s로 더 느려집니다 . 그림 9 (c)에서 레이저 속도가 더 증가함에 따라 증기 침하가 더 얕고 넓어지고 반동 압력이 더 고르게 분포되어 증기 침강에서 주변 영역으로 유체를 밀어냅니다. 역류는 최대값 3.5m/s로 더 빨라집니다. 용융 풀의 최대 너비에서 yz 단면 의 키홀 아래 평균 유체 속도는 그림에 표시된 경우에 대해 0.46, 0.45 및 1.44m/s입니다.9 (a), (b) 및 (c). 키홀 깊이의 변동은 각 경우의 최대 깊이와 최소 깊이의 차이로 정의되는 크기로 정량화됩니다. 240 범위의 강한 증기 내림 변동 μμm은 그림 9 (a)의 V = 400mm/s 경우에서 발견 되지만 이 변동은 그림 9 (c)에서 16의 범위로 크게 감소합니다.μμ미디엄. V = 400mm/s인 경우 의 유체장과 높은 변동 범위는 이전 키홀 동역학 시뮬레이션과 일치합니다. [ 34 ]
따라서 V = 400mm/s 키홀 케이스의 무질서한 변동 흐름이 용융 풀 경계를 따라 응고된 주상 수상돌기에서 분리된 조각을 구동할 가능성이 있습니다. V = 1200mm/s의 경우 강한 역류 는 그림 3 에서 관찰되지 않았지만 동일한 효과를 가질 수 있습니다. . 덴드라이트 조각화에 대한 유체 유동장의 영향에 대한 이 경험적 설명은 용융 풀 경계 근처에 떠돌이 입자의 존재에 대한 그럴듯한 설명을 제공합니다. 분명히 하기 위해, 우리는 이 가설을 검증하기 위해 이 현상에 대한 직접적인 실험적 관찰을 하지 않았습니다. 이 작업에서 표유 입자 면적 분율을 계산할 때 단순화를 위해 핵 생성 모델링에 일정한 핵 생성 수 밀도가 적용되었습니다. 이는 그림 9 의 표류 입자 영역 비율 이 수지상정 조각화가 발생하는 경우 이러한 높은 유체 흐름 용융 풀에서 발생할 수 있는 것, 즉 강화된 핵 생성 밀도를 반영하지 않는다는 것을 의미합니다.
위의 이유로 핵 형성에 대한 수상 돌기 조각화의 영향을 아직 배제할 수 없습니다. 그러나 단편화 이론은 용접 문헌 [ 62 ] 에서 검증될 만큼 충분히 개발되지 않았 으므로 부차적인 중요성만 고려된다는 점에 유의해야 합니다. 1200mm/s를 초과하는 레이저 스캐닝 속도는 최소한의 표류 결정립 면적 분율을 가지고 있음에도 불구하고 분명한 볼링을 나타내기 때문에 단결정 수리 및 AM 처리에 적합하지 않습니다. 따라서 낮은 P 및 높은 V 에 의해 생성된 응고 전면 근처에서 키홀 변동이 최소화되고 유체 속도가 완만해진 용융 풀이 생성된다는 결론을 내릴 수 있습니다., 처리 창의 극한은 아니지만 흩어진 입자를 나타낼 가능성이 가장 적습니다.
마지막으로 단일 레이저 트랙의 응고 거동을 조사하면 에피택셜 성장 동안 표류 입자 형성을 더 잘 이해할 수 있다는 점에 주목하는 것이 중요합니다. 우리의 현재 결과는 최적의 레이저 매개변수에 대한 일반적인 지침을 제공하여 최소 스트레이 그레인을 달성하고 단결정 구조를 유지합니다. 이 가이드라인은 250W 정도의 전력과 600~800mm/s의 스캔 속도로 최소 흩어진 입자에 적합한 공정 창을 제공합니다. 각 처리 매개변수를 신중하게 선택하면 과거에 스테인리스강에 대한 거의 단결정 미세 구조를 인쇄하는 데 성공했으며 이는 CMSX-4 AM 빌드에 대한 가능성을 보여줍니다. [ 63 ]신뢰성을 보장하기 위해 AM 수리 프로세스를 시작하기 전에 보다 엄격한 실험 테스트 및 시뮬레이션이 여전히 필요합니다. 둘 이상의 레이저 트랙 사이의 상호 작용도 고려해야 합니다. 또한 레이저, CMSX-4 분말 및 벌크 재료 간의 상호 작용이 중요하며, 수리 중에 여러 층의 CMSX-4 재료를 축적해야 하는 경우 다른 스캔 전략의 효과도 중요한 역할을 할 수 있습니다. 분말이 포함된 경우 Lopez-Galilea 등 의 연구에서 제안한 바와 같이 분말이 주로 완전히 녹지 않았을 때 추가 핵 생성 사이트를 도입하기 때문에 단순히 레이저 분말과 속도를 조작하여 흩어진 입자 형성을 완화하기 어려울 수 있습니다 . [ 22 ]결과적으로 CMSX-4 단결정을 수리하기 위한 레이저 AM의 가능성을 다루기 위해서는 기판 재료, 레이저 출력, 속도, 해치 간격 및 층 두께의 조합을 모두 고려해야 하며 향후 연구에서 다루어야 합니다. CFD 모델링은 2개 이상의 레이저 트랙 사이의 상호작용과 열장에 미치는 영향을 통합할 수 있으며, 이는 AM 빌드 시나리오 동안 핵 생성 조건으로 단일 비드 연구의 지식 격차를 해소할 것입니다.
결론
LPBF 제조의 특징적인 조건 하에서 CMSX-4 단결정 의 에피택셜(기둥형) 대 등축 응고 사이의 경쟁을 실험적 및 이론적으로 모두 조사했습니다. 이 연구는 고전적인 응고 개념을 도입하여 빠른 레이저 용융의 미세 구조 특징을 설명하고 응고 조건과 표유 결정 성향을 예측하기 위해 해석적 및 수치적 고충실도 CFD 열 모델 간의 비교를 설명했습니다. 본 연구로부터 다음과 같은 주요 결론을 도출할 수 있다.
단일 레이저 트랙의 레이저 가공 조건은 용융 풀 형상, 레이저 흡수율, 유체 흐름 및 키홀 요동, 입자 구조 및 표류 입자 형성 민감성에 강한 영향을 미치는 것으로 밝혀졌습니다.
레이저 용접을 위해 개발된 이론적인 표유 결정립 핵형성 분석이 레이저 용융 AM 조건으로 확장되었습니다. 분석 모델링 결과와 단일 레이저 트랙의 미세구조 특성화를 비교하면 예측이 전도 및 볼링 조건에서 실험적 관찰과 잘 일치하는 반면 키홀 조건에서는 예측이 약간 과소하다는 것을 알 수 있습니다. 이러한 불일치는 레이저 트랙의 대표성이 없는 섹션이나 유체 속도 필드의 변화로 인해 발생할 수 있습니다. CFD 모델에서 추출한 열장에 동일한 표유 입자 계산 파이프라인을 적용하면 연구된 모든 사례에서 과대평가가 발생하지만 분석 모델보다 연장된 용융 풀의 실험 데이터와 더 정확하게 일치합니다.
이 연구에서 두 가지 표류 결정립 형성 메커니즘인 불균일 핵형성 및 수상돌기 조각화가 평가되었습니다. 우리의 결과는 불균일 핵형성이 용융 풀의 상단 중심선에서 새로운 결정립의 형성으로 이어지는 주요 메커니즘임을 시사합니다.지 /V티G/V티정권.
용융 풀 경계 근처의 흩어진 입자는 깊은 키홀 모양의 용융 풀에서 독점적으로 관찰되며, 이는 강한 유체 흐름으로 인한 수상 돌기 조각화의 영향이 이러한 유형의 용융 풀에서 고려하기에 충분히 강력할 수 있음을 시사합니다.
일반적으로 더 높은 레이저 스캐닝 속도와 더 낮은 전력 외에도 안정적인 키홀과 최소 유체 속도는 또한 흩어진 입자 형성을 완화하고 레이저 단일 트랙에서 에피택셜 성장을 보존합니다.
References
R.C. Reed: The Superalloys: Fundamentals and Applications, Cambridge University Press, Cambridge, 2006, pp.17–20.BookGoogle Scholar
A. Basak, R. Acharya, and S. Das: Metall. Mater. Trans. A, 2016, vol. 47A, pp. 3845–59.ArticleGoogle Scholar
R. Vilar and A. Almeida: J. Laser Appl., 2015, vol. 27, p. S17004.ArticleGoogle Scholar
T. Kalfhaus, M. Schneider, B. Ruttert, D. Sebold, T. Hammerschmidt, J. Frenzel, R. Drautz, W. Theisen, G. Eggeler, O. Guillon, and R. Vassen: Mater. Des., 2019, vol. 168, p. 107656.ArticleCASGoogle Scholar
S.S. Babu, S.A. David, J.W. Park, and J.M. Vitek: Sci. Technol. Weld. Join., 2004, vol. 9, pp. 1–12.ArticleCASGoogle Scholar
L. Felberbaum, K. Voisey, M. Gäumann, B. Viguier, and A. Mortensen: Mater. Sci. Eng. A, 2001, vol. 299, pp. 152–56.ArticleGoogle Scholar
S. Mokadem, C. Bezençon, J.M. Drezet, A. Jacot, J.D. Wagnière, and W. Kurz: TMS Annual Meeting, 2004, pp. 67–76.
J.M. Vitek: ASM Proc. Int. Conf. Trends Weld. Res., vol. 2005, pp. 773–79.
B. Kianian: Wohlers Report 2017: 3D Printing and Additive Manufacturing State of the Industry, Annual Worldwide Progress Report, Wohlers Associates, Inc., Fort Collins, 2017.Google Scholar
M. Ramsperger, L. Mújica Roncery, I. Lopez-Galilea, R.F. Singer, W. Theisen, and C. Körner: Adv. Eng. Mater., 2015, vol. 17, pp. 1486–93.ArticleCASGoogle Scholar
A.B. Parsa, M. Ramsperger, A. Kostka, C. Somsen, C. Körner, and G. Eggeler: Metals, 2016, vol. 6, pp. 258-1–17.ArticleGoogle Scholar
C. Körner, M. Ramsperger, C. Meid, D. Bürger, P. Wollgramm, M. Bartsch, and G. Eggeler: Metall. Mater. Trans. A, 2018, vol. 49A, pp. 3781–92.ArticleGoogle Scholar
D. Bürger, A. Parsa, M. Ramsperger, C. Körner, and G. Eggeler: Mater. Sci. Eng. A, 2019, vol. 762, p. 138098,ArticleGoogle Scholar
R. Cunningham, C. Zhao, N. Parab, C. Kantzos, J. Pauza, K. Fezzaa, T. Sun, and A.D. Rollett: Science, 2019, vol. 363, pp. 849–52.ArticleCASGoogle Scholar
B. Fotovvati, S.F. Wayne, G. Lewis, and E. Asadi: Adv. Mater. Sci. Eng., 2018, vol. 2018, p. 4920718.ArticleGoogle Scholar
P.-J. Chiang, R. Jiang, R. Cunningham, N. Parab, C. Zhao, K. Fezzaa, T. Sun, and A.D. Rollett: in Advanced Real Time Imaging II, pp. 77–85.
J. Ye, S.A. Khairallah, A.M. Rubenchik, M.F. Crumb, G. Guss, J. Belak, and M.J. Matthews: Adv. Eng. Mater., 2019, vol. 21, pp. 1–9.ArticleGoogle Scholar
C. Zhao, Q. Guo, X. Li, N. Parab, K. Fezzaa, W. Tan, L. Chen, and T. Sun: Phys. Rev. X, 2019, vol. 9, p. 021052.CASGoogle Scholar
S.A. Khairallah, A.T. Anderson, A. Rubenchik, and W.E. King: Acta Mater., 2016, vol. 108, pp. 36–45.ArticleCASGoogle Scholar
N. Kouraytem, X. Li, R. Cunningham, C. Zhao, N. Parab, T. Sun, A.D. Rollett, A.D. Spear, and W. Tan: Appl. Phys. Rev., 2019, vol. 11, p. 064054.ArticleCASGoogle Scholar
T. DebRoy, H. Wei, J. Zuback, T. Mukherjee, J. Elmer, J. Milewski, A. Beese, A. Wilson-Heid, A. De, and W. Zhang: Prog. Mater. Sci., 2018, vol. 92, pp. 112–224.ArticleCASGoogle Scholar
I. Yadroitsev, A. Gusarov, I. Yadroitsava, and I. Smurov: J. Mater. Process. Technol., 2010, vol. 210, pp. 1624–31.ArticleCASGoogle Scholar
S. Ghosh, L. Ma, L.E. Levine, R.E. Ricker, M.R. Stoudt, J.C. Heigel, and J.E. Guyer: JOM, 2018, vol. 70, pp. 1011–16.ArticleCASGoogle Scholar
Y. He, C. Montgomery, J. Beuth, and B. Webler: Mater. Des., 2019, vol. 183, p. 108126.ArticleCASGoogle Scholar
D. Rosenthal: Weld. J., 1941, vol. 20, pp. 220–34.Google Scholar
M. Tang, P.C. Pistorius, and J.L. Beuth: Addit. Manuf., 2017, vol. 14, pp. 39–48.CASGoogle Scholar
R.E. Aune, L. Battezzati, R. Brooks, I. Egry, H.J. Fecht, J.P. Garandet, M. Hayashi, K.C. Mills, A. Passerone, P.N. Quested, E. Ricci, F. Schmidt-Hohagen, S. Seetharaman, B. Vinet, and R.K. Wunderlich: Proc. Int.Symp. Superalloys Var. Deriv., 2005, pp. 467–76.
B.C. Wilson, J.A. Hickman, and G.E. Fuchs: JOM, 2003, vol. 55, pp. 35–40.ArticleCASGoogle Scholar
J.J. Valencia and P.N. Quested: ASM Handb., 2008, vol. 15, pp. 468–81.Google Scholar
H.L. Wei, J. Mazumder, and T. DebRoy: Sci. Rep., 2015, vol. 5, pp. 1–7.Google Scholar
N. Raghavan, R. Dehoff, S. Pannala, S. Simunovic, M. Kirka, J. Turner, N. Carlson, and S.S. Babu: Acta Mater., 2016, vol. 112, pp. 303–14.ArticleCASGoogle Scholar
R. Lin, H. Wang, F. Lu, J. Solomon, and B.E. Carlson: Int. J. Heat Mass Transf., 2017, vol. 108, pp. 244–56.ArticleCASGoogle Scholar
M. Bayat, A. Thanki, S. Mohanty, A. Witvrouw, S. Yang, J. Thorborg, N.S. Tiedje, and J.H. Hattel: Addit. Manuf., 2019, vol. 30, p. 100835.CASGoogle Scholar
K. Higuchi, H.-J. Fecht, and R.K. Wunderlich: Adv. Eng. Mater., 2007, vol. 9, pp. 349–54.ArticleCASGoogle Scholar
Q. Guo, C. Zhao, M. Qu, L. Xiong, L.I. Escano, S.M.H. Hojjatzadeh, N.D. Parab, K. Fezzaa, W. Everhart, T. Sun, and L. Chen: Addit. Manuf., 2019, vol. 28, pp. 600–09.Google Scholar
J. Trapp, A.M. Rubenchik, G. Guss, and M.J. Matthews: Appl. Mater. Today, 2017, vol. 9, pp. 341–49.ArticleGoogle Scholar
M. Schneider, L. Berthe, R. Fabbro, and M. Muller: J. Phys. D, 2008, vol. 41, p. 155502.ArticleGoogle Scholar
Z. Gan, O.L. Kafka, N. Parab, C. Zhao, L. Fang, O. Heinonen, T. Sun, and W.K. Liu: Nat. Commun., 2021, vol. 12, p. 2379.ArticleCASGoogle Scholar
B.J. Simonds, E.J. Garboczi, T.A. Palmer, and P.A. Williams: Appl. Phys. Rev., 2020, vol. 13, p. 024057.ArticleCASGoogle Scholar
J. Dantzig and M. Rappaz: Solidification, 2nd ed., EPFL Press, Lausanne, 2016, pp. 483–532.Google Scholar
W. Tiller, K. Jackson, J. Rutter, and B. Chalmers: Acta Metall., 1953, vol. 1, pp. 428–37.ArticleCASGoogle Scholar
D. Zhang, A. Prasad, M.J. Bermingham, C.J. Todaro, M.J. Benoit, M.N. Patel, D. Qiu, D.H. StJohn, M. Qian, and M.A. Easton: Metall. Mater. Trans. A, 2020, vol. 51A, pp. 4341–59.ArticleGoogle Scholar
F. Yan, W. Xiong, and E.J. Faierson: Materials, 2017, vol. 10, p. 1260.ArticleGoogle Scholar
J.M. Vitek, S.A. David, and L.A. Boatner: Sci. Technol. Weld. Join., 1997, vol. 2, pp. 109–18.ArticleCASGoogle Scholar
X. Wang, J.A. Muñiz-Lerma, O. Sanchez-Mata, S.E. Atabay, M.A. Shandiz, and M. Brochu: Prog. Addit. Manuf., 2020, vol. 5, pp. 41–49.ArticleGoogle Scholar
레이저 금속 적층 제조(AM) 공정의 낮은 에너지 효율은 대규모 산업 생산에서 잠재적인 지속 가능성 문제입니다. 레이저 용융을 위한 에너지 효율의 명시적 조사는 용융 금속의 불투명한 특성으로 인해 매우 어려운 용융 풀 치수 및 증기 내림의 직접적인 특성화를 요구합니다.
여기에서 우리는 현장 고속 고에너지 x-선 이미징에 의해 Al6061의 레이저 분말 베드 융합(LPBF) 동안 증기 강하 및 용융 풀 형성에 대한 TiC 나노 입자의 효과에 대한 직접적인 관찰 및 정량화를 보고합니다. 정량 결과를 바탕으로, 우리는 Al6061의 LPBF 동안 TiC 나노 입자가 있거나 없을 때 레이저 용융 에너지 효율(여기서 재료를 용융하는 데 필요한 에너지 대 레이저 빔에 의해 전달되는 에너지의 비율로 정의)을 계산했습니다.
결과는 TiC 나노 입자를 Al6061에 추가하면 레이저 용융 에너지 효율이 크게 증가한다는 것을 보여줍니다(평균 114% 증가, 312에서 521% 증가). W 레이저 출력, 0.4m /s 스캔 속도). 체계적인 특성 측정, 시뮬레이션 및 x-선 이미징 연구를 통해 우리는 처음으로 세 가지 메커니즘이 함께 작동하여 레이저 용융 에너지 효율을 향상시킨다는 것을 확인할 수 있었습니다.
(1) TiC 나노 입자를 추가하면 흡수율이 증가합니다. (2) TiC 나노입자를 추가하면 열전도율이 감소하고, (3) TiC 나노입자를 추가하면 더 낮은 레이저 출력에서 증기 억제 및 다중 반사를 시작할 수 있습니다(즉, 키홀링에 대한 레이저 출력 임계값을 낮춤).
여기서 보고한 Al6061의 LPBF 동안 레이저 용융 에너지 효율을 증가시키기 위해 TiC 나노입자를 사용하는 방법 및 메커니즘은 보다 에너지 효율적인 레이저 금속 AM을 위한 공급원료 재료의 개발을 안내할 수 있습니다.
The low energy efficiency of the laser metal additive manufacturing (AM) process is a potential sustainability concern for large-scale industrial production. Explicit investigation of the energy efficiency for laser melting requires the direct characterization of melt pool dimension and vapor depression, which is very difficult due to the opaque nature of the molten metal. Here we report the direct observation and quantification of effects of the TiC nanoparticles on the vapor depression and melt pool formation during laser powder bed fusion (LPBF) of Al6061 by in-situ high-speed high-energy x-ray imaging. Based on the quantification results, we calculated the laser melting energy efficiency (defined here as the ratio of the energy needed to melt the material to the energy delivered by the laser beam) with and without TiC nanoparticles during LPBF of Al6061. The results show that adding TiC nanoparticles into Al6061 leads to a significant increase of laser melting energy efficiency (114% increase on average, 521% increase under 312 W laser power, 0.4 m/s scan speed). Systematic property measurement, simulation, and x-ray imaging studies enable us, for the first time, to identify that three mechanisms work together to enhance the laser melting energy efficiency: (1) adding TiC nanoparticles increases the absorptivity; (2) adding TiC nanoparticles decreases the thermal conductivity, and (3) adding TiC nanoparticles enables the initiation of vapor depression and multiple reflection at lower laser power (i.e., lowers the laser power threshold for keyholing). The method and mechanisms of using TiC nanoparticles to increase the laser melting energy efficiency during LPBF of Al6061 we reported here may guide the development of feedstock materials for more energy efficient laser metal AM.
Nanoparticle-enabled increase of energy efficiency during laser metal additive manufacturing
린 첸 가오 양 미시 옹 장 춘밍 왕 Lin Chen , Gaoyang Mi , Xiong Zhang , Chunming Wang * 중국 우한시 화중과학기술대학 재료공학부, 430074
Effects of sinusoidal oscillating laser beam on weld formation, melt flow and grain structure during aluminum alloys lap welding
Abstract
A numerical model of 1.5 mm 6061/5182 aluminum alloys thin sheets lap joints under laser sinusoidal oscillation (sine) welding and laser welding (SLW) weld was developed to simulate temperature distribution and melt flow. Unlike the common energy distribution of SLW, the sinusoidal oscillation of laser beam greatly homogenized the energy distribution and reduced the energy peak. The energy peaks were located at both sides of the sine weld, resulting in the tooth-shaped sectional formation. This paper illustrated the effect of the temperature gradient (G) and solidification rate (R) on the solidification microstructure by simulation. Results indicated that the center of the sine weld had a wider area with low G/R, promoting the formation of a wider equiaxed grain zone, and the columnar grains were slenderer because of greater GR. The porosity-free and non-penetration welds were obtained by the laser sinusoidal oscillation. The reasons were that the molten pool volume was enlarged, the volume proportion of keyhole was reduced and the turbulence in the molten pool was gentled, which was observed by the high-speed imaging and simulation results of melt flow. The tensile test of both welds showed a tensile fracture form along the fusion line, and the tensile strength of sine weld was significantly better than that of the SLW weld. This was because that the wider equiaxed grain area reduced the tendency of cracks and the finer grain size close to the fracture location. Defect-free and excellent welds are of great significance to the new energy vehicles industry.
온도 분포 및 용융 흐름을 시뮬레이션하기 위해 레이저 사인파 진동 (사인) 용접 및 레이저 용접 (SLW) 용접에서 1.5mm 6061/5182 알루미늄 합금 박판 랩 조인트 의 수치 모델이 개발되었습니다. SLW의 일반적인 에너지 분포와 달리 레이저 빔의 사인파 진동은 에너지 분포를 크게 균질화하고 에너지 피크를 줄였습니다. 에너지 피크는 사인 용접의 양쪽에 위치하여 톱니 모양의 단면이 형성되었습니다. 이 논문은 온도 구배(G)와 응고 속도 의 영향을 설명했습니다.(R) 시뮬레이션에 의한 응고 미세 구조. 결과는 사인 용접의 중심이 낮은 G/R로 더 넓은 영역을 가짐으로써 더 넓은 등축 결정립 영역의 형성을 촉진하고 더 큰 GR로 인해 주상 결정립 이 더 가늘다는 것을 나타냅니다. 다공성 및 비관통 용접은 레이저 사인파 진동에 의해 얻어졌습니다. 그 이유는 용융 풀의 부피가 확대되고 열쇠 구멍의 부피 비율이 감소하며 용융 풀의 난류가 완만해졌기 때문이며, 이는 용융 흐름의 고속 이미징 및 시뮬레이션 결과에서 관찰되었습니다. 두 용접부 의 인장시험 은 융착선을 따라 인장파괴형태를인장강도사인 용접의 경우 SLW 용접보다 훨씬 우수했습니다. 이는 등축 결정립 영역이 넓을수록 균열 경향이 감소하고 파단 위치에 근접한 입자 크기가 미세 하기 때문입니다. 결함이 없고 우수한 용접은 신에너지 자동차 산업에 매우 중요합니다.
Fig. 1. Schematic of lap welding for 6061/5182 aluminum alloys.Fig. 2. Finite element mesh.Fig. 3. Weld morphologies of cross-section and upper surface for the two welds: (a) sine pattern weld; (b) SLW weld.Fig. 4. Calculation of laser energy distribution: (a)-(c) sine pattern weld; (d)-(f) SLW weld.Fig. 5. The partially melted region of zone A.Fig. 6. The simulated profiles of melted region for the two welds: (a) SLW weld; (b) sine pattern weld. Fig. 7. The temperature field simulation results of cross section for sine pattern weld.
Fig. 8. Dynamic behavior of the molten pool at the same time interval of 0.004 s within one oscillating period: (a) SLW weld; (b) sine pattern weld. Fig. 9. The temperature field and flow field of the molten pool for the SLW weld: (a)~(f) t = 80 ms~100 ms. Fig. 10. The temperature field and flow field of the molten pool for the sine pattern weld: (a)~(f) t = 151 ms~171 ms.Fig. 11. The evolution of the molten pool volume and keyhole depth within one period. Fig. 12. The X-ray inspection results for the two welds: (a) SLW weld, (b) sine pattern weld. Fig. 13. Comparison of the solidification parameters for sine and SLW patterns: (a) the temperature field simulated results of the molten pool upper surfaces; (b)
temperature gradient G and solidification rate R along the molten pool boundary isotherm from weld centerline to the fusion boundary; (c) G/R; (d) GR. Fig. 14. The EBSD results of equiaxed grain zone in the weld center of: (a) sine pattern weld; (b) SLW weld; (c) grain size. Fig. 15. (a) EBSD results of horizontal sections of SLW weld and sine pattern weld; (b) The columnar crystal widths of SLW weld and sine pattern weld. Fig. 16. (a) The tensile test results of the two welds; (b) Fracture location of SLW weld; (b) Fracture location of sine pattern weld.
Keywords
Laser welding, Sinusoidal oscillating, Energy distribution, Numerical simulation, Molten pool flow, Grain structure
References
Chen, X., 2014. Study on laser-MAG Hybrid Weaving Welding Charateristics. Master thesis. Harbin Institute of Technology, China. Chen, G., Wang, B., Mao, S., Zhong, P., He, J., 2019. Research on the “∞”-shaped laser scanning welding process for aluminum alloy. Opt. Laser Technol. 115, 32–41. Cho, W.-I., Na, S.-J., Cho, M.-H., Lee, J.-S., 2010. Numerical study of alloying element distribution in CO2 laser–GMA hybrid welding. Comput. Mater. Sci. 49, 792–800. Cho, W.-I., Na, S.-J., Thomy, C., Vollertsen, F., 2012. Numerical simulation of molten pool dynamics in high power disk laser welding. J. Mater. Process. Technol. 212, 262–275. Das, A., Butterworth, I., Masters, I., Williams, D., 2018. Microstructure and mechanical properties of gap-bridged remote laser welded (RLW) automotive grade AA 5182 joints. Mater. Charact. 145, 697–712. Fetzer, F., Sommer, M., Weber, R., Weberpals, J.-P., Graf, T., 2018. Reduction of pores by means of laser beam oscillation during remote welding of AlMgSi. Opt. Lasers Eng. 108, 68–77. Geng, S., Jiang, P., Shao, X., Guo, L., Gao, X., 2020. Heat transfer and fluid flow and their effects on the solidification microstructure in full-penetration laser welding of aluminum sheet. J. Mater. Sci. Technol. 46, 50–63. Hagenlocher, C., Sommer, M., Fetzer, F., Weber, R., Graf, T., 2018a. Optimization of the solidification conditions by means of beam oscillation during laser beam welding of aluminum. Mater. Des. 160, 1178–1185. Hagenlocher, C., Weller, D., Weber, R., Graf, T., 2018b. Reduction of the hot cracking susceptibility of laser beam welds in AlMgSi alloys by increasing the number of grain boundaries. Sci. Technol. Weld. Join. 24, 313–319. Hagenlocher, C., Fetzer, F., Weller, D., Weber, R., Graf, T., 2019. Explicit analytical expressions for the influence of welding parameters on the grain structure of laser beam welds in aluminium alloys. Mater. Des. 174, 107791. Han, X., Tang, X., Wang, T., Shao, C., Lu, F., Cui, H., 2018. Role of ambient pressure in keyhole dynamics based on beam transmission path method for laser welding on Al alloy. Int. J. Adv. Manuf. Technol. 99, 1639–1651. Hao, K., Li, G., Gao, M., Zeng, X., 2015. Weld formation mechanism of fiber laser oscillating welding of austenitic stainless steel. J. Mater. Process. Technol. 225, 77–83. Hirt, C.W., Nichols, B.D., 1981. Volume of fluid (VOF) method for the dynamics of free boundaries. J. Comput. Phys. 39, 201–225. Jiang, Z., Chen, X., Li, H., Lei, Z., Chen, Y., Wu, S., Wang, Y., 2020. Grain refinement and laser energy distribution during laser oscillating welding of Invar alloy. Mater. Des. 186, 108195. Kaplan, A., 1994. A model of deep penetration laser welding based on calculation of the keyhole profile. J. Phys. D Appl. Phys. 27, 1805–1814. Kou, S., 2002. Welding Metallurgy, 2nd ed. Wiley-Interscience, New Jersey, USA. Kuryntsev, S.V., Gilmutdinov, A.K., 2015. The effect of laser beam wobbling mode in welding process for structural steels. Int. J. Adv. Manuf. Technol. 81, 1683–1691. Li, P., Nie, F., Dong, H., Li, S., Yang, G., Zhang, H., 2018. Pulse MIG welding of 6061-T6/ A356-T6 aluminum alloy dissimilar T-joint. J. Mater. Eng. Perform. 27, 4760–4769. Liu, T., Mu, Z., Hu, R., Pang, S., 2019. Sinusoidal oscillating laser welding of 7075 aluminum alloy: hydrodynamics, porosity formation and optimization. Int. J. Heat Mass Transf. 140, 346–358. Seto, N., Katayama, S., Matsunawa, A., 2000. High-speed simultaneous observation of plasma and keyhole behavior during high power CO2 laser welding: effect of shielding gas on porosity formation. J. Laser Appl. 12, 245–250. Tang, Z., Vollertsen, F., 2014. Influence of grain refinement on hot cracking in laser welding of aluminum. Weld. World 58, 355–366. Wang, L., Gao, M., Zhang, C., Zeng, X., 2016. Effect of beam oscillating pattern on weld characterization of laser welding of AA6061-T6 aluminum alloy. Mater. Des. 108, 707–717. Wang, L., Gao, M., Zeng, X., 2018. Experiment and prediction of weld morphology for laser oscillating welding of AA6061 aluminium alloy. Sci. Technol. Weld. Join. 24, 334–341. Yamazaki, Y., Abe, Y., Hioki, Y., Nakatani, M., Kitagawa, A., Nakata, K., 2016. Fundamental study of narrow-gap welding with oscillation laser beam. Weld. Int. 30, 699–707. Yuan, Z., Tu, Y., Yuan, T., Zhang, Y., Huang, Y., 2021. Size effects on mechanical properties of pure industrial aluminum sheet for micro/meso scale plastic deformation: experiment and modeling. J. Alloys. Compd. 859, 157752. Zou, J., 2016. Characteristics of laser scanning welding process for 5A06 aluminum alloy thick plate with narrow gap. Materials Processing Engineering. Harbin Welding Institute, China. Master thesis.
316-L 스테인리스강의 레이저 분말 베드 융합 중 콜드 스패터 형성의 충실도 높은 수치 모델링
W.E. ALPHONSO1*, M. BAYAT1 and J.H. HATTEL1 *Corresponding author 1Technical University of Denmark (DTU), 2800, Kgs, Lyngby, Denmark
ABSTRACT
L-PBF(Laser Powder Bed Fusion)는 금속 적층 제조(MAM) 기술로, 기존 제조 공정에 비해 부품 설계 자유도, 조립품 통합, 부품 맞춤화 및 낮은 툴링 비용과 같은 여러 이점을 산업에 제공합니다.
전기 코일 및 열 관리 장치는 일반적으로 높은 전기 및 열 전도성 특성으로 인해 순수 구리로 제조됩니다. 따라서 순동의 L-PBF가 가능하다면 기하학적으로 최적화된 방열판과 자유형 전자코일을 제작할 수 있습니다.
그러나 L-PBF로 조밀한 순동 부품을 생산하는 것은 적외선에 대한 낮은 광 흡수율과 높은 열전도율로 인해 어렵습니다. 기존의 L-PBF 시스템에서 조밀한 구리 부품을 생산하려면 적외선 레이저의 출력을 500W 이상으로 높이거나 구리의 광흡수율이 높은 녹색 레이저를 사용해야 합니다.
적외선 레이저 출력을 높이면 후면 반사로 인해 레이저 시스템의 광학 구성 요소가 손상되고 렌즈의 열 광학 현상으로 인해 공정이 불안정해질 수 있습니다. 이 작업에서 FVM(Finite Volume Method)에 기반한 다중 물리학 중간 규모 수치 모델은 Flow-3D에서 개발되어 용융 풀 역학과 궁극적으로 부품 품질을 제어하는 물리적 현상 상호 작용을 조사합니다.
녹색 레이저 열원과 적외선 레이저 열원은 기판 위의 순수 구리 분말 베드에 단일 트랙 증착을 생성하기 위해 개별적으로 사용됩니다.
용융 풀 역학에 대한 레이저 열원의 유사하지 않은 광학 흡수 특성의 영향이 탐구됩니다. 수치 모델을 검증하기 위해 단일 트랙이 구리 분말 베드에 증착되고 시뮬레이션된 용융 풀 모양과 크기가 비교되는 실험이 수행되었습니다.
녹색 레이저는 광흡수율이 높아 전도 및 키홀 모드 용융이 가능하고 적외선 레이저는 흡수율이 낮아 키홀 모드 용융만 가능하다. 레이저 파장에 대한 용융 모드의 변화는 궁극적으로 기계적, 전기적 및 열적 특성에 영향을 미치는 열 구배 및 냉각 속도에 대한 결과를 가져옵니다.
Laser Powder Bed Fusion (L-PBF) is a Metal Additive Manufacturing (MAM) technology which offers several advantages to industries such as part design freedom, consolidation of assemblies, part customization and low tooling cost over conventional manufacturing processes. Electric coils and thermal management devices are generally manufactured from pure copper due to its high electrical and thermal conductivity properties. Therefore, if L-PBF of pure copper is feasible, geometrically optimized heat sinks and free-form electromagnetic coils can be manufactured. However, producing dense pure copper parts by L-PBF is difficult due to low optical absorptivity to infrared radiation and high thermal conductivity. To produce dense copper parts in a conventional L-PBF system either the power of the infrared laser must be increased above 500W, or a green laser should be used for which copper has a high optical absorptivity. Increasing the infrared laser power can damage the optical components of the laser systems due to back reflections and create instabilities in the process due to thermal-optical phenomenon of the lenses. In this work, a multi-physics meso-scale numerical model based on Finite Volume Method (FVM) is developed in Flow-3D to investigate the physical phenomena interaction which governs the melt pool dynamics and ultimately the part quality. A green laser heat source and an infrared laser heat source are used individually to create single track deposition on pure copper powder bed above a substrate. The effect of the dissimilar optical absorptivity property of laser heat sources on the melt pool dynamics is explored. To validate the numerical model, experiments were conducted wherein single tracks are deposited on a copper powder bed and the simulated melt pool shape and size are compared. As the green laser has a high optical absorptivity, a conduction and keyhole mode melting is possible while for the infrared laser only keyhole mode melting is possible due to low absorptivity. The variation in melting modes with respect to the laser wavelength has an outcome on thermal gradient and cooling rates which ultimately affect the mechanical, electrical, and thermal properties.
Keywords
Pure Copper, Laser Powder Bed Fusion, Finite Volume Method, multi-physics
Fig. 1 Multi-physics phenomena in the laser-material interaction zoneFig. 2 Framework for single laser track simulation model including powder bed and substrate (a)
computational domain with boundaries (b) discretization of the domain with uniform quad mesh.Fig. 3 2D melt pool contours from the numerical model compared to experiments [16] for (a) VED =
65 J/mm3
at 7 mm from the beginning of the single track (b) VED = 103 J/mm3
at 3 mm from the
beginning of the single track (c) VED = 103 J/mm3
at 7 mm from the beginning of the single track. In
the 2D contour, the non-melted region is indicated in blue, and the melted region is indicated by red and
green when the VED is 65 J/mm3
and 103 J/mm3
respectively.Fig. 4 3D temperature contour plots of during single track L-PBF process at time1.8 µs when (a) VED
= 65 J/mm3 (b) VED = 103 J/mm3 along with 2D melt pool contours at 5 mm from the laser initial
position. In the 2D contour, the non-melted region is indicated in blue, and the melted region is indicated
by red and green when the VED is 65 J/mm3
and 103 J/mm3
respectively.
References
[1] L. Jyothish Kumar, P. M. Pandey, and D. I. Wimpenny, 3D printing and additive manufacturing technologies. Springer Singapore, 2018. doi: 10.1007/978-981-13-0305-0. [2] T. DebRoy et al., “Additive manufacturing of metallic components – Process, structure and properties,” Progress in Materials Science, vol. 92, pp. 112–224, 2018, doi: 10.1016/j.pmatsci.2017.10.001. [3] C. S. Lefky, B. Zucker, D. Wright, A. R. Nassar, T. W. Simpson, and O. J. Hildreth, “Dissolvable Supports in Powder Bed Fusion-Printed Stainless Steel,” 3D Printing and Additive Manufacturing, vol. 4, no. 1, pp. 3–11, 2017, doi: 10.1089/3dp.2016.0043. [4] J. L. Bartlett and X. Li, “An overview of residual stresses in metal powder bed fusion,” Additive Manufacturing, vol. 27, no. January, pp. 131–149, 2019, doi: 10.1016/j.addma.2019.02.020. [5] I. H. Ahn, “Determination of a process window with consideration of effective layer thickness in SLM process,” International Journal of Advanced Manufacturing Technology, vol. 105, no. 10, pp. 4181–4191, 2019, doi: 10.1007/s00170-019-04402-w.
[6] R. McCann et al., “In-situ sensing, process monitoring and machine control in Laser Powder Bed Fusion: A review,” Additive Manufacturing, vol. 45, no. May, 2021, doi: 10.1016/j.addma.2021.102058. [7] M. Bayat et al., “Keyhole-induced porosities in Laser-based Powder Bed Fusion (L-PBF) of Ti6Al4V: High-fidelity modelling and experimental validation,” Additive Manufacturing, vol. 30, no. August, p. 100835, 2019, doi: 10.1016/j.addma.2019.100835. [8] M. Bayat, S. Mohanty, and J. H. Hattel, “Multiphysics modelling of lack-of-fusion voids formation and evolution in IN718 made by multi-track/multi-layer L-PBF,” International Journal of Heat and Mass Transfer, vol. 139, pp. 95–114, 2019, doi: 10.1016/j.ijheatmasstransfer.2019.05.003. [9] S. D. Jadhav, L. R. Goossens, Y. Kinds, B. van Hooreweder, and K. Vanmeensel, “Laserbased powder bed fusion additive manufacturing of pure copper,” Additive Manufacturing, vol. 42, no. March, 2021, doi: 10.1016/j.addma.2021.101990. [10] S. D. Jadhav, S. Dadbakhsh, L. Goossens, J. P. Kruth, J. van Humbeeck, and K. Vanmeensel, “Influence of selective laser melting process parameters on texture evolution in pure copper,” Journal of Materials Processing Technology, vol. 270, no. January, pp. 47–58, 2019, doi: 10.1016/j.jmatprotec.2019.02.022. [11] H. Siva Prasad, F. Brueckner, J. Volpp, and A. F. H. Kaplan, “Laser metal deposition of copper on diverse metals using green laser sources,” International Journal of Advanced Manufacturing Technology, vol. 107, no. 3–4, pp. 1559–1568, 2020, doi: 10.1007/s00170- 020-05117-z. [12] L. R. Goossens, Y. Kinds, J. P. Kruth, and B. van Hooreweder, “On the influence of thermal lensing during selective laser melting,” Solid Freeform Fabrication 2018: Proceedings of the 29th Annual International Solid Freeform Fabrication Symposium – An Additive Manufacturing Conference, SFF 2018, no. December, pp. 2267–2274, 2020. [13] M. Bayat, V. K. Nadimpalli, D. B. Pedersen, and J. H. Hattel, “A fundamental investigation of thermo-capillarity in laser powder bed fusion of metals and alloys,” International Journal of Heat and Mass Transfer, vol. 166, p. 120766, 2021, doi: 10.1016/j.ijheatmasstransfer.2020.120766. [14] H. Chen, Q. Wei, Y. Zhang, F. Chen, Y. Shi, and W. Yan, “Powder-spreading mechanisms in powder-bed-based additive manufacturing: Experiments and computational modeling,” Acta Materialia, vol. 179, pp. 158–171, 2019, doi: 10.1016/j.actamat.2019.08.030. [15] S. K. Nayak, S. K. Mishra, C. P. Paul, A. N. Jinoop, and K. S. Bindra, “Effect of energy density on laser powder bed fusion built single tracks and thin wall structures with 100 µm preplaced powder layer thickness,” Optics and Laser Technology, vol. 125, May 2020, doi: 10.1016/j.optlastec.2019.106016. [16] G. Nordet et al., “Absorptivity measurements during laser powder bed fusion of pure copper with a 1 kW cw green laser,” Optics & Laser Technology, vol. 147, no. April 2021, p. 107612, 2022, doi: 10.1016/j.optlastec.2021.107612. [17] M. Hummel, C. Schöler, A. Häusler, A. Gillner, and R. Poprawe, “New approaches on laser micro welding of copper by using a laser beam source with a wavelength of 450 nm,” Journal of Advanced Joining Processes, vol. 1, no. February, p. 100012, 2020, doi: 10.1016/j.jajp.2020.100012. [18] M. Hummel, M. Külkens, C. Schöler, W. Schulz, and A. Gillner, “In situ X-ray tomography investigations on laser welding of copper with 515 and 1030 nm laser beam sources,” Journal of Manufacturing Processes, vol. 67, no. April, pp. 170–176, 2021, doi: 10.1016/j.jmapro.2021.04.063. [19] L. Gargalis et al., “Determining processing behaviour of pure Cu in laser powder bed fusion using direct micro-calorimetry,” Journal of Materials Processing Technology, vol. 294, no. March, p. 117130, 2021, doi: 10.1016/j.jmatprotec.2021.117130. [20] A. Mondal, D. Agrawal, and A. Upadhyaya, “Microwave heating of pure copper powder with varying particle size and porosity,” Journal of Microwave Power and Electromagnetic Energy, vol. 43, no. 1, pp. 4315–43110, 2009, doi: 10.1080/08327823.2008.11688599.
316-L 스테인리스강의 레이저 분말 베드 융합 중 콜드 스패터 형성의 충실도 높은 수치 모델링
M. BAYAT1,* , AND J. H. HATTEL1
Corresponding author 1 Technical University of Denmark (DTU), Building 425, Kgs. 2800 Lyngby, Denmark
ABSTRACT
Spatter and denudation are two very well-known phenomena occurring mainly during the laser powder bed fusion process and are defined as ejection and displacement of powder particles, respectively. The main driver of this phenomenon is the formation of a vapor plume jet that is caused by the vaporization of the melt pool which is subjected to the laser beam. In this work, a 3-dimensional transient turbulent computational fluid dynamics model coupled with a discrete element model is developed in the finite volume-based commercial software package Flow-3D AM to simulate the spatter phenomenon. The numerical results show that a localized low-pressure zone forms at the bottom side of the plume jet and this leads to a pseudo-Bernoulli effect that drags nearby powder particles into the area of influence of the vapor plume jet. As a result, the vapor plume acts like a momentum sink and therefore all nearby particles point are dragged towards this region. Furthermore, it is noted that due to the jet’s attenuation, powder particles start diverging from the central core region of the vapor plume as they move vertically upwards. It is moreover observed that only particles which are in the very central core region of the plume jet get sufficiently accelerated to depart the computational domain, while the rest of the dragged particles, especially those which undergo an early divergence from the jet axis, get stalled pretty fast as they come in contact with the resting fluid. In the last part of the work, two simulations with two different scanning speeds are carried out, where it is clearly observed that the angle between the departing powder particles and the vertical axis of the plume jet increases with increasing scanning speed.
스패터와 denudation은 주로 레이저 분말 베드 융합 과정에서 발생하는 매우 잘 알려진 두 가지 현상으로 각각 분말 입자의 배출 및 변위로 정의됩니다.
이 현상의 주요 동인은 레이저 빔을 받는 용융 풀의 기화로 인해 발생하는 증기 기둥 제트의 형성입니다. 이 작업에서 이산 요소 모델과 결합된 3차원 과도 난류 전산 유체 역학 모델은 스패터 현상을 시뮬레이션하기 위해 유한 체적 기반 상용 소프트웨어 패키지 Flow-3D AM에서 개발되었습니다.
수치적 결과는 플룸 제트의 바닥면에 국부적인 저압 영역이 형성되고, 이는 근처의 분말 입자를 증기 플룸 제트의 영향 영역으로 끌어들이는 의사-베르누이 효과로 이어진다는 것을 보여줍니다.
결과적으로 증기 기둥은 운동량 흡수원처럼 작용하므로 근처의 모든 입자 지점이 이 영역으로 끌립니다. 또한 제트의 감쇠로 인해 분말 입자가 수직으로 위쪽으로 이동할 때 증기 기둥의 중심 코어 영역에서 발산하기 시작합니다.
더욱이 플룸 제트의 가장 중심 코어 영역에 있는 입자만 계산 영역을 벗어날 만큼 충분히 가속되는 반면, 드래그된 나머지 입자, 특히 제트 축에서 초기 발산을 겪는 입자는 정체되는 것으로 관찰됩니다. 그들은 휴식 유체와 접촉하기 때문에 꽤 빠릅니다.
작업의 마지막 부분에서 두 가지 다른 스캔 속도를 가진 두 가지 시뮬레이션이 수행되었으며, 여기서 출발하는 분말 입자와 연기 제트의 수직 축 사이의 각도가 스캔 속도가 증가함에 따라 증가하는 것이 명확하게 관찰되었습니다.
Fig 1. Two different views of the computational domain for the fluid domain. The vapor plume is
simulated by a moving momentum source with a prescribed temperature of 3000 K.Fig 2. (a) and (b) are two snapshots taken at an x-y plane parallel to the powder layer plane before and
0.008 seconds after the start of the scanning process. (c) Shows a magnified view of (b) where detailed
powder particles’ movement along with their velocity magnitude and directions are shown.Fig 3. Front view of the ejected powder particles due to the plume movement. Powder particles are
colored by their respective temperature while trajectory colors show their magnitude at 0.007 seconds.
References
[1] T. DebRoy et al., “Additive manufacturing of metallic components – Process, structure and properties,” Prog. Mater. Sci., vol. 92, pp. 112–224, 2018, doi: 10.1016/j.pmatsci.2017.10.001. [2] M. Markl and C. Körner, “Multiscale Modeling of Powder Bed–Based Additive Manufacturing,” Annu. Rev. Mater. Res., vol. 46, no. 1, pp. 93–123, 2016, doi: 10.1146/annurev-matsci-070115-032158. [3] A. Zinoviev, O. Zinovieva, V. Ploshikhin, V. Romanova, and R. Balokhonov, “Evolution of grain structure during laser additive manufacturing. Simulation by a cellular automata method,” Mater. Des., vol. 106, pp. 321–329, 2016, doi: 10.1016/j.matdes.2016.05.125. [4] Y. Zhang and J. Zhang, “Modeling of solidification microstructure evolution in laser powder bed fusion fabricated 316L stainless steel using combined computational fluid dynamics and cellular automata,” Addit. Manuf., vol. 28, no. July 2018, pp. 750–765, 2019, doi: 10.1016/j.addma.2019.06.024. [5] A. A. Martin et al., “Ultrafast dynamics of laser-metal interactions in additive manufacturing alloys captured by in situ X-ray imaging,” Mater. Today Adv., vol. 1, p. 100002, 2019, doi: 10.1016/j.mtadv.2019.01.001. [6] Y. C. Wu et al., “Numerical modeling of melt-pool behavior in selective laser melting with random powder distribution and experimental validation,” J. Mater. Process. Technol., vol. 254, no. July 2017, pp. 72–78, 2018, doi: 10.1016/j.jmatprotec.2017.11.032. [7] W. Gao, S. Zhao, Y. Wang, Z. Zhang, F. Liu, and X. Lin, “Numerical simulation of thermal field and Fe-based coating doped Ti,” Int. J. Heat Mass Transf., vol. 92, pp. 83– 90, 2016, doi: 10.1016/j.ijheatmasstransfer.2015.08.082. [8] A. Charles, M. Bayat, A. Elkaseer, L. Thijs, J. H. Hattel, and S. Scholz, “Elucidation of dross formation in laser powder bed fusion at down-facing surfaces: Phenomenonoriented multiphysics simulation and experimental validation,” Addit. Manuf., vol. 50, 2022, doi: 10.1016/j.addma.2021.102551. [9] C. Meier, R. W. Penny, Y. Zou, J. S. Gibbs, and A. J. Hart, “Thermophysical phenomena in metal additive manufacturing by selective laser melting: Fundamentals, modeling, simulation and experimentation,” arXiv, 2017, doi: 10.1615/annualrevheattransfer.2018019042. [10] W. King, A. T. Anderson, R. M. Ferencz, N. E. Hodge, C. Kamath, and S. A. Khairallah, “Overview of modelling and simulation of metal powder bed fusion process at Lawrence Livermore National Laboratory,” Mater. Sci. Technol. (United Kingdom), vol. 31, no. 8, pp. 957–968, 2015, doi: 10.1179/1743284714Y.0000000728.
•The limitation of increasing the rotational speed in decreasing powder size was clarified.
•Cooling and disturbance effects varied with the gas flowing rate.
•Inclined angle of the residual electrode end face affected powder formation.
•Additional cooling gas flowing could be applied to control powder size.
Abstract
The plasma rotating electrode process (PREP) is rapidly becoming an important powder fabrication method in additive manufacturing. However, the low production rate of fine PREP powder limits the development of PREP. Herein, we investigated different factors affecting powder formation during PREP by combining experimental methods and numerical simulations. The limitation of increasing the rotation electrode speed in decreasing powder size is attributed to the increased probability of adjacent droplets recombining and the decreased tendency of granulation. The effects of additional Ar/He gas flowing on the rotational electrode on powder formation is determined through the cooling effect, the disturbance effect, and the inclined effect of the residual electrode end face simultaneously. A smaller-sized powder was obtained in the He atmosphere owing to the larger inclined angle of the residual electrode end face compared to the Ar atmosphere. Our research highlights the route for the fabrication of smaller-sized powders using PREP.
플라즈마 회전 전극 공정(PREP)은 적층 제조 에서 중요한 분말 제조 방법으로 빠르게 자리잡고 있습니다. 그러나 미세한 PREP 분말의 낮은 생산율은 PREP의 개발을 제한합니다. 여기에서 우리는 실험 방법과 수치 시뮬레이션을 결합하여 PREP 동안 분말 형성에 영향을 미치는 다양한 요인을 조사했습니다. 분말 크기 감소에서 회전 전극 속도 증가의 한계는 인접한 액적 재결합 확률 증가 및 과립화 경향 감소에 기인합니다.. 회전 전극에 흐르는 추가 Ar/He 가스가 분말 형성에 미치는 영향은 냉각 효과, 외란 효과 및 잔류 전극 단면의 경사 효과를 통해 동시에 결정됩니다. He 분위기에서는 Ar 분위기에 비해 잔류 전극 단면의 경사각이 크기 때문에 더 작은 크기의 분말이 얻어졌다. 우리의 연구는 PREP를 사용하여 더 작은 크기의 분말을 제조하는 경로를 강조합니다.
Keywords
Plasma rotating electrode process
Ti-6Al-4 V alloy, Rotating speed, Numerical simulation, Gas flowing, Powder size
Introduction
With the development of additive manufacturing, there has been a significant increase in high-quality powder production demand [1,2]. The initial powder characteristics are closely related to the uniform powder spreading [3,4], packing density [5], and layer thickness observed during additive manufacturing [6], thus determining the mechanical properties of the additive manufactured parts [7,8]. Gas atomization (GA) [9–11], centrifugal atomization (CA) [12–15], and the plasma rotating electrode process (PREP) are three important powder fabrication methods.
Currently, GA is the dominant powder fabrication method used in additive manufacturing [16] for the fabrication of a wide range of alloys [11]. GA produces powders by impinging a liquid metal stream to droplets through a high-speed gas flow of nitrogen, argon, or helium. With relatively low energy consumption and a high fraction of fine powders, GA has become the most popular powder manufacturing technology for AM.
The entrapped gas pores are generally formed in the powder after solidification during GA, in which the molten metal is impacted by a high-speed atomization gas jet. In addition, satellites are formed in GA powder when fine particles adhere to partially molten particles.
The gas pores of GA powder result in porosity generation in the additive manufactured parts, which in turn deteriorates its mechanical properties because pores can become crack initiation sites [17]. In CA, a molten metal stream is poured directly onto an atomizer disc spinning at a high rotational speed. A thin film is formed on the surface of the disc, which breaks into small droplets due to the centrifugal force. Metal powder is obtained when these droplets solidify.
Compared with GA powder, CA powder exhibits higher sphericity, lower impurity content, fewer satellites, and narrower particle size distribution [12]. However, very high speed is required to obtain fine powder by CA. In PREP, the molten metal, melted using the plasma arc, is ejected from the rotating rod through centrifugal force. Compared with GA powder, PREP-produced powders also have higher sphericity and fewer pores and satellites [18].
For instance, PREP-fabricated Ti6Al-4 V alloy powder with a powder size below 150 μm exhibits lower porosity than gas-atomized powder [19], which decreases the porosity of additive manufactured parts. Furthermore, the process window during electron beam melting was broadened using PREP powder compared to GA powder in Inconel 718 alloy [20] owing to the higher sphericity of the PREP powder.
In summary, PREP powder exhibits many advantages and is highly recommended for powder-based additive manufacturing and direct energy deposition-type additive manufacturing. However, the low production rate of fine PREP powder limits the widespread application of PREP powder in additive manufacturing.
Although increasing the rotating speed is an effective method to decrease the powder size [21,22], the reduction in powder size becomes smaller with the increased rotating speed [23]. The occurrence of limiting effects has not been fully clarified yet.
Moreover, the powder size can be decreased by increasing the rotating electrode diameter [24]. However, these methods are quite demanding for the PREP equipment. For instance, it is costly to revise the PREP equipment to meet the demand of further increasing the rotating speed or electrode diameter.
Accordingly, more feasible methods should be developed to further decrease the PREP powder size. Another factor that influences powder formation is the melting rate [25]. It has been reported that increasing the melting rate decreases the powder size of Inconel 718 alloy [26].
In contrast, the powder size of SUS316 alloy was decreased by decreasing the plasma current within certain ranges. This was ascribed to the formation of larger-sized droplets from fluid strips with increased thickness and spatial density at higher plasma currents [27]. The powder size of NiTi alloy also decreases at lower melting rates [28]. Consequently, altering the melting rate, varied with the plasma current, is expected to regulate the PREP powder size.
Furthermore, gas flowing has a significant influence on powder formation [27,29–31]. On one hand, the disturbance effect of gas flowing promotes fluid granulation, which in turn contributes to the formation of smaller-sized powder [27]. On the other hand, the cooling effect of gas flowing facilitates the formation of large-sized powder due to increased viscosity and surface tension. However, there is a lack of systematic research on the effect of different gas flowing on powder formation during PREP.
Herein, the authors systematically studied the effects of rotating speed, electrode diameter, plasma current, and gas flowing on the formation of Ti-6Al-4 V alloy powder during PREP as additive manufactured Ti-6Al-4 V alloy exhibits great application potential [32]. Numerical simulations were conducted to explain why increasing the rotating speed is not effective in decreasing powder size when the rotation speed reaches a certain level. In addition, the different factors incited by the Ar/He gas flowing on powder formation were clarified.
Fig. 1. Schematic figure showing the PREP with additional gas flowing on the end face of electrode.
References
[1] W. Ding, G. Chen, M. Qin, Y. He, X. Qu, Low-cost Ti powders for additive manufacturing treated by fluidized bed, Powder Technol. 350 (2019) 117–122, https://doi.org/ 10.1016/j.powtec.2019.03.042. [2] W.S.W. Harun, M.S.I.N. Kamariah, N. Muhamad, S.A.C. Ghani, F. Ahmad, Z. Mohamed, A review of powder additive manufacturing processes for metallic biomaterials, Powder Technol. 327 (2018) 128–151, https://doi.org/10.1016/j.powtec.2017.12. 058. [3] M. Ahmed, M. Pasha, W. Nan, M. Ghadiri, A simple method for assessing powder spreadability for additive manufacturing, Powder Technol. 367 (2020) 671–679, https://doi.org/10.1016/j.powtec.2020.04.033. [4] W. Nan, M. Pasha, M. Ghadiri, Numerical simulation of particle flow and segregation during roller spreading process in additive manufacturing, Powder Technol. 364 (2020) 811–821, https://doi.org/10.1016/j.powtec.2019.12.023. [5] A. Averardi, C. Cola, S.E. Zeltmann, N. Gupta, Effect of particle size distribution on the packing of powder beds : a critical discussion relevant to additive manufacturing, Mater. Today Commun. 24 (2020) 100964, https://doi.org/10.1016/j.mtcomm. 2020.100964. [6] K. Riener, N. Albrecht, S. Ziegelmeier, R. Ramakrishnan, L. Haferkamp, A.B. Spierings, G.J. Leichtfried, Influence of particle size distribution and morphology on the properties of the powder feedstock as well as of AlSi10Mg parts produced by laser powder bed fusion (LPBF), Addit. Manuf. 34 (2020) 101286, https://doi.org/10.1016/j. addma.2020.101286. [7] W.S.W. Harun, N.S. Manam, M.S.I.N. Kamariah, S. Sharif, A.H. Zulkifly, I. Ahmad, H. Miura, A review of powdered additive manufacturing techniques for Ti-6Al-4V biomedical applications, Powder Technol. 331 (2018) 74–97, https://doi.org/10.1016/j. powtec.2018.03.010. [8] A.T. Sutton, C.S. Kriewall, M.C. Leu, J.W. Newkirk, Powder characterisation techniques and effects of powder characteristics on part properties in powder-bed fusion processes, Virtual Phys. Prototyp. 12 (2017) (2017) 3–29, https://doi.org/10. 1080/17452759.2016.1250605. [9] G. Chen, Q. Zhou, S.Y. Zhao, J.O. Yin, P. Tan, Z.F. Li, Y. Ge, J. Wang, H.P. Tang, A pore morphological study of gas-atomized Ti-6Al-4V powders by scanning electron microscopy and synchrotron X-ray computed tomography, Powder Technol. 330 (2018) 425–430, https://doi.org/10.1016/j.powtec.2018.02.053. [10] Y. Feng, T. Qiu, Preparation, characterization and microwave absorbing properties of FeNi alloy prepared by gas atomization method, J. Alloys Compd. 513 (2012) 455–459, https://doi.org/10.1016/j.jallcom.2011.10.079.
[11] I.E. Anderson, R.L. Terpstra, Progress toward gas atomization processing with increased uniformity and control, Mater. Sci. Eng. A 326 (2002) 101–109, https:// doi.org/10.1016/S0921-5093(01)01427-7. [12] P. Phairote, T. Plookphol, S. Wisutmethangoon, Design and development of a centrifugal atomizer for producing zinc metal powder, Int. J. Appl. Phys. Math. 2 (2012) 77–82, https://doi.org/10.7763/IJAPM.2012.V2.58. [13] L. Tian, I. Anderson, T. Riedemann, A. Russell, Production of fine calcium powders by centrifugal atomization with rotating quench bath, Powder Technol. 308 (2017) 84–93, https://doi.org/10.1016/j.powtec.2016.12.011. [14] M. Eslamian, J. Rak, N. Ashgriz, Preparation of aluminum/silicon carbide metal matrix composites using centrifugal atomization, Powder Technol. 184 (2008) 11–20, https://doi.org/10.1016/j.powtec.2007.07.045. [15] T. Plookphol, S. Wisutmethangoon, S. Gonsrang, Influence of process parameters on SAC305 lead-free solder powder produced by centrifugal atomization, Powder Technol. 214 (2011) 506–512, https://doi.org/10.1016/j.powtec.2011.09.015. [16] M.Z. Gao, B. Ludwig, T.A. Palmer, Impact of atomization gas on characteristics of austenitic stainless steel powder feedstocks for additive manufacturing, Powder Technol. 383 (2021) 30–42, https://doi.org/10.1016/j.powtec.2020.12.005. [17] X. Shui, K. Yamanaka, M. Mori, Y. Nagata, A. Chiba, Effects of post-processing on cyclic fatigue response of a titanium alloy additively manufactured by electron beam melting, Mater. Sci. Eng. A 680 (2017) 239–248, https://doi.org/10.1016/j.msea. 2016.10.059. [18] C. Wang, X.H. Zhao, Y.C. Ma, Q.X. Wang, Y.J. Lai, S.J. Liang, Study of the spherical HoCu powders prepared by supreme-speed plasma rotating electrode process, Powder Metallurgy Technology 38 (3) (2020) 227–233, https://doi.org/10.19591/ j.cnki.cn11-1974/tf.2020.03.011 (in Chinese). [19] G. Chen, S.Y. Zhao, P. Tan, J. Wang, C.S. Xiang, H.P. Tang, A comparative study of Ti6Al-4V powders for additive manufacturing by gas atomization, plasma rotating electrode process and plasma atomization, Powder Technol. 333 (2018) 38–46, https://doi.org/10.1016/j.powtec.2018.04.013. [20] Y. Zhao, K. Aoyagi, Y. Daino, K. Yamanaka, A. Chiba, Significance of powder feedstock characteristics in defect suppression of additively manufactured Inconel 718, Addit. Manuf. 34 (2020) 101277, https://doi.org/10.1016/j.addma.2020.101277. [21] Y. Nie, J. Tang, B. Yang, Q. Lei, S. Yu, Y. Li, Comparison in characteristic and atomization behavior of metallic powders produced by plasma rotating electrode process, Adv. Powder Technol. 31 (2020) 2152–2160, https://doi.org/10.1016/j.apt.2020.03. 006. [22] Y. Cui, Y. Zhao, H. Numata, H. Bian, K. Wako, K. Yamanaka, K. Aoyagi, C. Zhang, A. Chiba, Effects of plasma rotating electrode process parameters on the particle size distribution and microstructure of Ti-6Al-4 V alloy powder, Powder Technol 376 (2020) 363–372, https://doi.org/10.1016/j.powtec.2020.08.027. [23] J. Tang, Y. Nie, Q. Lei, Y. Li, Characteristics and atomization behavior of Ti-6Al-4V powder produced by plasma rotating electrode process Adv, Powder Technol. 10 (2019) 2330–2337, https://doi.org/10.1016/j.apt.2019.07.015. [24] M. Zdujić, D. Uskoković, Production of atomized metal and alloy powders by the rotating electrode process, Sov. Powder Metall. Met. Ceram. 29 (1990) 673–683, https://doi.org/10.1007/BF00795571. [25] L. Zhang, Y. Zhao, Particle size distribution of tin powder produced by centrifugal atomisation using rotating cups, Powder Technol. 318 (2017) 62–67, https://doi. org/10.1016/j.powtec.2017.05.038. [26] Y. Liu, S. Liang, Z. Han, J. Song, Q. Wang, A novel model of calculating particle sizes in plasma rotating electrode process for superalloys, Powder Technol. 336 (2018) 406–414, https://doi.org/10.1016/j.powtec.2018.06.002. [27] Y. Zhao, Y. Cui, H. Numata, H. Bian, K. Wako, K. Yamanaka, Centrifugal granulation behavior in metallic powder fabrication by plasma rotating electrode process, Sci. Rep. (2020) 1–15, https://doi.org/10.1038/s41598-020-75503-w. [28] T. Hsu, C. Wei, L. Wu, Y. Li, A. Chiba, M. Tsai, Nitinol powders generate from plasma rotation electrode process provide clean powder for biomedical devices used with suitable size, spheroid surface and pure composition, Sci. Rep. 8 (2018) 1–8, https://doi.org/10.1038/s41598-018-32101-1. [29] M. Wei, S. Chen, M. Sun, J. Liang, C. Liu, M. Wang, Atomization simulation and preparation of 24CrNiMoY alloy steel powder using VIGA technology at high gas pressure, Powder Technol. 367 (2020) 724–739, https://doi.org/10.1016/j.powtec. 2020.04.030. [30] Y. Tan, X. Zhu, X.Y. He, B. Ding, H. Wang, Q. Liao, H. Li, Granulation characteristics of molten blast furnace slag by hybrid centrifugal-air blast technique, Powder Technol. 323 (2018) 176–185, https://doi.org/10.1016/j.powtec.2017.09.040. [31] P. Xu, D.H. Liu, J. Hu, G.Y. Lin, Synthesis of Ni-Ti composite powder by radio frequency plasma spheroidization process, Nonferrous Metals Science and Engineering 39 (1) (2020) 67–71 , (in Chinese) 10.13264/j.cnki.ysjskx.2020.01.011. [32] H. Mehboob, F. Tarlochan, A. Mehboob, S.H. Chang, S. Ramesh, W.S.W. Harun, K. Kadirgama, A novel design, analysis and 3D printing of Ti-6Al-4V alloy bioinspired porous femoral stem, J. Mater. Sci. Mater. Med. 31 (2020) 78, https://doi. org/10.1007/s10856-020-06420-7. [33] FLOW-3D® Version 11.2 [Computer software]. , Flow Science, Inc., Santa Fe, NM, 2017https://www.flow3d.com. [34] M. Boivineau, C. Cagran, D. Doytier, V. Eyraud, M.H. Nadal, B. Wilthan, G. Pottlacher, Thermophysical properties of solid and liquid Ti-6Al-4V (TA6V) alloy, Int. J. Thermophys. 27 (2006) 507–529, https://doi.org/10.1007/PL00021868. [35] J. Liu, Q. Qin, Q. Yu, The effect of size distribution of slag particles obtained in dry granulation on blast furnace slag cement strength, Powder Technol. 362 (2020) 32–36, https://doi.org/10.1016/j.powtec.2019.11.115. [36] M. Tanaka, S. Tashiro, A study of thermal pinch effect of welding arcs, J. Japan Weld. Soc. 25 (2007) 336–342, https://doi.org/10.2207/qjjws.25.336 (in Japanese). [37] T. Kamiya, A. Kayano, Disintegration of viscous fluid in the ligament state purged from a rotating disk, J. Chem. Eng. JAPAN. 4 (1971) 364–369, https://doi.org/10. 1252/jcej.4.364. [38] T. Kamiya, An analysis of the ligament-type disintegration of thin liquid film at the edge of a rotating disk, J. Chem. Eng. Japan. 5 (1972) 391–396, https://doi.org/10. 1252/jcej.5.391. [39] J. Burns, C. Ramshaw, R. Jachuck, Measurement of liquid film thickness and the determination of spin-up radius on a rotating disc using an electrical resistance technique, Chem. Eng. Sci. 58 (2003) 2245–2253, https://doi.org/10.1016/S0009-2509 (03)00091-5. [40] J. Rauscher, R. Kelly, J. Cole, An asymptotic solution for the laminar flow of a thin film on a rotating disk, J. Appl. Mech. Trans. ASME 40 (1973) 43–47, https://doi.org/10. 1115/1.3422970
2020년 12월 22일 접수, 2021년 5월 1일 수정, 2021년 7월 15일 수락, 2021년 7월 21일 온라인 사용 가능, 기록 버전 2021년 8월 17일 .
Abstract
이 문서는 재료 압출 적층 제조 에서 여러 레이어를 인쇄하는 동안 증착 흐름의 전산 유체 역학 시뮬레이션 을 제공합니다 . 개발된 모델은 증착된 레이어의 형태를 예측하고 점소성 재료 를 인쇄하는 동안 레이어 변형을 캡처합니다 . 물리학은 일반화된 뉴턴 유체 로 공식화된 Bingham 구성 모델의 연속성 및 운동량 방정식에 의해 제어됩니다. . 증착된 층의 단면 모양이 예측되고 재료의 다양한 구성 매개변수에 대해 층의 변형이 연구됩니다. 층의 변형은 인쇄물의 정수압과 압출시 압출압력으로 인한 것임을 알 수 있다. 시뮬레이션에 따르면 항복 응력이 높을수록 변형이 적은 인쇄물이 생성되는 반면 플라스틱 점도 가 높을수록 증착된 레이어에서변형이 커 집니다 . 또한, 인쇄 속도, 압출 속도 의 영향, 층 높이 및 인쇄된 층의 변형에 대한 노즐 직경을 조사합니다. 마지막으로, 이 모델은 후속 인쇄된 레이어의 정수압 및 압출 압력을 지원하기 위해 증착 후 점소성 재료가 요구하는 항복 응력의 필요한 증가에 대한 보수적인 추정치를 제공합니다.
This paper presents computational fluid dynamics simulations of the deposition flow during printing of multiple layers in material extrusionadditive manufacturing. The developed model predicts the morphology of the deposited layers and captures the layer deformations during the printing of viscoplastic materials. The physics is governed by the continuity and momentum equations with the Bingham constitutive model, formulated as a generalized Newtonian fluid. The cross-sectional shapes of the deposited layers are predicted, and the deformation of layers is studied for different constitutive parameters of the material. It is shown that the deformation of layers is due to the hydrostatic pressure of the printed material, as well as the extrusion pressure during the extrusion. The simulations show that a higher yield stress results in prints with less deformations, while a higher plastic viscosity leads to larger deformations in the deposited layers. Moreover, the influence of the printing speed, extrusion speed, layer height, and nozzle diameter on the deformation of the printed layers is investigated. Finally, the model provides a conservative estimate of the required increase in yield stress that a viscoplastic material demands after deposition in order to support the hydrostatic and extrusion pressure of the subsequently printed layers.
Fig. 1. Model geometry with the computational domain, extrusion nozzle,
toolpath, and boundary conditions. The model is presented while printing the
fifth layer.
키워드
점성 플라스틱 재료, 재료 압출 적층 제조(MEX-AM), 다층 증착, 전산유체역학(CFD), 변형 제어 Viscoplastic Materials, Material Extrusion Additive Manufacturing (MEX-AM), Multiple-Layers Deposition, Computational Fluid Dynamics (CFD), Deformation Control
Introduction
Three-dimensional printing of viscoplastic materials has grown in popularity over the recent years, due to the success of Material Extrusion Additive Manufacturing (MEX-AM) [1]. Viscoplastic materials, such as ceramic pastes [2,3], hydrogels [4], thermosets [5], and concrete [6], behave like solids when the applied load is below their yield stress, and like a fluid when the applied load exceeds their yield stress [7]. Viscoplastic materials are typically used in MEX-AM techniques such as Robocasting [8], and 3D concrete printing [9,10]. The differences between these technologies lie in the processing of the material before the extrusion and in the printing scale (from microscale to big area additive manufacturing). In these extrusion-based technologies, the structure is fabricated in a layer-by-layer approach onto a solid surface/support [11, 12]. During the process, the material is typically deposited on top of the previously printed layers that may be already solidified (wet-on-dry printing) or still deformable (wet-on-wet printing) [1]. In wet-on-wet printing, control over the deformation of layers is important for the stability and geometrical accuracy of the prints. If the material is too liquid after the deposition, it cannot support the pressure of the subsequently deposited layers. On the other hand, the material flowability is a necessity during extrusion through the nozzle. Several experimental studies have been performed to analyze the physics of the extrusion and deposition of viscoplastic materials, as reviewed in Refs. [13–16]. The experimental measurements can be supplemented with Computational Fluid Dynamics (CFD) simulations to gain a more complete picture of MEX-AM. A review of the CFD studies within the material processing and deposition in 3D concrete printing was presented by Roussel et al. [17]. Wolfs et al. [18] predicted numerically the failure-deformation of a cylindrical structure due to the self-weight by calculating the stiffness and strength of the individual layers. It was found that the deformations can take place in all layers, however the most critical deformation occurs in the bottom layer. Comminal et al. [19,20] presented three-dimensional simulations of the material deposition in MEX-AM, where the fluid was approximated as Newtonian. Subsequently, the model was experimentally validated in Ref. [21] for polymer-based MEX-AM, and extended to simulate the deposition of multiple layers in Ref. [22], where the previously printed material was assumed solid. Xia et al. [23] simulated the influence of the viscoelastic effects on the shape of deposited layers in MEX-AM. A numerical model for simulating the deposition of a viscoplastic material was recently presented and experimentally validated in Refs. [24] and [25]. These studies focused on predicting the cross-sectional shape of a single printed layer for different processing conditions (relative printing speed, and layer height). Despite these research efforts, a limited number of studies have focused on investigating the material deformations in wet-on-wet printing when multiple layers are deposited on top of each other. This paper presents CFD simulations of the extrusion-deposition flow of a viscoplastic material for several subsequent layers (viz. three- and five-layers). The material is continuously printed one layer over another on a fixed solid surface. The rheology of the viscoplastic material is approximated by the Bingham constitutive equation that is formulated using the Generalized Newtonian Fluid (GNF) model. The CFD model is used to predict the cross-sectional shapes of the layers and their deformations while printing the next layers on top. Moreover, the simulations are used to quantify the extrusion pressure applied by the deposited material on the substrate, and the previously printed layers. Numerically, it is investigated how the process parameters (i.e., the extrusion speed, printing speed, nozzle diameter, and layer height) and the material rheology affect the deformations of the deposited layers. Section 2 describes the methodology of the study. Section 3 presents and discusses the results. The study is summarized and concluded in Section 4.
References
[1] R.A. Buswell, W.R. Leal De Silva, S.Z. Jones, J. Dirrenberger, 3D printing using concrete extrusion: a roadmap for research, Cem. Concr. Res. 112 (2018) 37–49. [2] Z. Chen, Z. Li, J. Li, C. Liu, C. Lao, Y. Fu, C. Liu, Y. Li, P. Wang, Y. He, 3D printing of ceramics: a review, J. Eur. Ceram. Soc. 39 (4) (2019) 661–687. [3] A. Bellini, L. Shor, S.I. Guceri, New developments in fused deposition modeling of ceramics, Rapid Prototyp. J. 11 (4) (2005) 214–220. [4] S. Aktas, D.M. Kalyon, B.M. Marín-Santib´ anez, ˜ J. P´erez-Gonzalez, ´ Shear viscosity and wall slip behavior of a viscoplastic hydrogel, J. Rheol. 58 (2) (2014) 513–535. [5] J. Lindahl, A. Hassen, S. Romberg, B. Hedger, P. Hedger Jr., M. Walch, T. Deluca, W. Morrison, P. Kim, A. Roschli, D. Nuttall, Large-scale Additive Manufacturing with Reactive Polymers, Oak Ridge National Lab.(ORNL), Oak Ridge, TN (United States), 2018. [6] V.N. Nerella, V. Mechtcherine, Studying the printability of fresh concrete for formwork-free Concrete onsite 3D Printing Technology (CONPrint3D), 3D Concr. Print. Technol. (2019) 333–347. [7] C. Tiu, J. Guo, P.H.T. Uhlherr, Yielding behaviour of viscoplastic materials, J. Ind. Eng. Chem. 12 (5) (2006) 653–662. [8] B. Dietemann, F. Bosna, M. Lorenz, N. Travitzky, H. Kruggel-Emden, T. Kraft, C. Bierwisch, Modeling robocasting with smoothed particle hydrodynamics: printing gapspanning filaments, Addit. Manuf. 36 (2020), 101488. [9] B. Khoshnevis, R. Russell, H. Kwon, S. Bukkapatnam, Contour crafting – a layered fabrication, Spec. Issue IEEE Robot. Autom. Mag. 8 (3) (2001) 33–42. [10] D. Asprone, F. Auricchio, C. Menna, V. Mercuri, 3D printing of reinforced concrete elements: technology and design approach, Constr. Build. Mater. 165 (2018) 218–231. [11] J. Jiang, Y. Ma, Path planning strategies to optimize accuracy, quality, build time and material use in additive manufacturing: a review, Micromachines 11 (7) (2020) 633. [12] J. Jiang, A novel fabrication strategy for additive manufacturing processes, J. Clean. Prod. 272 (2020), 122916. [13] F. Bos, R. Wolfs, Z. Ahmed, T. Salet, Additive manufacturing of concrete in construction: potentials and challenges, Virtual Phys. Prototyp. 11 (3) (2016) 209–225. [14] P. Wu, J. Wang, X. Wang, A critical review of the use of 3-D printing in the construction industry, Autom. Constr. 68 (2016) 21–31. [15] T.D. Ngo, A. Kashani, G. Imbalzano, K.T. Nguyen, D. Hui, Additive manufacturing (3D printing): a review of materials, methods, applications and challenges, Compos. Part B: Eng. 143 (2018) 172–196. [16] M. Valente, A. Sibai, M. Sambucci, Extrusion-based additive manufacturing of concrete products: revolutionizing and remodeling the construction industry, J. Compos. Sci. 3 (3) (2019) 88. [17] N. Roussel, J. Spangenberg, J. Wallevik, R. Wolfs, Numerical simulations of concrete processing: from standard formative casting to additive manufacturing, Cem. Concr. Res. 135 (2020), 106075. [18] R.J.M. Wolfs, F.P. Bos, T.A.M. Salet, Early age mechanical behaviour of 3D printed concrete: numerical modelling and experimental testing, Cem. Concr. Res. 106 (2018) 103–116. [19] R. Comminal, M.P. Serdeczny, D.B. Pedersen, J. Spangenberg, Numerical modeling of the strand deposition flow in extrusion-based additive manufacturing, Addit. Manuf. 20 (2018) 68–76. [20] R. Comminal, M.P. Serdeczny, D.B. Pedersen, J. Spangenberg, Numerical modeling of the material deposition and contouring precision in fused deposition modeling, in Proceedings of the 29th Annual International Solid Freeform Fabrication Symposium, Austin, TX, USA, 2018, pp. 1855–1864. [21] M.P. Serdeczny, R. Comminal, D.B. Pedersen, J. Spangenberg, Experimental validation of a numerical model for the strand shape in material extrusion additive manufacturing, Addit. Manuf. 24 (2018) 145–153. [22] M.P. Serdeczny, R. Comminal, D.B. Pedersen, J. Spangenberg, Numerical simulations of the mesostructure formation in material extrusion additive manufacturing, Addit. Manuf. 28 (2019) 419–429. [23] H. Xia, J. Lu, G. Tryggvason, A numerical study of the effect of viscoelastic stresses in fused filament fabrication, Comput. Methods Appl. Mech. Eng. 346 (2019) 242–259. [24] R. Comminal, W.R.L. da Silva, T.J. Andersen, H. Stang, J. Spangenberg, Influence of processing parameters on the layer geometry in 3D concrete printing: experiments and modelling, in: Proceedings of the Second RILEM International Conference on Concrete and Digital Fabrication, vol. 28, 2020, pp. 852–862. [25] R. Comminal, W.R.L. da Silva, T.J. Andersen, H. Stang, J. Spangenberg, Modelling of 3D concrete printing based on computational fluid dynamics, Cem. Concr. Res. 38 (2020), 106256. [26] E.C. Bingham, An investigation of the laws of plastic flow, US Bur. Stand. Bull. 13 (1916) 309–352. [27] N. Casson, A flow equation for pigment-oil suspensions of the printing ink type, Rheol. Disperse Syst. (1959) 84–104. [28] W.H. Herschel, R. Bulkley, Konsistenzmessungen von Gummi-Benzollosungen, ¨ Kolloid Z. 39 (1926) 291–300. [29] “FLOW-3D | We solve The World’s Toughest CFD Problems,” FLOW SCIENCE. 〈https://www.flow3d.com/〉. (Accessed 27 June 2020). [30] S. Jacobsen, R. Cepuritis, Y. Peng, M.R. Geiker, J. Spangenberg, Visualizing and simulating flow conditions in concrete form filling using pigments, Constr. Build. Mater. 49 (2013) 328–342. [31] E.J. O’Donovan, R.I. Tanner, Numerical study of the Bingham squeeze film problem, J. Non-Newton. Fluid Mech. 15 (1) (1984) 75–83. [32] C.W. Hirt, B.D. Nichols, Volume of fluid (VOF) method for the dynamics of free boundaries, J. Comput. Phys. 39 (1) (1981) 201–225. [33] R. Comminal, J. Spangenberg, J.H. Hattel, Cellwise conservative unsplit advection for the volume of fluid method, J. Comput. Phys. 283 (2015) 582–608. [34] A. Negar, S. Nazarian, N.A. Meisel, J.P. Duarte, Experimental prediction of material deformation in large-scale additive manufacturing of concrete, Addit. Manuf. 37 (2021), 101656.
Yu Hao a, Nannan Chen a,b, Hui-Ping Wang c,*, Blair E. Carlson c, Fenggui Lu a,* a Shanghai Key Laboratory of Materials Laser Processing and Modification, School of Materials Science and Engineering, Shanghai Jiao Tong University, Shanghai, 200240, PR China b Department of Industrial and Manufacturing Eng
ABSTRACT
A three-dimensional thermal-fluid numerical model considering zinc vapor interaction with the molten pool was developed to study the occurrence of zinc vapor-induced spatter in partial penetration laser overlap welding of zinc-coated steels. The zinc vapor effect was represented by two forces: a jet pressure force acting on the keyhole rear wall as the vapor bursts into the keyhole and a drag force on the upper keyhole wall as the vapor escapes upwards. The numerical model was calibrated by comparing the predicted keyhole shape with the keyhole shape observed by high-speed X-ray imaging and applied for various weld schedules. The study showed that large jet pressure forces induced violent fluctuations of the keyhole rear wall, resulting in an unstable keyhole and turbulent melt flow. A large drag force pushed the melt adjacent to the keyhole surface upward and accelerated the movement of the melt whose velocities reached 1 m/s or even higher, potentially inducing spatter. Increased heat input facilitated the occurrence of large droplets of spatter, which agreed with experimental observations captured by high-speed camera.
아연도금강의 부분용입 레이저 겹침용접에서 아연증기유도 스패터의 발생을 연구하기 위하여 용융풀과의 아연증기 상호작용을 고려한 3차원 열유체 수치모델을 개발하였습니다.
아연 증기 효과는 증기가 열쇠 구멍으로 폭발할 때 키홀 뒤쪽 벽에 작용하는 제트 압력력과 증기가 위쪽으로 빠져나갈 때 위쪽 키홀 벽에 작용하는 항력의 두 가지 힘으로 표시됩니다.
수치 모델은 예측된 열쇠 구멍 모양과 고속 X선 영상으로 관찰된 키홀 모양을 비교하여 보정하고 다양한 용접 일정에 적용했습니다.
이 연구는 큰 제트 압력이 키홀 뒷벽의 격렬한 변동을 유발하여 불안정한 열쇠 구멍과 난류 용융 흐름을 초래한다는 것을 보여주었습니다. 큰 항력은 키홀 표면에 인접한 용융물을 위로 밀어올리고 속도가 1m/s 이상에 도달한 용융물의 이동을 가속화하여 잠재적으로 스패터를 유발할 수 있습니다.
증가된 열 입력은 고속 카메라로 포착한 실험적 관찰과 일치하는 큰 방울의 스패터 발생을 촉진했습니다.
Fig. 1. Schematic of zero-gap laser welding of zinc-coated steel.Fig. 2. Experimental setup for capturing a side view of the laser welding of
zinc-coated steel enabled by use of high-temperature glass.Fig. 3. Experimental angled top-view setup for laser welding of zinc-coated
steel with a laser illumination. Fig. 4. Schematic of the rotating Gaussian body heat source.Fig. 5. Schematic of jet pressure force caused by zinc vapor: (a) locating the outlet of zinc vapor (point A), (b) schematic of assigning the jet pressure force.Fig. 6. Schematic of drag force caused by zinc vapor.Fig. 7. Procedure for calculating the outgassing velocity of zinc vapor.Fig. 8. Schematic related to calculating the zone of vaporized zinc.Fig. 9. The meshed domains for the thermal-fluid simulation of laser welding.Fig. 10. The calculated temperature field and validation: (a) 3-D temperature field; (b)-(f) Comparison of experimental and simulated weld cross section: (b) P =
2000 W, v = 50 mm/s; (c) P = 2500 W, v = 50 mm/s; (d) P = 3000 W, v = 50 mm/s; (e) P = 3000 W, v = 60 mm/s; (f) P = 3000 W, v = 70 mm/s.Fig. 11. Comparison of X-Ray images of in-process keyhole profiles and the numerical predictions: (a) Single sheet penetration (P = 480 W, v = 150 mm/s); (b) Two
sheet penetration (P = 532 W, v = 150 mm/s). Fig. 12. High-speed images of dynamic keyhole in laser welding of steels: (a) without zinc coating (b) with zinc coating.Fig. 13. Mass loss and molten pool observation under different laser power and welding velocity for 1.2 mm + 1.2 mm HDG 420LA stack-upFig. 14. Numerical results of keyhole and flow field in molten pool: (a) without zinc vapor forces, (b) with zinc vapor forces.Fig. 18. Calculated velocity fields for different welding parameters: (a) P = 2 kW, v = 50 mm/s, (b) P = 2.5 kW, v = 50 mm/s, (c) P = 3 kW, v = 50 mm/s, (d) P = 3
kW, v = 60 mm/s, (e) P = 3 kW, v = 70 mm/s. Fig. 19. Schematic of the generation of spatter in different sizes: (a) small size, (b) large size.
References
Ai, Y., Jiang, P., Wang, C., et al., 2018. Experimental and numerical analysis of molten pool and keyhole profile during high-power deep-penetration laser welding. Int. J. Heat Mass Transf. 126 (part-A), 779–789. Chen, Z., Yang, S., Wang, C., et al., 2014. A study of fiber laser welding of galvanized steel using a suction method. J. Mater. Process. Technol. 214 (7), 1456–1465. Cho, W.I., Na, S.J., Thomy, C., et al., 2012. Numerical simulation of molten pool dynamics in high power disk laser welding. J. Mater. Process. Technol. 212 (1), 262–275. Deng, S., Wang, H.P., Lu, F., et al., 2019. Investigation of spatter occurrence in remote laser spiral welding of zinc-coated steels. Int. J. Heat Mass Transf. 140 (9), 269–280. Fabbro, R., Coste, F., Goebels, D., et al., 2006. Study of CW Nd-Yag laser welding of Zncoated steel sheets. J. Phys. D Appl. Phys. 39 (2), 401. Gao, Z., Wu, Y., Huang, J., 2009. Analysis of weld pool dynamic during stationary laser–MIG hybrid welding. Int. J. Adv. Manuf. Technol. 44 (9), 870–879. Kaplan, A., 1994. A model of deep penetration laser welding based on calculation of the keyhole profile. J. Phys. D Appl. Phys. 27 (9), 1805. Kim, J., Oh, S., Ki, H., 2015. A study of keyhole geometry in laser welding of zinc-coated and uncoated steels using a coaxial observation method. J. Mater. Process. Technol. 225, 451–462. Kim, J., Oh, S., Ki, H., 2016. Effect of keyhole geometry and dynamics in zero-gap laser welding of zinc-coated steel sheets. J. Mater. Process. Technol. 232, 131–141. Koch, H., KaGeler, C., Otto, A., et al., 2011. Analysis of welding zinc coated steel sheets in zero gap configuration by 3D simulations and high-speed imaging. Phys. Procedia 12 (part-B), 428–436. Kouraytem, N., Li, X., Cunningham, R., et al., 2019. Effect of laser-matter interaction on molten pool flow and keyhole dynamics. Phys. Rev. Appl. 11 (6), 54–64. Li, S., Chen, G., Katayama, S., et al., 2014. Relationship between spatter formation and dynamic molten pool during high-power deep-penetration laser welding. Appl. Surf. Sci. 303 (6), 481–488. Ma, J., 2013. Experimental and Numerical Studies on the Issues in Laser Welding of Galvanized High-Strength Dual-Phase Steels in a Zero-Gap Lap Joint Configuration, PhD Thesis. Southern Methodist University. Pan, Y., 2011. Laser Welding of Zinc Coated Steel Without a Pre-Set Gap, PhD Thesis. Delft University of Technology. Schmidt, M., Otto, A., 2008. Analysis of YAG laser lap-welding of zinc coated steel sheets. CIRP Ann. Manuf. Technol. 57, 213–216. Semak, V., Matsunawa, A., 1999. The role of recoil pressure in energy balance during laser materials processing. J. Phys. D Appl. Phys. 30 (18), 2541. Wu, S., Zhao, H., Wang, Y., Zhang, X., 2004. A new heat source model in numerical simulation of high energy beam welding. Trans. China Weld. 21, 99–102. Yaws, C.L., 2015. The Yaws Handbook of Vapor Pressure: Antoine Coefficients. Zhou, J., Tsai, H.L., 2008. Modeling of transport phenomena in hybrid laser-MIG keyhole welding. Int. J. Heat Mass Transf. 51 (17–18), 4353–4366.
다중 재료 재료 분사 적층 제조 공정은 3차원(3D) 부품을 레이어별로 구축하기 위해 다양한 모델 및 지지 재료의 미세 액적을 증착합니다.
최근의 노력은 액체가 마이크로/밀리 채널에서 쉽게 퍼지할 수 있는 지지 재료로 작용할 수 있고 구조에 영구적으로 남아 있는 작동 유체로 작용할 수 있음을 보여주었지만 인쇄 프로세스 및 메커니즘에 대한 자세한 이해가 부족합니다.
액체 인쇄의 제한된 광범위한 적용. 이 연구에서 광경화성 및 광경화성 액체 방울이 동시에 증착되는 액체-고체 공동 인쇄라고 하는 “한 번에 모두 가능한” 다중 재료 인쇄 프로세스가 광범위하게 특성화됩니다. 액체-고체 공동 인쇄의 메커니즘은 실험적인 고속 이미징 및 CFD(전산 유체 역학) 연구를 통해 설명됩니다.
이 연구는 액체의 표면 장력이 액체 표면에서 광중합하여 재료의 단단한 층을 형성하는 분사된 광중합체 미세 방울을 지지할 수 있음을 보여줍니다.
마이크로/밀리 유체 소자의 액체-고체 공동 인쇄를 위한 설계 규칙은 믹서, 액적 발생기, 고도로 분기되는 구조 및 통합된 단방향 플랩 밸브와 같은 평면, 3D 및 복합 재료 마이크로/메조 유체 구조에 대한 사례 연구뿐만 아니라 제시됩니다.
우리는 액체-고체 공동 인쇄 과정을 마이크로/메조플루이딕 회로, 전기화학 트랜지스터, 칩 장치 및 로봇을 포함한 응용 프로그램을 사용하여 3D, 통합된 복합 재료 유체 회로 및 유압 구조의 단순하고 빠른 제작을 가능하게 하는 적층 제조의 핵심 새로운 기능으로 구상합니다.
Multi-material material jetting additive manufacturing processes deposit micro-scale droplets of different model and support materials to build three-dimensional (3D) parts layer by layer. Recent efforts have demonstrated that liquids can act as support materials, which can be easily purged from micro/milli-channels, and as working fluids, which permanently remain in a structure, yet the lack of a detailed understanding of the print process and mechanism has limited widespread applications of liquid printing. In this study, an “all in one go” multi-material print process, herein termed liquid–solid co-printing in which non photo-curable and photo-curable liquid droplets are simultaneous deposited, is extensively characterized. The mechanism of liquid–solid co-printing is explained via experimental high speed imaging and computational fluid dynamic (CFD) studies. This work shows that a liquid’s surface tension can support jetted photopolymer micro-droplets which photo-polymerize on the liquid surface to form a solid layer of material. Design rules for liquid–solid co-printing of micro/milli-fluidic devices are presented as well as case studies of planar, 3D, and multi-material micro/mesofluidic structures such as mixers, droplet generators, highly branching structures, and an integrated one-way flap valve. We envision the liquid–solid co-printing process as a key new capability in additive manufacturing to enable simple and rapid fabrication of 3D, integrated print-in-place multi-material fluidic circuits and hydraulic structures with applications including micro/mesofluidic circuits, electrochemical transistors, lab-on-a-chip devices, and robotics.
Liquid-solid co-printing of multi-material 3D fluidic devices via material jetting
Keywords
Additive manufacturing; Mesofluidics; Modeling and simulation; Multi-material; Material jetting
W.E. Alphonso1, M.Bayat1,*, M. Baier 2, S. Carmignato2, J.H. Hattel1 1Department of Mechanical Engineering, Technical University of Denmark (DTU), Lyngby, Denmark 2Department of Management and Engineering – University of Padova, Padova, Italy
ABSTRACT
L-PBF(Laser Powder Bed Fusion)는 레이저 열원을 사용하여 선택적으로 통합되는 분말 층으로 복잡한 3D 금속 부품을 만드는 금속 적층 제조(MAM) 기술입니다. 처리 영역은 수십 마이크로미터 정도이므로 L-PBF를 다중 규모 제조 공정으로 만듭니다.
기체 기공의 형성 및 성장 및 용융되지 않은 분말 영역의 생성은 다중물리 모델에 의해 예측할 수 있습니다. 또한 이러한 모델을 사용하여 용융 풀 모양 및 크기, 온도 분포, 용융 풀 유체 흐름 및 입자 크기 및 형태와 같은 미세 구조 특성을 계산할 수 있습니다.
이 작업에서는 용융, 응고, 유체 흐름, 표면 장력, 열 모세관, 증발 및 광선 추적을 통한 다중 반사를 포함하는 스테인리스 스틸 316-L에 대한 충실도 다중 물리학 중간 규모 수치 모델이 개발되었습니다. 완전한 실험 설계(DoE) 방법을 사용하는 통계 연구가 수행되었으며, 여기서 불확실한 재료 특성 및 공정 매개변수, 즉 흡수율, 반동 압력(기화) 및 레이저 빔 크기가 용융수지 모양 및 크기에 미치는 영향을 분석했습니다.
또한 용융 풀 역학에 대한 위에서 언급한 불확실한 입력 매개변수의 중요성을 강조하기 위해 흡수율이 가장 큰 영향을 미치고 레이저 빔 크기가 그 뒤를 잇는 주요 효과 플롯이 생성되었습니다. 용융 풀 크기에 대한 반동 압력의 중요성은 흡수율에 따라 달라지는 용융 풀 부피와 함께 증가합니다.
모델의 예측 정확도는 유사한 공정 매개변수로 생성된 단일 트랙 실험과 시뮬레이션의 용융 풀 모양 및 크기를 비교하여 검증됩니다.
더욱이, 열 렌즈 효과는 레이저 빔 크기를 증가시켜 수치 모델에서 고려되었으며 나중에 결과적인 용융 풀 프로파일은 모델의 견고성을 보여주기 위한 실험과 비교되었습니다.
Laser Powder Bed Fusion (L-PBF) is a Metal Additive Manufacturing (MAM) technology where a complex 3D metal part is built from powder layers, which are selectively consolidated using a laser heat source. The processing zone is in the order of a few tenths of micrometer, making L-PBF a multi-scale manufacturing process. The formation and growth of gas pores and the creation of un-melted powder zones can be predicted by multiphysics models. Also, with these models, the melt pool shape and size, temperature distribution, melt pool fluid flow and its microstructural features like grain size and morphology can be calculated. In this work, a high fidelity multi-physics meso-scale numerical model is developed for stainless steel 316-L which includes melting, solidification, fluid flow, surface tension, thermo-capillarity, evaporation and multiple reflection with ray-tracing. A statistical study using a full Design of Experiments (DoE) method was conducted, wherein the impact of uncertain material properties and process parameters namely absorptivity, recoil pressure (vaporization) and laser beam size on the melt pool shape and size was analysed. Furthermore, to emphasize on the significance of the above mentioned uncertain input parameters on the melt pool dynamics, a main effects plot was created which showed that absorptivity had the highest impact followed by laser beam size. The significance of recoil pressure on the melt pool size increases with melt pool volume which is dependent on absorptivity. The prediction accuracy of the model is validated by comparing the melt pool shape and size from the simulation with single track experiments that were produced with similar process parameters. Moreover, the effect of thermal lensing was considered in the numerical model by increasing the laser beam size and later on the resultant melt pool profile was compared with experiments to show the robustness of the model.
Figure 1: a) Computational domain for single track L-PBF which includes a 200 μm thick substrate and 45 μm powder layer
thickness b) 3D temperature contour plot after scanning a single track with melt pool contours at two locations along the
scanning direction where the green region indicates the melted regions.Figure 2: Main effects plot of uncertain parameters: absorptivity, recoil pressure coefficient and laser beam radius on the melt
pool dimensions (width and depth)Figure 3: 3D temperature contours and 2D melt pool cross-sections where the melt pool is stabilized at x=500 µm from the
start of the laser initial location for cases where (a) absorptivity = 0.1, Recoil pressure coefficient B = 1 and laser beam radius
= 12 µm, (b) absorptivity = 0.1, Recoil pressure coefficient B = 20 and laser beam radius = 12 µm, (c) absorptivity = 0.1, Recoil
pressure coefficient B = 1 and laser beam radius = 18 µm, (d) absorptivity = 0.45, Recoil pressure coefficient B = 1 and laser
beam radius = 18 µm, (e) absorptivity = 0.45, Recoil pressure coefficient B = 20 and laser beam radius = 12 µm, (f) absorptivity
= 0.45, Recoil pressure coefficient B = 20 and laser beam radius = 18 µm.Figure 4: Validation of Numerical model with Recoil pressure coefficient B= 20, absorptivity = 0.45 and a) laser beam radius
= 15 µm b) laser beam radius = 20 µm
CONCLUSION
In this work, a high-fidelity multi-physics numerical model was developed for L-PBF using the FVM method in Flow-3D. The impact of uncertainty in the input parameters including absorptivity, recoil pressure and laser beam size on the melt pool is addressed using a DoE method. The DoE analysis shows that absorptivity has the highest impact on the melt pool. The recoil pressure and laser beam size only become significant once absorptivity is 0.45. Furthermore, the numerical model is validated by comparing the predicted melt pool shape and size with experiments conducted with similar process parameters wherein a high prediction accuracy is achieved by the model. In addition, the impact of thermal lensing on the melt pool dimensions by increasing the laser beam spot size is considered in the validated numerical model and the resultant melt pool is compared with experiments.
REFERENCES
[1] T. Bonhoff, M. Schniedenharn, J. Stollenwerk, P. Loosen, Experimental and theoretical analysis of thermooptical effects in protective window for selective laser melting, Proc. Int. Conf. Lasers Manuf. LiM. (2017) 26–29. https://www.wlt.de/lim/Proceedings2017/Data/PDF/Contribution31_final.pdf. [2] L.R. Goossens, Y. Kinds, J.P. Kruth, B. van Hooreweder, On the influence of thermal lensing during selective laser melting, Solid Free. Fabr. 2018 Proc. 29th Annu. Int. Solid Free. Fabr. Symp. – An Addit. Manuf. Conf. SFF 2018. (2020) 2267–2274. [3] J. Shinjo, C. Panwisawas, Digital materials design by thermal-fluid science for multi-metal additive manufacturing, Acta Mater. 210 (2021) 116825. https://doi.org/10.1016/j.actamat.2021.116825. [4] Z. Zhang, Y. Huang, A. Rani Kasinathan, S. Imani Shahabad, U. Ali, Y. Mahmoodkhani, E. Toyserkani, 3- Dimensional heat transfer modeling for laser powder-bed fusion additive manufacturing with volumetric heat sources based on varied thermal conductivity and absorptivity, Opt. Laser Technol. 109 (2019) 297–312. https://doi.org/10.1016/j.optlastec.2018.08.012. [5] M. Bayat, A. Thanki, S. Mohanty, A. Witvrouw, S. Yang, J. Thorborg, N.S. Tiedje, J.H. Hattel, Keyholeinduced porosities in Laser-based Powder Bed Fusion (L-PBF) of Ti6Al4V: High-fidelity modelling and experimental validation, Addit. Manuf. 30 (2019) 100835. https://doi.org/10.1016/j.addma.2019.100835. [6] M. Bayat, S. Mohanty, J.H. Hattel, Multiphysics modelling of lack-of-fusion voids formation and evolution in IN718 made by multi-track/multi-layer L-PBF, Int. J. Heat Mass Transf. 139 (2019) 95–114. https://doi.org/10.1016/j.ijheatmasstransfer.2019.05.003. [7] J. Metelkova, Y. Kinds, K. Kempen, C. de Formanoir, A. Witvrouw, B. Van Hooreweder, On the influence of laser defocusing in Selective Laser Melting of 316L, Addit. Manuf. 23 (2018) 161–169. https://doi.org/10.1016/j.addma.2018.08.006.
M. Bayat* , V. K. Nadimpalli, J. H. Hattel 1Department of Mechanical Engineering, Technical University of Denmark (DTU), Produktionstorvet 425, Kgs. 2800, Lyngby, Denmark
ABSTRACT
L-PBF(Laser Powder Bed Fusion)는 다양한 산업 분야에서 많은 관심을 받았으며, 주로 기존 제조 기술을 사용하여 만들 수 없었던 복잡한 토폴로지 최적화 구성 요소를 구현하는 잘 알려진 능력 덕분입니다. . 펄스 L-PBF(PL-PBF)에서 레이저의 시간적 프로파일은 주기 지속 시간과 듀티 주기 중 하나 또는 둘 다를 수정하여 변조할 수 있습니다. 따라서 레이저의 시간적 프로파일은 향후 적용을 위해 이 프로세스를 더 잘 제어할 수 있는 길을 열어주는 새로운 프로세스 매개변수로 간주될 수 있습니다. 따라서 이 작업에서 우리는 레이저의 시간적 프로파일을 변경하는 것이 PL-PBF 공정에서 용융 풀 조건과 트랙의 최종 모양 및 형상에 어떻게 영향을 미칠 수 있는지 조사하는 것을 목표로 합니다. 이와 관련하여 본 논문에서는 CFD(Computational Fluid Dynamics) 소프트웨어 패키지인 Flow-3D를 기반으로 하는 316-L 스테인리스강 PL-PBF 공정의 다중물리 수치 모델을 개발하고 이 모델을 사용하여 열과 유체를 시뮬레이션합니다. 다양한 펄스 모드에서 공정 과정 중 용융 풀 내부에서 발생하는 유동 조건. 따라서 고정된 레이저 듀티 사이클(50%)이 있는 레이저 주기 지속 시간이 용융 풀의 모양과 크기 및 최종 트랙 형태에 미치는 영향을 연구하기 위해 매개변수 연구가 수행됩니다. 더 긴 주기 기간에서 더 많은 재료가 더 큰 용융 풀 내에서 변위됨에 따라 용융 풀의 후류에 더 눈에 띄는 혹이 형성되며, 동시에 더 심각한 반동 압력을 받습니다. 또한 시뮬레이션에서 50% 듀티 사이클에서 1000μs에서 형성된 보다 대칭적인 용융 풀과 비교하여 400μs 사이클 주기에서 더 긴 용융 풀이 형성된다는 것이 관찰되었습니다. 풀 볼륨은 1000μs의 경우 더 큽니다. 매개변수 연구는 연속 트랙과 파손된 트랙 PL-PBF 사이의 경계를 설명하며, 여기서 연속 트랙은 항상 소량의 용융 재료를 유지함으로써 유지됩니다.
English Abstract
Laser Powder Bed Fusion (L-PBF) has attracted a lot of attention from various industrial sectors and mainly thanks to its well-proven well-known capacity of realizing complex topology-optimized components that have so far been impossible to make using conventional manufacturing techniques. In Pulsed L-PBF (PL-PBF), the laser’s temporal profile can be modulated via modifying either or both the cycle duration and the duty cycle. Thus, the laser’s temporal profile could be considered as a new process parameter that paves the way for a better control of this process for future applications. Therefore, in this work we aim to investigate how changing the laser’s temporal profile can affect the melt pool conditions and the final shape and geometry of a track in the PL-PBF process. In this respect, in this paper a multiphysics numerical model of the PL-PBF process of 316-L stainless steel is developed based on the computational fluid dynamics (CFD) software package Flow-3D and the model is used to simulate the heat and fluid flow conditions occurring inside the melt pool during the course of the process at different pulsing modes. Thus, a parametric study is carried out to study the influence of the laser’s cycle duration with a fixed laser duty cycle (50 %) on the shape and size of the melt pool and the final track morphology. It is noticed that at longer cycle periods, more noticeable humps form at the wake of the melt pool as more material is displaced within bigger melt pools, which are at the same time subjected to more significant recoil pressures. It is also observed in the simulations that at 50 % duty cycle, longer melt pools form at 400 μs cycle period compared to the more symmetrical melt pools formed at 1000 μs, primarily because of shorter laser off-times in the former, even though melt pool volume is bigger for the 1000 μs case. The parameteric study illustrates the boundary between a continuous track and a broken track PL-PBF wherein the continuous track is retained by always maintaining a small volume of molten material.
Figure 1: Front and side views of the computational domain. Note that the region along z and from -100 μm to +50 μm is void.Figure 2: Temperature contours and melt pool border lines at different times for the 50 % duty cycle case: (a) – (c) Δtcycle =
400 μs, (d) – (f) Δtcycle = 1000 μs and (g) – (i) Δtcycle = 3000 μs.
Figure 3: Plot of melt pool volume versus time for four cases including continuous wave laser as well as 50 % duty cycle at
400 μs, 1000 μs and 3000 μs.
CONCLUSIONS
In this work a CFD model of the modulated PL-PBF process of stainless steel 316-L is developed in the commercial software package Flow-3D. The model involves physics such as solidification, melting, evaporation, convection, laser-material interaction, capillarity, Marangoni effect and the recoil pressure effect. In the current study, a parametric study is carried out to understand how the change in the cycle period duration affects the melt pool’s thermo-fluid conditions during the modulated PL-PBF process. It is observed that at the pulse mode with 50 % duty cycle and 400 μs cycle period, an overlapped chain of humps form at the wake of the melt pool and at a spatial frequency of occurrence of about 78 μm. Furthermore and as expected, it is noted that the melt pool volume, the size of the hump as well as the crater size at the end of the track, increase with increase in the cycle period duration, as more material is re-deposited at the back of the melt pool and that itself is caused by more pronounced recoil pressures. Moreover, it is noticed that due to the short off-time period of the laser in the 400 μs cycle period case, there is always an amount of liquid metal left from the previous cycle, at the time the new cycle starts. This is found to be the main reason why longer and elongated melt pools form at 400 μs cycle period, compared to the bigger, shorter and more symmetrical-like melt pools forming at the 1000 μs case. In this study PL-PBF single tracks including the broken track and the continuous track examples were studied to illustrate the boundary of this transition at a given laser scan parameter setting. At higher scan speeds, it is expected that the Plateau–Rayleigh instability will compete with the pulsing behavior to change the transition boundary between a broken and continuous track, which is suggested as future work from this study.
REFERENCES
[1] T. Craeghs, L. Thijs, F. Verhaeghe, J.-P. Kruth, J. Van Humbeeck, A study of the microstructural evolution during selective laser melting of Ti–6Al–4V, Acta Mater. 58 (2010) 3303–3312. https://doi.org/10.1016/j.actamat.2010.02.004. [2] J. Liu, A.T. Gaynor, S. Chen, Z. Kang, K. Suresh, A. Takezawa, L. Li, J. Kato, J. Tang, C.C.L. Wang, L. Cheng, X. Liang, A.C. To, Current and future trends in topology optimization for additive manufacturing, (2018) 2457–2483. [3] M. Bayat, W. Dong, J. Thorborg, A.C. To, J.H. Hattel, A review of multi-scale and multi-physics simulations of metal additive manufacturing processes with focus on modeling strategies, Addit. Manuf. 47 (2021). https://doi.org/10.1016/j.addma.2021.102278. [4] A. Foroozmehr, M. Badrossamay, E. Foroozmehr, S. Golabi, Finite Element Simulation of Selective Laser Melting process considering Optical Penetration Depth of laser in powder bed, Mater. Des. 89 (2016) 255–263. https://doi.org/10.1016/j.matdes.2015.10.002. [5] Y.S. Lee, W. Zhang, Modeling of heat transfer, fluid flow and solidification microstructure of nickel-base superalloy fabricated by laser powder bed fusion, Addit. Manuf. 12 (2016) 178–188. https://doi.org/10.1016/j.addma.2016.05.003. [6] S.A. Khairallah, A.T. Anderson, A. Rubenchik, W.E. King, Laser powder-bed fusion additive manufacturing: Physics of complex melt flow and formation mechanisms of pores, spatter, and denudation zones, Acta Mater. 108 (2016) 36–45. https://doi.org/10.1016/j.actamat.2016.02.014. [7] M. Bayat, A. Thanki, S. Mohanty, A. Witvrouw, S. Yang, J. Thorborg, N.S. Tiedje, J.H. Hattel, Keyholeinduced porosities in Laser-based Powder Bed Fusion (L-PBF) of Ti6Al4V: High-fidelity modelling and experimental validation, Addit. Manuf. 30 (2019). https://doi.org/10.1016/j.addma.2019.100835. [8] A. Charles, M. Bayat, A. Elkaseer, L. Thijs, J.H. Hattel, S. Scholz, Elucidation of dross formation in laser powder bed fusion at down-facing surfaces: phenomenon-oriented multiphysics simulation and experimental validation, Addit. Manuf. Under revi (2021). [9] M. Bayat, V.K. Nadimpalli, D.B. Pedersen, J.H. Hattel, A fundamental investigation of thermo-capillarity in laser powder bed fusion of metals and alloys, Int. J. Heat Mass Transf. 166 (2021) 120766. https://doi.org/10.1016/j.ijheatmasstransfer.2020.120766. [10] J.D. Roehling, S.A. Khairallah, Y. Shen, A. Bayramian, C.D. Boley, A.M. Rubenchik, J. Demuth, N. Duanmu, M.J. Matthews, Physics of large-area pulsed laser powder bed fusion, Addit. Manuf. 46 (2021) https://doi.org/10.1016/j.addma.2021.102186. [11] M. Zheng, L. Wei, J. Chen, Q. Zhang, J. Li, S. Sui, G. Wang, W. Huang, Surface morphology evolution during pulsed selective laser melting: Numerical and experimental investigations, Appl. Surf. Sci. 496 (2019) 143649. https://doi.org/10.1016/j.apsusc.2019.143649. [12] M. Bayat, V.K. Nadimpalli, D.B. Pedersen, J.H. Hattel, A fundamental investigation of thermo-capillarity in laser powder bed fusion of metals and alloys, Int. J. Heat Mass Transf. 166 (2021). https://doi.org/10.1016/j.ijheatmasstransfer.2020.120766.
A 3D numerical model of heat transfer and fluid flow of molten pool in the process of laser wire deposition was presented by computational fluid dynamics technique. The simulation results of the deposition morphology were also compared with the experimental results under the condition of liquid bridge transfer mode. Moreover, they showed a good agreement. Considering the effect of recoil pressure, the morphology of the deposit metal obtained by the simulation was similar to the experiment result. Molten metal at the wire tip was peeled off and flowed into the molten pool, and then spread to both sides of the deposition layer under the recoil pressure. In addition, the results of simulation and high-speed charge-coupled device presented that a wedge transition zone, with a length of ∼6 mm, was formed behind the keyhole in the liquid bridge transfer process, where the height of deposited metal decreased gradually. After solidification, metal in the transition zone retained the original melt morphology, resulting in a decrease in the height of the tail of the deposition layer.
Keywords
LWD, CFD, liquid bridge transfer, fluid dynamics, wedge transition zone
Fluid Thermodynamic Simulation of Ti-6Al-4V Alloy in Laser Wire DepositionFluid Thermodynamic Simulation of Ti-6Al-4V Alloy in Laser Wire Deposition
References
1. Matthews MJ, Guss G, Khairallah SA, et al. Denudation of metal powder layers in laser powder bed fusion processes. Acta Mater 2016;114:33–42. Crossref, Google Scholar
2. Ge WJ, Han SW, Fang YC, et al. Mechanism of surface morphology in electron beam melting of Ti6Al4V based on computational flow patterns. Appl Surf Sci 2017;419:150–158. Crossref, Google Scholar
3. Bai XW, Colegrove P, Ding JL, et al. Numerical analyswas of heat transfer and fluid flow in multilayer deposition of PAW-based wire and arc additive manufacturing. Int J Heat Mass Transf 2018;124:504–516. Crossref, Google Scholar
4. Torkamany MJ, Kaplan AFH, Ghaini FM. Wire deposition by a laser-induced boiling front. Opt Laser Technol 2015;69:104–112. Crossref, Google Scholar
5. Yu Y, Huang W, Wang G. Investigation of melting dynamics of filler wire during wire feed laser welding. J Mec Sci Technol 2013;27:1097–1108. Crossref, Google Scholar
6. Ma G, Li L, Chen Y. Effects of beam confgurations on wire melting and transfer behaviors in dual beam laser welding with fller wire. Opt Laser Technol 2017;91:138–148. Crossref, Google Scholar
7. Abioye TE, Folkes J, Clare AT. A parametric study of Inconel 625 wire laser deposition. J Mater Process Tech 2013;213:2145–2151. Crossref, Google Scholar
8. Wei S, Wang G, Shin YC, et al. Comprehensive modeling of transport phenomena in laser hot-wire deposition process. Int J Heat Mass Transf 2018;125:1356–1368. Crossref, Google Scholar
9. Gu H, Li L. Computational fluid dynamic simulation of gravity and pressure effects in laser metal deposition for potential additive manufacturing in space. Int J Heat Mass Transf 2019;140:51–65. Crossref, Google Scholar
10. Hu R, Luo M, Liu T, et al. Thermal fluid dynamics of liquid bridge transfer in laser wire deposition 3D printing. Sci Technolf Weld Join 2019;24:1–11. Google Scholar
11. Chatterjee D, Chakraborty S. A hybrid lattice Boltzmann model for solid–liquid phase transition in presence of fluid flow. Phys Lett A 2006;351:359–367. Crossref, Google Scholar
12. Wu L, Cheon J, Kiran DV, et al. CFD simulations of GMA welding of horizontal fillet joints based on coordinate rotation of arc models. J Mater Process Tech 2016;231:221–238. Crossref, Google Scholar
13. Gerhard W, Boyer RR, Collings EW. Materials Properties Handbook: Titanium Alloys. ASM International: Almere, The Netherlands, 1994. Google Scholar
14. Colegrove P, Simiand PE, Varughese A, et al. Evaluation of a drilling model approach to represent laser spot microwelding. In: ASM Proceedings of the international conference: trends in welding research; 2009. Google Scholar
15. Boivineau M, Cagran C, Doytier D, et al. Thermophysical properties of solid and liquid Ti-6Al-4V (TA6V) alloy. Int J Thermophys 2006;27:507–529. Crossref, Google Scholar
16. Shejndlin AE, Kenisarin MM, Chekhovskoj VY. Melting point of yttrium oxide. AN SSSR 1974;216:582–584. Google Scholar
17. Cho JH, Na SJ. Teflection and Fresnel absorption of laser beam in keyhole. J Phys D Appl Phys 2006;39:5372–5378. Crossref, Google Scholar
18. Han SW, Ahn J, Na SJ. A study on ray tracing method for CFD simulations of laser keyhole welding: Progressive search method. Weld World 2016;60:247–258. Crossref, Google Scholar
19. Allmen MV. Laser-Beam Interactions with Materials. Springer, Berlin-Heidelberg, 1995. Google Scholar
20. Dobson PJ. Absorption and scattering of light by small particles. Phys Bull 1984;35:104. Crossref, Google Scholar
21. Greses J, Hilton PA, Barlow CY. Plume attenuation under high power Nd:yttritium aluminum garnet laser welding. J Laser Appl 2004;16:9–15. Crossref, Google Scholar
22. Shcheglov PY, Uspenskiy SA, Gumenyuk AV, et al. Plume attenuation of laser radiation during high power fiber laser welding. Laser Phys Lett 2011;8:475–480. Crossref, Google Scholar
23. Yang P, Liou KN. Effective refractive index for determining ray propagation in an absorbing dielectric particle. J Quant Spectrosc Radiat Transf 2009;110:300–306. Crossref, Google Scholar
24. Barber PW. Absorption and scattering of light by small particles. J Colloid Interface Sci 1984;98:290–291. Google Scholar
25. Hu ZR, Chen X, Yang G, et al. Metal transfer in wire feeding-based electron beam 3D printing: Modes, dynamics, and transition criterion. Int J Heat Mass Transf 2018;126:877–887. Crossref, Google Scholar
26. David SA, Babu SS, Vitek JM. Welding: Solidification and microstructure. JOM 2013;55:14–20. Crossref, Google Scholar
27. Zhong ML, Liu W. Laser surface cladding: The state of the art and challenges. Proc Inst Mech Eng Part C J Mech Eng Sci 2010;224:1041–1060. Crossref, Google Scholar
28. Kobryn PA, Semiatin S. Microstructure and texture evolution during solidification processing of Ti-6Al-4V. J Mater Process Technol 2003;135:330–339. Crossref, Google Scholar
29. Debroy T, David S. Physical processes in fusion welding. Rev Mod Phys 1995;67:85–112. Crossref, Google Scholar
30. Lee YS, Nordin M, Babu SS, et al. Effect of fluid convection on dendrite arm spacing in laser deposition. Metall Trans B 2014;45:1520–1528. Crossref, Google Scholar
31. Rappaz M, David SA, Vitek JM, et al. Development of microstructures in Fe15Ni15Cr single crystal electron beam welds. Metall Trans A 1989;20:1125–1138. Crossref, Google Scholar
He Gas Stripper and Rotating Disk Stripper at the RIKEN RIBF
理研 RI ビームファクトリーにおける He ガスと回転ディスクストリッパー
今尾 浩士 *・長谷部 裕雄 *
서론
우라늄 빔 등 중원소 빔의 대강도화는 다양한 단수명 원자핵을 생성·이용하고 우주에서의 원소 합성을 이해하기 위한 필수 과제이다. 중이온의 가속에 있어서는, 복수의 가속기를 이용하여, 고에너지까지 캐스케이드상으로 가속해 가지만, 효율적인 가속을 위해 도중의 하전 변환 과정은 필수 과정이라고 할 수 있다.
리켄 RI 빔팩토리(RIBF) 1)에서는 가장 무거운 우라늄 등의 가속에 있어서, 2회의 하전 변환을 실시하고 있다.
그러나 기존에 사용해 온 고정형 탄소막 스트리퍼 2)의 내구성은 대강화의 원리적 병목이며, 미국 FRIB 계획 3) 등을 포함한 차세대 RI 생성 시설의 공통 문제에서도 있었다. RIBF는 가스 4-7)과 회전형 디스크 8, 9)를 사용하여 고강도 우라늄을 견딜 수있는 스트리퍼를 개발했다.
RIBF에서 238U 빔의 가속도를 그림 1에 나타내었다. 28 GHz의 초전도 ECR 이온 소스 (10, 11)로 생성 및 선별 된 238U35 +는 입사기 RILAC2와 4 개의 링 사이클로트론 (RRC, fRC, IRC, SRC)을 사용하여 345 MeV / u까지 가속된다.
스트리퍼는 RRC 가속 후 11 MeV / u와 fRC 가속 후 51 MeV / u에서 두 번 사용된다. 첫 번째 단계는 He 가스 스트리퍼를 사용하며 U35 +에서 U64 +로 변환한다. 두 번째 단계는 회전 흑연 시트 디스크 스트리퍼이며 U64 +에서 U86 +로 변환한다.
중이온 스트리퍼는 총 열 부하, 파워 손실이라는 의미에서는 전혀 작지만, 특히 큰 것은 단위 길이 에너지 손실 dE/dx이며, 이에 특유의 어려움이 있다. 우라늄의 dE / dx는 특히 크고, 수 MeV / u-50 MeV / u 정도까지의 스트리퍼는 dE / dx가 크고 두께가 고체로서는 얇아지기 때문에 어렵다.
우리의 11 MeV / u에서의 목표 강도 10 pA는 dE / dx로 정규화 된 경우, 예를 들어 400 MeV의 양성자 빔이라면 500 mA라고 불리우는 강도에 해당한다. 또한 우라늄의 국부적 인 에너지 손실로 인한 비선형 피해도보고되었으며 상황은 더욱 심각하다.
예를 들어 제1 스트리퍼로 탄소막을 사용했을 경우, 1 µm 정도 이하의 박막을 사용하지 않을 수 없고, 취약성, 불균일성과의 싸움으로, 열 제거도 어렵다. 실제로 RIBF 초기에 사용 된 고정형 탄소막 2)에서는 우라늄 빔 20pnA 정도의 조사 강도에서도 사용 가능 시간은 반일 정도였다. 그런 다음 두 번째 스트리퍼에서도 비슷한 상황이 발생했다.
현재 사용하고 있는 He 가스 스트리퍼와 회전형 그라파이트 디스크 스트리퍼는 당시의 약 100배의 강도라도 사용 시간을 거의 신경쓸 필요가 없을 정도의 내구성을 가지고 있다.
본 논문에서는 He 가스 스트리퍼와 회전형 스트리퍼에 대해 개요와 고출력 표적으로서의 측면을 중심으로 설명한다.
図1 He ガスと回転ディスクストリッパーを用いた現在の
RIBF ウラン加速スキーム.図2 様々な厚さの He ガスによる11 MeV/u 238U の荷電分布.図3 He ガスストリッパー装置の図と全景.図4 かく乱板の写真(上)と位置依存性(下).図5 オリフィスから噴出する He のマッハ数の CFD 計算
(Solidworks flow simulation).
図6 238U ビームによる He ガス温度上昇の実験値と計算値
の比較.実験値は輸送条件の異なる幾つかの RUN の
データをプロットしている.図7 マクロパルスの長さと周期を変えた時のΔt の変化
(上)とマクロパルスの構造(下).図8 ガスジェットカーテン法コンセプト.図9 シール効果とガス置換効果(上)とオリフィスの大口径 化(下).図10 2 次元ラバール式ノズルによるガスジェットカーテ
ンの計算例(Solidworks flow simulation).図はマッハ
数のプロットである.図11 4 枚目の Be ディスク.左使用前,右使用後.図12 40 mg/cm2 グラッシーカーボンディスク図13 GS ディスク.左使用前,右使用後.図14 GTF ディスク.左使用前,右使用後.図15 U ビーム照射中の GTF ディスク図16 アクセスドア用ガラス.
左変色したガラス,右新品のガラス
References
1) Y. Yano: Nucl. Instrum. Methods 261, 1009 (2007). 2) ACF-Metals Arizona Carbon Foil Co. Inc.: http://www. techexpo.com/firms/acf-metl.html 3) J. Wei et al.: “Progress towards the Facility for Rare Isotope Beams,” in Proceedings of 2013 North American Particle Accelerator Conference (NA-PAC’13), Pasadena, CA, U.S.A., September 2013, pp. 1453–1457. 4) H. Kuboki, H. Okuno, S. Yokouchi, H. Hasebe, T. Kishida, N. Fukunishi, O. Kamigaito, A. Goto, M. Kase and Y. Yano: Phys. Rev. Spec. Top. Accel. Beams 13, 093501 (2010). 5) H. Okuno, N. Fukunishi, A. Goto, H. Hasebe, H. Imao, O. Kamigaito, M. Kase, H. Kuboki, Y. Yano, S. Yokouchi and A. Hershcovitch: Phys. Rev. Spec. Top. Accel. Beams 14, 033503 (2011). 6) H. Imao, H. Okuno, H. Kuboki, S. Yokouchi, N. Fukunishi, O. Kamigaito, H. Hasebe, T. Watanabe, Y. Watanabe, M. Kase and Y. Yano: Phys. Rev. Spec. Top. Accel. Beams 15, 123501 (2012). 7) H. Imao et al.: “R&D of Helium Gas Stripper for Intense Uranium Beams,” in Proceedings of the Twentieth International Conference on Cyclotrons and their Applications (CYC2013), Vancouver, BC, Canada, September 2013, pp. 265–268. 8) H. Hasebe, H. Okuno, A. Tatami, M. Tachibana, M. Murakami, H. Kuboki, H. Imao, N. Fukunishi, M. Kase and O. Kamigaito: AIP Conf. Proc. 1962, 030004 (2018). 9) H. Hasebe, H. Okuno, A. Tatami, M. Tachibana, M. Murakami, H. Imao, N. Fukunishi, M. Kase and O. Kamigaito: EPJ Web of Conferences 229, 01004 (2020). 10) T. Nakagawa, M. Kidera, Y. Higurashi, J. Ohonishi, A. Goto and Y. Yano: Rev. Sci. Instrum. 79, 02A327 (2008). 11) Y. Higurashi, J. Ohnishi, K. Ozeki, M. Kidera and T. Nakagawa: Rev. Sci. Instrum. 85, 02A953 (2014). 12) 小山亮,内山暁仁,今尾浩士,渡邉環:RIBF にお けるシステム統合のためのガスストリッパー制御の 更新,PASJ2019, FRPH003 (2019). 13) H. Imao et al.: “Development of gas stripper at RIBF,” in Proceedings of the 9th International Particle Accelerator Conference (IPAC2018), Vancouver, BC, Canada, April 2018, pp. 41–46. 14) A. Akashio, K. Tanaka, H. Imao and Y. Uwamino: EPJ Web of Conferences 153, 01022 (2017). 15) H. Imao et al.: “Charge Stripper Ring for Cyclotron Cascade,” in Proceedings of the Twenty-first International Conference on Cyclotrons and their Applications (CYC2016), Zurich, Switzerland, September 2016, pp. 155–159. 16) H. Imao: JINST 15, P12036 (2020). 17) H. Kuboki, H. Okuno, A. Hershcovitch, T. Dantsuka, H. Hasebe, K. Ikegami, H. Imao, O. Kamigaito, M. Kase, T. Maie, T. Nakagawa and Y. Yano: J. Radioanal. Nucl. Chem. 299, 1029 (2014). 18) N. Ikoma, Y. Miyake, M. Takahashi, H. Okuno, S. Namba, K. Takahashi, T. Sasaki and T. Kikuchi: Rev. Sci. Instrum. 91, 053503 (2020). 19) H. Ryuto, H. Hasebe, N. Fukunishi, S. Yokouchi, A. Goto, M. Kase and Y. Yano: Nucl. Instrum. Methods Phys. Res. A 569, 697 (2006). 20) H. Hasebe, H. Okuno, H. Kuboki, H. Imao, N. Fukunishi, M. Kase and O. Kamigaito: J. Radioanal. Nucl. Chem. 305, 825 (2015). 21) Crystal Optics Inc.: http://www.crystal-opt.co.jp. 22) TANKEN SEAL SEIKO Co., LTD.: http://www.tanken seal.co.jp. 23) Kaneka Corporation: http://www.elecdiv.kaneka.co.jp. 24) H. Hasebe, H. Okuno, H. Imao, N. Fukunishi, M. Kase and O. Kamigaito: Proceedings of the 16th annual meeting of PASJ, p. 9 (2019). 25) A. Tatami, Y. Kawashima, M. Murakami, K. Murashima and M. Tachibana: Proceedings of the 14th annual meeting of PASJ, p. 159 (2017).
레이저 분말 베드 퓨전(L-PBF) 적층 제조(AM)는 우수한 기계적 특성으로 그물 모양에 가까운 복잡한 부품을 생산할 수 있습니다. 그러나 빌드 실패 및 다공성과 같은 결함으로 이어지는 원치 않는 잔류 응력 및 왜곡이 L-PBF의 광범위한 적용을 방해하고 있습니다.
L-PBF의 잠재력을 최대한 실현하기 위해 잔류 변형, 용융 풀 및 다공성 형성을 예측하는 다중 규모 모델링 방법론이 개발되었습니다. L-PBF의 잔류 변형 및 응력을 부품 규모에서 예측하기 위해 고유 변형 방법을 기반으로 하는 다중 규모 프로세스 모델링 프레임워크가 제안됩니다.
고유한 변형 벡터는 마이크로 스케일에서 충실도가 높은 상세한 다층 프로세스 시뮬레이션에서 추출됩니다. 균일하지만 이방성인 변형은 잔류 왜곡 및 응력을 예측하기 위해 준 정적 평형 유한 요소 분석(FEA)에서 레이어별로 L-PBF 부품에 적용됩니다.
부품 규모에서의 잔류 변형 및 응력 예측 외에도 분말 규모의 다중물리 모델링을 수행하여 공정 매개변수, 예열 온도 및 스패터링 입자에 의해 유도된 용융 풀 변동 및 결함 형성을 연구합니다. 이러한 요인과 관련된 용융 풀 역학 및 다공성 형성 메커니즘은 시뮬레이션 및 실험을 통해 밝혀졌습니다.
제안된 부품 규모 잔류 응력 및 왜곡 모델을 기반으로 경로 계획 방법은 큰 잔류 변형 및 건물 파손을 방지하기 위해 주어진 형상에 대한 레이저 스캐닝 경로를 조정하기 위해 개발되었습니다.
연속 및 아일랜드 스캐닝 전략을 위한 기울기 기반 경로 계획이 공식화되고 공식화된 컴플라이언스 및 스트레스 최소화 문제에 대한 전체 감도 분석이 수행됩니다. 이 제안된 경로 계획 방법의 타당성과 효율성은 AconityONE L-PBF 시스템을 사용하여 실험적으로 입증되었습니다.
또한 기계 학습을 활용한 데이터 기반 프레임워크를 개발하여 L-PBF에 대한 부품 규모의 열 이력을 예측합니다. 본 연구에서는 실시간 열 이력 예측을 위해 CNN(Convolutional Neural Network)과 RNN(Recurrent Neural Network)을 포함하는 순차적 기계 학습 모델을 제안합니다.
유한 요소 해석과 비교하여 100배의 예측 속도 향상이 달성되어 실제 제작 프로세스보다 빠른 예측이 가능하고 실시간 온도 프로파일을 사용할 수 있습니다.
Laser powder bed fusion (L-PBF) additive manufacturing (AM) is capable of producing complex parts near net shape with good mechanical properties. However, undesired residual stress and distortion that lead to build failure and defects such as porosity are preventing broader applications of L-PBF. To realize the full potential of L-PBF, a multiscale modeling methodology is developed to predict residual deformation, melt pool, and porosity formation. To predict the residual deformation and stress in L-PBF at part-scale, a multiscale process modeling framework based on inherent strain method is proposed.
Inherent strain vectors are extracted from detailed multi-layer process simulation with high fidelity at micro-scale. Uniform but anisotropic strains are then applied to L-PBF part in a layer-by-layer fashion in a quasi-static equilibrium finite element analysis (FEA) to predict residual distortion and stress. Besides residual distortion and stress prediction at part scale, multiphysics modeling at powder scale is performed to study the melt pool variation and defect formation induced by process parameters, preheating temperature and spattering particles. Melt pool dynamics and porosity formation mechanisms associated with these factors are revealed through simulation and experiments.
Based on the proposed part-scale residual stress and distortion model, path planning method is developed to tailor the laser scanning path for a given geometry to prevent large residual deformation and building failures. Gradient based path planning for continuous and island scanning strategy is formulated and full sensitivity analysis for the formulated compliance- and stress-minimization problem is performed.
The feasibility and effectiveness of this proposed path planning method is demonstrated experimentally using the AconityONE L-PBF system. In addition, a data-driven framework utilizing machine learning is developed to predict the thermal history at part-scale for L-PBF.
In this work, a sequential machine learning model including convolutional neural network (CNN) and recurrent neural network (RNN), long shortterm memory unit, is proposed for real-time thermal history prediction. A 100x prediction speed improvement is achieved compared to the finite element analysis which makes the prediction faster than real fabrication process and real-time temperature profile available.
Figure 1.1: Schematic Overview of Metal Laser Powder Bed Fusion Process [2]Figure 1.2: Commercial Powder Bed Fusion SystemsFigure 1.3: Commercial Metal Components Fabricated by Powder Bed Fusion Additive Manufacturing: (a) GE Fuel Nozzle; (b) Stryker Hip Biomedical Implant.Figure 2.1: Proposed Multiscale Process Simulation FrameworkFigure 2.2: (a) Experimental Setup for In-situ Thermocouple Measurement in the EOS M290 Build Chamber; (b) Themocouple Locations on the Bottom Side of the Substrate.Figure 2.3: (a) Finite Element Model for Single Layer Thermal Analysis; (b) Deposition LayerFigure 2.4: Core-skin layer: (a) Surface Morphology; (b) Scanning Strategy; (c) Transient Temperature Distribution and Temperature History at (d) Point 1; (e) Point 2 and (f) Point 3Figure 2.5: (a) Scanning Orientation of Each Layer; (b) Finite Element Model for Micro-scale Representative Volume Figure 2.6: Bottom Layer (a) Thermal History; (b) Plastic Strain and (c) Elastic Strain Evolution HistoryFigure 2.7: Bottom Layer Inherent Strain under Default Process Parameters along Horizontal Scanning PathFigure 2.8: Snapshots of the Element Activation ProcessFigure 2.9: Double Cantilever Beam Structure Built by the EOS M290 DMLM Process (a) Before and (b)
After Cutting off; (c) Faro Laser ScanArm V3 for Distortion MeasurementFigure 2.10: Square Canonical Structure Built by the EOS M290 DMLM ProcessFigure 2.11: Finite Element Mesh for the Square Canonical and Snapshots of Element Activation ProcessFigure 2.12: Simulated Distortion Field for the Double Cantilever Beam before Cutting off the Supports: (a) Inherent Strain Method; (b) Simufact Additive 3.1Figure 3.10: Snapshots of Temperature Profile for Single Track in Keyhole Regime (P = 250W and V = 0.5m/s) at the Preheating Temperature of 100 °Cs) at the Preheating Temperature of 500 °CFigure 3.15: Melt Pool Cross Section Comparison Between Simulation and Experiment for Single Track
Bibliography
[1] I. Astm, ASTM52900-15 Standard Terminology for Additive Manufacturing—General Principles—Terminology, ASTM International, West Conshohocken, PA 3(4) (2015) 5. [2] W.E. King, A.T. Anderson, R.M. Ferencz, N.E. Hodge, C. Kamath, S.A. Khairallah, A.M. Rubenchik, Laser powder bed fusion additive manufacturing of metals; physics, computational, and materials challenges, Applied Physics Reviews 2(4) (2015) 041304. [3] W. Yan, Y. Lu, K. Jones, Z. Yang, J. Fox, P. Witherell, G. Wagner, W.K. Liu, Data-driven characterization of thermal models for powder-bed-fusion additive manufacturing, Additive Manufacturing (2020) 101503. [4] K. Dai, L. Shaw, Thermal and stress modeling of multi-material laser processing, Acta Materialia 49(20) (2001) 4171-4181. [5] K. Dai, L. Shaw, Distortion minimization of laser-processed components through control of laser scanning patterns, Rapid Prototyping Journal 8(5) (2002) 270-276. [6] S.S. Bo Cheng, Kevin Chou, Stress and deformation evaluations of scanning strategy effect in selective laser melting, Additive Manufacturing (2017). [7] C. Fu, Y. Guo, Three-dimensional temperature gradient mechanism in selective laser melting of Ti-6Al-4V, Journal of Manufacturing Science and Engineering 136(6) (2014) 061004. [8] P. Prabhakar, W.J. Sames, R. Dehoff, S.S. Babu, Computational modeling of residual stress formation during the electron beam melting process for Inconel 718, Additive Manufacturing 7 (2015) 83-91. [9] A. Hussein, L. Hao, C. Yan, R. Everson, Finite element simulation of the temperature and stress fields in single layers built without-support in selective laser melting, Materials & Design (1980-2015) 52 (2013) 638-647. [10] P.Z. Qingcheng Yang, Lin Cheng, Zheng Min, Minking Chyu, Albert C. To, articleFinite element modeling and validation of thermomechanicalbehavior of Ti-6Al-4V in directed energy deposition additivemanufacturing, Additive Manufacturing (2016). [11] E.R. Denlinger, J. Irwin, P. Michaleris, Thermomechanical Modeling of Additive Manufacturing Large Parts, Journal of Manufacturing Science and Engineering 136(6) (2014) 061007. [12] E.R. Denlinger, M. Gouge, J. Irwin, P. Michaleris, Thermomechanical model development and in situ experimental validation of the Laser Powder-Bed Fusion process, Additive Manufacturing 16 (2017) 73-80. [13] V.J. Erik R Denlinger, G.V. Srinivasan, Tahany EI-Wardany, Pan Michaleris, Thermal modeling of Inconel 718 processed with powder bed fusionand experimental validation using in situ measurements, Additive Manufacturing 11 (2016) 7-15. [14] N. Patil, D. Pal, H.K. Rafi, K. Zeng, A. Moreland, A. Hicks, D. Beeler, B. Stucker, A Generalized Feed Forward Dynamic Adaptive Mesh Refinement and Derefinement Finite Element Framework for Metal Laser Sintering—Part I: Formulation and Algorithm Development, Journal of Manufacturing Science and Engineering 137(4) (2015) 041001. [15] D. Pal, N. Patil, K.H. Kutty, K. Zeng, A. Moreland, A. Hicks, D. Beeler, B. Stucker, A Generalized Feed-Forward Dynamic Adaptive Mesh Refinement and Derefinement FiniteElement Framework for Metal Laser Sintering—Part II: Nonlinear Thermal Simulations and Validations, Journal of Manufacturing Science and Engineering 138(6) (2016) 061003. [16] N. Keller, V. Ploshikhin, New method for fast predictions of residual stress and distortion of AM parts, Solid Freeform Fabrication Symposium, Austin, Texas, 2014, pp. 1229-1237. [17] S.A. Khairallah, A.T. Anderson, A. Rubenchik, W.E. King, Laser powder-bed fusion additive manufacturing: Physics of complex melt flow and formation mechanisms of pores, spatter, and denudation zones, Acta Materialia 108 (2016) 36-45. [18] M.J. Matthews, G. Guss, S.A. Khairallah, A.M. Rubenchik, P.J. Depond, W.E. King, Denudation of metal powder layers in laser powder bed fusion processes, Acta Materialia 114 (2016) 33-42. [19] A.A. Martin, N.P. Calta, S.A. Khairallah, J. Wang, P.J. Depond, A.Y. Fong, V. Thampy, G.M. Guss, A.M. Kiss, K.H. Stone, Dynamics of pore formation during laser powder bed fusion additive manufacturing, Nature communications 10(1) (2019) 1987. [20] R. Shi, S.A. Khairallah, T.T. Roehling, T.W. Heo, J.T. McKeown, M.J. Matthews, Microstructural control in metal laser powder bed fusion additive manufacturing using laser beam shaping strategy, Acta Materialia (2019). [21] S.A. Khairallah, A.A. Martin, J.R. Lee, G. Guss, N.P. Calta, J.A. Hammons, M.H. Nielsen, K. Chaput, E. Schwalbach, M.N. Shah, Controlling interdependent meso-nanosecond dynamics and defect generation in metal 3D printing, Science 368(6491) (2020) 660-665. [22] W. Yan, W. Ge, Y. Qian, S. Lin, B. Zhou, W.K. Liu, F. Lin, G.J. Wagner, Multi-physics modeling of single/multiple-track defect mechanisms in electron beam selective melting, Acta Materialia 134 (2017) 324-333. [23] S. Shrestha, Y. Kevin Chou, A Numerical Study on the Keyhole Formation During Laser Powder Bed Fusion Process, Journal of Manufacturing Science and Engineering 141(10) (2019). [24] S. Shrestha, B. Cheng, K. Chou, An Investigation into Melt Pool Effective Thermal Conductivity for Thermal Modeling of Powder-Bed Electron Beam Additive Manufacturing. [25] D. Rosenthal, Mathematical theory of heat distribution during welding and cutting, Welding journal 20 (1941) 220-234. [26] P. Promoppatum, S.-C. Yao, P.C. Pistorius, A.D. Rollett, A comprehensive comparison of the analytical and numerical prediction of the thermal history and solidification microstructure of Inconel 718 products made by laser powder-bed fusion, Engineering 3(5) (2017) 685-694. [27] M. Tang, P.C. Pistorius, J.L. Beuth, Prediction of lack-of-fusion porosity for powder bed fusion, Additive Manufacturing 14 (2017) 39-48. [28] T. Moran, P. Li, D. Warner, N. Phan, Utility of superposition-based finite element approach for part-scale thermal simulation in additive manufacturing, Additive Manufacturing 21 (2018) 215-219. [29] Y. Yang, M. Knol, F. van Keulen, C. Ayas, A semi-analytical thermal modelling approach for selective laser melting, Additive Manufacturing 21 (2018) 284-297. [30] B. Cheng, S. Shrestha, K. Chou, Stress and deformation evaluations of scanning strategy effect in selective laser melting, Additive Manufacturing 12 (2016) 240-251. [31] L.H. Ahmed Hussein, Chunze Yan, Richard Everson, Finite element simulation of the temperature and stress fields in single layers built without-support in selective laser melting, Materials and Design 52 (2013) 638-647. [32] H. Peng, D.B. Go, R. Billo, S. Gong, M.R. Shankar, B.A. Gatrell, J. Budzinski, P. Ostiguy, R. Attardo, C. Tomonto, Part-scale model for fast prediction of thermal distortion in DMLS additive manufacturing; Part 2: a quasi-static thermo-mechanical model, Austin, Texas (2016). [33] M.F. Zaeh, G. Branner, Investigations on residual stresses and deformations in selective laser melting, Production Engineering 4(1) (2010) 35-45. [34] C. Li, C. Fu, Y. Guo, F. Fang, A multiscale modeling approach for fast prediction of part distortion in selective laser melting, Journal of Materials Processing Technology 229 (2016) 703- 712. [35] C. Li, Z. Liu, X. Fang, Y. Guo, On the Simulation Scalability of Predicting Residual Stress and Distortion in Selective Laser Melting, Journal of Manufacturing Science and Engineering 140(4) (2018) 041013. [36] S. Afazov, W.A. Denmark, B.L. Toralles, A. Holloway, A. Yaghi, Distortion Prediction and Compensation in Selective Laser Melting, Additive Manufacturing 17 (2017) 15-22. [37] Y. Lee, W. Zhang, Modeling of heat transfer, fluid flow and solidification microstructure of nickel-base superalloy fabricated by laser powder bed fusion, Additive Manufacturing 12 (2016) 178-188. [38] L. Scime, J. Beuth, A multi-scale convolutional neural network for autonomous anomaly detection and classification in a laser powder bed fusion additive manufacturing process, Additive Manufacturing 24 (2018) 273-286. [39] L. Scime, J. Beuth, Using machine learning to identify in-situ melt pool signatures indicative of flaw formation in a laser powder bed fusion additive manufacturing process, Additive Manufacturing 25 (2019) 151-165. [40] X. Xie, J. Bennett, S. Saha, Y. Lu, J. Cao, W.K. Liu, Z. Gan, Mechanistic data-driven prediction of as-built mechanical properties in metal additive manufacturing, npj Computational Materials 7(1) (2021) 1-12. [41] C. Wang, X. Tan, S. Tor, C. Lim, Machine learning in additive manufacturing: State-of-theart and perspectives, Additive Manufacturing (2020) 101538. [42] J. Li, R. Jin, Z.Y. Hang, Integration of physically-based and data-driven approaches for thermal field prediction in additive manufacturing, Materials & Design 139 (2018) 473-485. [43] M. Mozaffar, A. Paul, R. Al-Bahrani, S. Wolff, A. Choudhary, A. Agrawal, K. Ehmann, J. Cao, Data-driven prediction of the high-dimensional thermal history in directed energy deposition processes via recurrent neural networks, Manufacturing letters 18 (2018) 35-39. [44] A. Paul, M. Mozaffar, Z. Yang, W.-k. Liao, A. Choudhary, J. Cao, A. Agrawal, A real-time iterative machine learning approach for temperature profile prediction in additive manufacturing processes, 2019 IEEE International Conference on Data Science and Advanced Analytics (DSAA), IEEE, 2019, pp. 541-550. [45] S. Clijsters, T. Craeghs, J.-P. Kruth, A priori process parameter adjustment for SLM process optimization, Innovative developments on virtual and physical prototyping, Taylor & Francis Group., 2012, pp. 553-560. [46] R. Mertens, S. Clijsters, K. Kempen, J.-P. Kruth, Optimization of scan strategies in selective laser melting of aluminum parts with downfacing areas, Journal of Manufacturing Science and Engineering 136(6) (2014) 061012. [47] J.-P. Kruth, J. Deckers, E. Yasa, R. Wauthlé, Assessing and comparing influencing factors of residual stresses in selective laser melting using a novel analysis method, Proceedings of the institution of mechanical engineers, Part B: Journal of Engineering Manufacture 226(6) (2012) 980-991. [48] Y. Lu, S. Wu, Y. Gan, T. Huang, C. Yang, L. Junjie, J. Lin, Study on the microstructure, mechanical property and residual stress of SLM Inconel-718 alloy manufactured by differing island scanning strategy, Optics & Laser Technology 75 (2015) 197-206. [49] E. Foroozmehr, R. Kovacevic, Effect of path planning on the laser powder deposition process: thermal and structural evaluation, The International Journal of Advanced Manufacturing Technology 51(5-8) (2010) 659-669. [50] L.H. Ahmed Hussein, Chunze Yan, Richard Everson, Finite element simulation of the temperature and stress fields in single layers built without-support in selective laser melting, Materials and Design (2013). [51] J.-P. Kruth, M. Badrossamay, E. Yasa, J. Deckers, L. Thijs, J. Van Humbeeck, Part and material properties in selective laser melting of metals, Proceedings of the 16th international symposium on electromachining, 2010, pp. 1-12. [52] L. Thijs, K. Kempen, J.-P. Kruth, J. Van Humbeeck, Fine-structured aluminium products with controllable texture by selective laser melting of pre-alloyed AlSi10Mg powder, Acta Materialia 61(5) (2013) 1809-1819. [53] D. Ding, Z.S. Pan, D. Cuiuri, H. Li, A tool-path generation strategy for wire and arc additive manufacturing, The international journal of advanced manufacturing technology 73(1-4) (2014) 173-183. [54] B.E. Carroll, T.A. Palmer, A.M. Beese, Anisotropic tensile behavior of Ti–6Al–4V components fabricated with directed energy deposition additive manufacturing, Acta Materialia 87 (2015) 309-320. [55] D. Ding, Z. Pan, D. Cuiuri, H. Li, A practical path planning methodology for wire and arc additive manufacturing of thin-walled structures, Robotics and Computer-Integrated Manufacturing 34 (2015) 8-19. [56] D. Ding, Z. Pan, D. Cuiuri, H. Li, S. van Duin, N. Larkin, Bead modelling and implementation of adaptive MAT path in wire and arc additive manufacturing, Robotics and Computer-Integrated Manufacturing 39 (2016) 32-42. [57] R. Ponche, O. Kerbrat, P. Mognol, J.-Y. Hascoet, A novel methodology of design for Additive Manufacturing applied to Additive Laser Manufacturing process, Robotics and ComputerIntegrated Manufacturing 30(4) (2014) 389-398. [58] D.E. Smith, R. Hoglund, Continuous fiber angle topology optimization for polymer fused fillament fabrication, Annu. Int. Solid Free. Fabr. Symp. Austin, TX, 2016. [59] J. Liu, J. Liu, H. Yu, H. Yu, Concurrent deposition path planning and structural topology optimization for additive manufacturing, Rapid Prototyping Journal 23(5) (2017) 930-942. [60] Q. Xia, T. Shi, Optimization of composite structures with continuous spatial variation of fiber angle through Shepard interpolation, Composite Structures 182 (2017) 273-282. [61] C. Kiyono, E. Silva, J. Reddy, A novel fiber optimization method based on normal distribution function with continuously varying fiber path, Composite Structures 160 (2017) 503-515. [62] C.J. Brampton, K.C. Wu, H.A. Kim, New optimization method for steered fiber composites using the level set method, Structural and Multidisciplinary Optimization 52(3) (2015) 493-505. [63] J. Liu, A.C. To, Deposition path planning-integrated structural topology optimization for 3D additive manufacturing subject to self-support constraint, Computer-Aided Design 91 (2017) 27- 45. [64] H. Shen, J. Fu, Z. Chen, Y. Fan, Generation of offset surface for tool path in NC machining through level set methods, The International Journal of Advanced Manufacturing Technology 46(9-12) (2010) 1043-1047. [65] C. Zhuang, Z. Xiong, H. Ding, High speed machining tool path generation for pockets using level sets, International Journal of Production Research 48(19) (2010) 5749-5766. [66] K.C. Mills, Recommended values of thermophysical properties for selected commercial alloys, Woodhead Publishing2002. [67] S.S. Sih, J.W. Barlow, The prediction of the emissivity and thermal conductivity of powder beds, Particulate Science and Technology 22(4) (2004) 427-440. [68] L. Dong, A. Makradi, S. Ahzi, Y. Remond, Three-dimensional transient finite element analysis of the selective laser sintering process, Journal of materials processing technology 209(2) (2009) 700-706. [69] J.J. Beaman, J.W. Barlow, D.L. Bourell, R.H. Crawford, H.L. Marcus, K.P. McAlea, Solid freeform fabrication: a new direction in manufacturing, Kluwer Academic Publishers, Norwell, MA 2061 (1997) 25-49. [70] G. Bugeda Miguel Cervera, G. Lombera, Numerical prediction of temperature and density distributions in selective laser sintering processes, Rapid Prototyping Journal 5(1) (1999) 21-26. [71] T. Mukherjee, W. Zhang, T. DebRoy, An improved prediction of residual stresses and distortion in additive manufacturing, Computational Materials Science 126 (2017) 360-372. [72] A.J. Dunbar, E.R. Denlinger, M.F. Gouge, P. Michaleris, Experimental validation of finite element modeling for laser powderbed fusion deformation, Additive Manufacturing 12 (2016) 108-120. [73] J. Goldak, A. Chakravarti, M. Bibby, A new finite element model for welding heat sources, Metallurgical and Materials Transactions B 15(2) (1984) 299-305. [74] J. Liu, Q. Chen, Y. Zhao, W. Xiong, A. To, Quantitative Texture Prediction of Epitaxial Columnar Grains in Alloy 718 Processed by Additive Manufacturing, Proceedings of the 9th International Symposium on Superalloy 718 & Derivatives: Energy, Aerospace, and Industrial Applications, Springer, 2018, pp. 749-755. [75] J. Irwin, P. Michaleris, A line heat input model for additive manufacturing, Journal of Manufacturing Science and Engineering 138(11) (2016) 111004. [76] M. Gouge, J. Heigel, P. Michaleris, T. Palmer, Modeling forced convection in the thermal simulation of laser cladding processes, International Journal of Advanced Manufacturing Technology 79 (2015). [77] J. Heigel, P. Michaleris, E. Reutzel, Thermo-mechanical model development and validation of directed energy deposition additive manufacturing of Ti–6Al–4V, Additive manufacturing 5 (2015) 9-19. [78] E.R. Denlinger, J.C. Heigel, P. Michaleris, Residual stress and distortion modeling of electron beam direct manufacturing Ti-6Al-4V, Proceedings of the Institution of Mechanical Engineers, Part B: Journal of Engineering Manufacture 229(10) (2015) 1803-1813. [79] X. Liang, Q. Chen, L. Cheng, Q. Yang, A. To, A modified inherent strain method for fast prediction of residual deformation in additive manufacturing of metal parts, 2017 Solid Freeform Fabrication Symposium Proceedings, Austin, Texas, 2017. [80] X. Liang, L. Cheng, Q. Chen, Q. Yang, A. To, A Modified Method for Estimating Inherent Strains from Detailed Process Simulation for Fast Residual Distortion Prediction of Single-Walled Structures Fabricated by Directed Energy Deposition, Additive Manufacturing 23 (2018) 471-486. [81] L. Sochalski-Kolbus, E.A. Payzant, P.A. Cornwell, T.R. Watkins, S.S. Babu, R.R. Dehoff, M. Lorenz, O. Ovchinnikova, C. Duty, Comparison of residual stresses in Inconel 718 simple parts made by electron beam melting and direct laser metal sintering, Metallurgical and Materials Transactions A 46(3) (2015) 1419-1432. [82] P. Mercelis, J.-P. Kruth, Residual stresses in selective laser sintering and selective laser melting, Rapid Prototyping Journal 12(5) (2006) 254-265. [83] N. Hodge, R. Ferencz, J. Solberg, Implementation of a thermomechanical model for the simulation of selective laser melting, Computational Mechanics 54(1) (2014) 33-51. [84] A.S. Wu, D.W. Brown, M. Kumar, G.F. Gallegos, W.E. King, An experimental investigation into additive manufacturing-induced residual stresses in 316L stainless steel, Metallurgical and Materials Transactions A 45(13) (2014) 6260-6270. [85] C. Li, J. liu, Y. Guo, Efficient predictive model of part distortion and residual stress in selective laser melting, Solid Freeform Fabrication 2016, 2017. [86] Y. Zhao, Y. Koizumi, K. Aoyagi, D. Wei, K. Yamanaka, A. Chiba, Molten pool behavior and effect of fluid flow on solidification conditions in selective electron beam melting (SEBM) of a biomedical Co-Cr-Mo alloy, Additive Manufacturing 26 (2019) 202-214. [87] J.-H. Cho, S.-J. Na, Implementation of real-time multiple reflection and Fresnel absorption of laser beam in keyhole, Journal of Physics D: Applied Physics 39(24) (2006) 5372. [88] Q. Guo, C. Zhao, M. Qu, L. Xiong, L.I. Escano, S.M.H. Hojjatzadeh, N.D. Parab, K. Fezzaa, W. Everhart, T. Sun, In-situ characterization and quantification of melt pool variation under constant input energy density in laser powder-bed fusion additive manufacturing process, Additive Manufacturing (2019). [89] E. Assuncao, S. Williams, D. Yapp, Interaction time and beam diameter effects on the conduction mode limit, Optics and Lasers in Engineering 50(6) (2012) 823-828. [90] R. Cunningham, C. Zhao, N. Parab, C. Kantzos, J. Pauza, K. Fezzaa, T. Sun, A.D. Rollett, Keyhole threshold and morphology in laser melting revealed by ultrahigh-speed x-ray imaging, Science 363(6429) (2019) 849-852. [91] W. Tan, N.S. Bailey, Y.C. Shin, Investigation of keyhole plume and molten pool based on a three-dimensional dynamic model with sharp interface formulation, Journal of Physics D: Applied Physics 46(5) (2013) 055501. [92] W. Tan, Y.C. Shin, Analysis of multi-phase interaction and its effects on keyhole dynamics with a multi-physics numerical model, Journal of Physics D: Applied Physics 47(34) (2014) 345501. [93] R. Fabbro, K. Chouf, Keyhole modeling during laser welding, Journal of applied Physics 87(9) (2000) 4075-4083. [94] Q. Guo, C. Zhao, M. Qu, L. Xiong, S.M.H. Hojjatzadeh, L.I. Escano, N.D. Parab, K. Fezzaa, T. Sun, L. Chen, In-situ full-field mapping of melt flow dynamics in laser metal additive manufacturing, Additive Manufacturing 31 (2020) 100939. [95] Y. Ueda, K. Fukuda, K. Nakacho, S. Endo, A new measuring method of residual stresses with the aid of finite element method and reliability of estimated values, Journal of the Society of Naval Architects of Japan 1975(138) (1975) 499-507. [96] M.R. Hill, D.V. Nelson, The inherent strain method for residual stress determination and its application to a long welded joint, ASME-PUBLICATIONS-PVP 318 (1995) 343-352. [97] H. Murakawa, Y. Luo, Y. Ueda, Prediction of welding deformation and residual stress by elastic FEM based on inherent strain, Journal of the society of Naval Architects of Japan 1996(180) (1996) 739-751. [98] M. Yuan, Y. Ueda, Prediction of residual stresses in welded T-and I-joints using inherent strains, Journal of Engineering Materials and Technology, Transactions of the ASME 118(2) (1996) 229-234. [99] L. Zhang, P. Michaleris, P. Marugabandhu, Evaluation of applied plastic strain methods for welding distortion prediction, Journal of Manufacturing Science and Engineering 129(6) (2007) 1000-1010. [100] M. Bugatti, Q. Semeraro, Limitations of the Inherent Strain Method in Simulating Powder Bed Fusion Processes, Additive Manufacturing 23 (2018) 329-346. [101] L. Cheng, X. Liang, J. Bai, Q. Chen, J. Lemon, A. To, On Utilizing Topology Optimization to Design Support Structure to Prevent Residual Stress Induced Build Failure in Laser Powder Bed Metal Additive Manufacturing, Additive Manufacturing (2019). [102] Q. Chen, X. Liang, D. Hayduke, J. Liu, L. Cheng, J. Oskin, R. Whitmore, A.C. To, An inherent strain based multiscale modeling framework for simulating part-scale residual deformation for direct metal laser sintering, Additive Manufacturing 28 (2019) 406-418. [103] S. Osher, J.A. Sethian, Fronts propagating with curvature-dependent speed: algorithms based on Hamilton-Jacobi formulations, Journal of computational physics 79(1) (1988) 12-49. [104] M.Y. Wang, X. Wang, D. Guo, A level set method for structural topology optimization, Computer methods in applied mechanics and engineering 192(1) (2003) 227-246. [105] G. Allaire, F. Jouve, A.-M. Toader, Structural optimization using sensitivity analysis and a level-set method, Journal of computational physics 194(1) (2004) 363-393. [106] Y. Wang, Z. Luo, Z. Kang, N. Zhang, A multi-material level set-based topology and shape optimization method, Computer Methods in Applied Mechanics and Engineering 283 (2015) 1570-1586. [107] P. Dunning, C. Brampton, H. Kim, Simultaneous optimisation of structural topology and material grading using level set method, Materials Science and Technology 31(8) (2015) 884-894. [108] P. Liu, Y. Luo, Z. Kang, Multi-material topology optimization considering interface behavior via XFEM and level set method, Computer methods in applied mechanics and engineering 308 (2016) 113-133. [109] J. Liu, Q. Chen, Y. Zheng, R. Ahmad, J. Tang, Y. Ma, Level set-based heterogeneous object modeling and optimization, Computer-Aided Design (2019). [110] J. Liu, Q. Chen, X. Liang, A.C. To, Manufacturing cost constrained topology optimization for additive manufacturing, Frontiers of Mechanical Engineering 14(2) (2019) 213-221. [111] Z. Kang, Y. Wang, Integrated topology optimization with embedded movable holes based on combined description by material density and level sets, Computer methods in applied mechanics and engineering 255 (2013) 1-13. [112] P.D. Dunning, H. Alicia Kim, A new hole insertion method for level set based structural topology optimization, International Journal for Numerical Methods in Engineering 93(1) (2013) 118-134. [113] J.A. Sethian, A fast marching level set method for monotonically advancing fronts, Proceedings of the National Academy of Sciences 93(4) (1996) 1591-1595. [114] J.A. Sethian, Level set methods and fast marching methods: evolving interfaces in computational geometry, fluid mechanics, computer vision, and materials science, Cambridge university press1999. [115] C. Le, J. Norato, T. Bruns, C. Ha, D. Tortorelli, Stress-based topology optimization for continua, Structural and Multidisciplinary Optimization 41(4) (2010) 605-620. [116] A. Takezawa, G.H. Yoon, S.H. Jeong, M. Kobashi, M. Kitamura, Structural topology optimization with strength and heat conduction constraints, Computer Methods in Applied Mechanics and Engineering 276 (2014) 341-361. [117] S. Hochreiter, J. Schmidhuber, Long short-term memory, Neural computation 9(8) (1997) 1735-1780. [118] A. Krizhevsky, I. Sutskever, G.E. Hinton, Imagenet classification with deep convolutional neural networks, Advances in neural information processing systems 25 (2012) 1097-1105. [119] K. Simonyan, A. Zisserman, Very deep convolutional networks for large-scale image recognition, arXiv preprint arXiv:1409.1556 (2014). [120] K. He, X. Zhang, S. Ren, J. Sun, Deep residual learning for image recognition, Proceedings of the IEEE conference on computer vision and pattern recognition, 2016, pp. 770-778. [121] O. Russakovsky, J. Deng, H. Su, J. Krause, S. Satheesh, S. Ma, Z. Huang, A. Karpathy, A. Khosla, M. Bernstein, Imagenet large scale visual recognition challenge, International journal of computer vision 115(3) (2015) 211-252. [122] S. Ren, K. He, R. Girshick, J. Sun, Faster r-cnn: Towards real-time object detection with region proposal networks, Advances in neural information processing systems 28 (2015) 91-99. [123] E.J. Schwalbach, S.P. Donegan, M.G. Chapman, K.J. Chaput, M.A. Groeber, A discrete source model of powder bed fusion additive manufacturing thermal history, Additive Manufacturing 25 (2019) 485-498. [124] D.G. Duffy, Green’s functions with applications, Chapman and Hall/CRC2015. [125] J. Martínez-Frutos, D. Herrero-Pérez, Efficient matrix-free GPU implementation of fixed grid finite element analysis, Finite Elements in Analysis and Design 104 (2015) 61-71. [126] F. Dugast, P. Apostolou, A. Fernandez, W. Dong, Q. Chen, S. Strayer, R. Wicker, A.C. To, Part-scale thermal process modeling for laser powder bed fusion with matrix-free method and GPU computing, Additive Manufacturing 37 (2021) 101732. [127] A. Vaswani, N. Shazeer, N. Parmar, J. Uszkoreit, L. Jones, A.N. Gomez, Ł. Kaiser, I. Polosukhin, Attention is all you need, Advances in neural information processing systems, 2017, pp. 5998-6008. [128] J. Devlin, M.-W. Chang, K. Lee, K. Toutanova, Bert: Pre-training of deep bidirectional transformers for language understanding, arXiv preprint arXiv:1810.04805 (2018).
곡면에서 GMAW 기반 적층 가공의 용접 성형 특성은 중력의 영향을 크게 받습니다. 성형면의 경사각이 크면 혹 비드(hump bead)와 같은 심각한 결함이 발생합니다.
본 논문에서는 양생면에서 용접 비드 형성의 형성 특성과 제어 방법을 연구하기 위해 용접 용융 풀 유동 역학의 전산 모델을 수립하고 제안된 모델을 검증하기 위해 증착 실험을 수행하였습니다.
결과는 용접 비드 경사각(α)이 증가함에 따라 역류의 속도가 증가하고 상향 용접의 경우 α > 60°일 때 불규칙한 험프 결함이 나타나는 것으로 나타났습니다.
상부 과잉 액체의 하향 압착력과 하부 상향 유동의 반동력과 표면장력 사이의 상호작용은 용접 혹 형성의 주요 요인이었다. 하향 용접의 경우 양호한 형태를 얻을 수 있었으며, 용접 비드 경사각이 증가함에 따라 용접 높이는 감소하고 용접 폭은 증가하였습니다.
하향 및 상향 용접을 위한 곡면의 용융 거동 및 성형 특성을 기반으로 험프 결함을 제어하기 위해 위브 용접을 통한 증착 방법을 제안하였습니다.
성형 궤적의 변화로 인해 용접 방향의 중력 성분이 크게 감소하여 용융 풀 흐름의 안정성이 향상되었으며 복잡한 표면에서 안정적이고 일관된 용접 비드를 얻는 데 유리했습니다.
하향 용접과 상향 용접 사이의 단일 비드의 치수 편차는 7% 이내였으며 하향 및 상향 혼합 혼합 비드 중첩 증착에서 비드의 변동 편차는 0.45로 GMAW 기반 적층 제조 공정에서 허용될 수 있었습니다.
이러한 발견은 GMAW를 기반으로 하는 곡선 적층 적층 제조의 용접 비드 형성 제어에 기여했습니다.
The weld forming characteristics of GMAW-based additive manufacturing on curved surface are dramatically influenced by gravity. Large inclined angle of the forming surface would lead to severe defects such as hump bead. In this paper, a computational model of welding molten pool flow dynamics was established to research the forming characteristic and control method of weld bead forming on cured surface, and deposition experiments were conducted to verify the proposed model. Results indicated that the velocity of backward flows increased with the increase of weld bead tilt angle (α) and irregular hump defects appeared when α > 60° for upward welding. The interaction between the downward squeezing force of the excess liquid at the top and the recoil force of the upward flow at the bottom and the surface tension were primary factors for welding hump formation. For downward welding, a good morphology shape could be obtained, and the weld height decreased and the weld width increased with the increase of weld bead tilt angle. Based on the molten behaviors and forming characteristics on curved surface for downward and upward welding, the method of deposition with weave welding was proposed to control hump defects. Gravity component in the welding direction was significantly reduced due to the change of forming trajectory, which improved the stability of the molten pool flow and was beneficial to obtain stable and consistent weld bead on complex surface. The dimensional deviations of the single bead between downward and upward welding were within 7% and the fluctuation deviation of the bead in multi-bead overlapping deposition with mixing downward and upward welding was 0.45, which could be acceptable in GMAW-based additive manufacturing process. These findings contributed to the weld bead forming control of curve layered additive manufacturing based on GMAW.
7.Xie FB, Chen LF, Li ZY, Tang K (2020) Path smoothing and feed rate planning for robotic curved layer additive manufacturing. Robot Comput Integr Manuf 65. https://doi.org/10.1016/j.rcim.2020.101967
8.Ding YY, Dwivedi R, Kovacevic R (2017) Process planning for 8-axis robotized laser-based direct metal deposition system: a case on building revolved part. Robot Comput Integr Manuf 44:67–76. https://doi.org/10.1016/j.rcim.2016.08.008ArticleGoogle Scholar
12.Yuan L, Pan ZX, Ding DH, He FY, Duin SV, Li HJ, Li WH (2020) Investigation of humping phenomenon for the multi-directional robotic wire and arc additive manufacturing. Robot Comput Integr Manuf 63. https://doi.org/10.1016/j.rcim.2019.101916
13.Nguyen MC, Medale M, Asserin O, Gounand S, Gilles P (2017) Sensitivity to welding positions and parameters in GTA welding with a 3D multiphysics numerical model. Numer Heat Transf Part A Appl 71:233–249. https://doi.org/10.1080/10407782.2016.1264747ArticleGoogle Scholar
17.Philip Y, Xu ZY, Wang Y, Wang R, Ye X (2019) Investigation of humping defect formation in a lap joint at a high-speed hybrid laser-GMA welding. Results Phys 13. https://doi.org/10.1016/j.rinp.2019.102341
18.Hu ZQ, Qin XP, Shao T, Liu HM (2018) Understanding and overcoming of abnormity at start and end of the weld bead in additive manufacturing with GMAW. Int J Adv Manuf Technol 95:2357–2368. https://doi.org/10.1007/s00170-017-1392-9ArticleGoogle Scholar
19.Tang SY, Wang GL, Huang C, Li RS, Zhou SY, Zhang HO (2020) Investigation, modeling and optimization of abnormal areas of weld beads in wire and arc additive manufacturing. Rapid Prototyp J 26:1183–1195. https://doi.org/10.1108/RPJ-08-2019-0229ArticleGoogle Scholar
20.Bai X, Colegrove P, Ding J, Zhou XM, Diao CL, Bridgeman P, Honnige JR, Zhang HO, Williams S (2018) Numerical analysis of heat transfer and fluid flow in multilayer deposition of PAW-based wire and arc additive manufacturing. Int J Heat Mass Transf 124:504–516. https://doi.org/10.1016/j.ijheatmasstransfer.2018.03.085ArticleGoogle Scholar
21.Siewert E, Schein J, Forster G (2013) Determination of enthalpy, temperature, surface tension and geometry of the material transfer in PGMAW for the system argon-iron. J Phys D Appl Phys 46. https://doi.org/10.1088/0022-3727/46/22/224008
23.Fachinotti VD, Cardona A (2008) Semi-analytical solution of the thermal field induced by a moving double-ellipsoidal welding heat source in a semi-infinite body. Mec Comput XXVII:1519–1530
24.Nguyen NT, Mai YW, Simpson S, Ohta A (2004) Analytical approximate solution for double ellipsoidal heat source in finite thick plate. Weld J 83:82–93Google Scholar
25.Goldak J, Chakravarti A, Bibby M (1985) A double ellipsoid finite element model for welding heat sources. IIW Doc. No. 212-603-85
29.Zhan XH, Zhang D, Liu XB, Chen J, Wei YH, Liu RP (2017) Comparison between weave bead welding and multi-layer multi-pass welding for thick plate Invar steel. Int J Adv Manuf Technol 88:2211–2225. https://doi.org/10.1007/s00170-016-8926-4ArticleGoogle Scholar
30.Xu GX, Li L, Wang JY, Zhu J, Li PF (2018) Study of weld formation in swing arc narrow gap vertical GMA welding by numerical modeling and experiment. Int J Adv Manuf Technol 96:1905–1917. https://doi.org/10.1007/s00170-018-1729-zArticleGoogle Scholar
Keyhole Formation by Laser Drilling in Laser Powder Bed Fusion of Ti6Al4V Biomedical Alloy: Mesoscopic Computational Fluid Dynamics Simulation versus Mathematical Modelling Using Empirical Validation
Asif Ur Rehman 1,2,3,* ,† , Muhammad Arif Mahmood 4,* ,† , Fatih Pitir 1 , Metin Uymaz Salamci 2,3 , Andrei C. Popescu 4 and Ion N. Mihailescu 4
Abstract
LPBF(Laser Powder Bed fusion) 공정에서 작동 조건은 열 분포를 기반으로 레이저 유도 키홀 영역을 결정하는 데 필수적입니다. 얕은 구멍과 깊은 구멍으로 분류되는 이러한 영역은 LPBF 프로세스에서 확률과 결함 형성 강도를 제어합니다.
LPBF 프로세스의 핵심 구멍을 연구하고 제어하기 위해 수학적 및 CFD(전산 유체 역학) 모델이 제공됩니다. CFD의 경우 이산 요소 모델링 기법을 사용한 유체 체적 방법이 사용되었으며, 분말 베드 보이드 및 표면에 의한 레이저 빔 흡수를 포함하여 수학적 모델이 개발되었습니다.
동적 용융 풀 거동을 자세히 살펴봅니다. 실험적, CFD 시뮬레이션 및 분석적 컴퓨팅 결과 간에 정량적 비교가 수행되어 좋은 일치를 얻습니다.
LPBF에서 레이저 조사 영역 주변의 온도는 높은 내열성과 분말 입자 사이의 공기로 인해 분말층 주변에 비해 급격히 상승하여 레이저 횡방향 열파의 이동이 느려집니다. LPBF에서 키홀은 에너지 밀도에 의해 제어되는 얕고 깊은 키홀 모드로 분류될 수 있습니다. 에너지 밀도를 높이면 얕은 키홀 구멍 모드가 깊은 키홀 구멍 모드로 바뀝니다.
깊은 키홀 구멍의 에너지 밀도는 다중 반사와 키홀 구멍 내의 2차 반사 빔의 집중으로 인해 더 높아져 재료가 빠르게 기화됩니다.
깊은 키홀 구멍 모드에서는 온도 분포가 높기 때문에 액체 재료가 기화 온도에 가까우므로 얕은 키홀 구멍보다 구멍이 형성될 확률이 훨씬 높습니다. 온도가 급격히 상승하면 재료 밀도가 급격히 떨어지므로 비열과 융해 잠열로 인해 유체 부피가 증가합니다.
그 대가로 표면 장력을 낮추고 용융 풀 균일성에 영향을 미칩니다.
In the laser powder bed fusion (LPBF) process, the operating conditions are essential in determining laser-induced keyhole regimes based on the thermal distribution. These regimes, classified into shallow and deep keyholes, control the probability and defects formation intensity in the LPBF process. To study and control the keyhole in the LPBF process, mathematical and computational fluid dynamics (CFD) models are presented. For CFD, the volume of fluid method with the discrete element modeling technique was used, while a mathematical model was developed by including the laser beam absorption by the powder bed voids and surface. The dynamic melt pool behavior is explored in detail. Quantitative comparisons are made among experimental, CFD simulation and analytical computing results leading to a good correspondence. In LPBF, the temperature around the laser irradiation zone rises rapidly compared to the surroundings in the powder layer due to the high thermal resistance and the air between the powder particles, resulting in a slow travel of laser transverse heat waves. In LPBF, the keyhole can be classified into shallow and deep keyhole mode, controlled by the energy density. Increasing the energy density, the shallow keyhole mode transforms into the deep keyhole mode. The energy density in a deep keyhole is higher due to the multiple reflections and concentrations of secondary reflected beams within the keyhole, causing the material to vaporize quickly. Due to an elevated temperature distribution in deep keyhole mode, the probability of pores forming is much higher than in a shallow keyhole as the liquid material is close to the vaporization temperature. When the temperature increases rapidly, the material density drops quickly, thus, raising the fluid volume due to the specific heat and fusion latent heat. In return, this lowers the surface tension and affects the melt pool uniformity.
Keywords: laser powder bed fusion; computational fluid dynamics; analytical modelling; shallow and deep keyhole modes; experimental correlation
Figure 1. Powder bed schematic with voids.Figure 2. (a) Scanning electron microscopy images of Ti6Al4V powder particles and (b) simulated powder bed using
discrete element modellingFigure 3. Temperature field contour formation at various time intervals (a) 0.695 ms, (b) 0.795 ms,
(c) 0.995 ms and (d) 1.3 ms.Figure 4. Detailed view of shallow depth melt mode with temperature field at 0.695 msFigure 5. Melt flow stream traces formation at various time intervals (a) 0.695 ms, (b) 0.795 ms,
(c) 0.995 ms and (d) 1.3 msFigure 6. Density evolution of the melt pool at various time intervals (a) 0.695 ms, (b) 0.795 ms,
(c) 0.995 ms and (d) 1.3 ms.
Figure 7. Un-melted and melted regions at different time intervals (a) 0.695 ms, (b) 0.795 ms,
(c) 0.995 ms and (d) 1.3 msFigure 8. Transformation from shallow depth melt flow to deep keyhole formation when laser power increased from
(a) 170 W to (b) 200 WFigure 9. Stream traces and laser beam multiple reflections in deep keyhole melt flow modeFigure 10. A comparison between analytical and CFD simulation results for peak thermal distribution value in the deep
keyhole formationFigure 11. A comparison among experiments [49], CFD and analytical simulations for deep keyhole
top width and bottom width
References
Kok, Y.; Tan, X.P.; Wang, P.; Nai, M.L.S.; Loh, N.H.; Liu, E.; Tor, S.B. Anisotropy and heterogeneity of microstructure and mechanical properties in metal additive manufacturing: A critical review. Mater. Des. 2018, 139, 565–586. [CrossRef]
Ansari, P.; Salamci, M.U. On the selective laser melting based additive manufacturing of AlSi10Mg: The process parameter investigation through multiphysics simulation and experimental validation. J. Alloys Compd. 2022, 890, 161873. [CrossRef]
Guo, N.; Leu, M.C. Additive manufacturing: Technology, applications and research needs. Front. Mech. Eng. 2013, 8, 215–243. [CrossRef]
Mohsin Raza, M.; Lo, Y.L. Experimental investigation into microstructure, mechanical properties, and cracking mechanism of IN713LC processed by laser powder bed fusion. Mater. Sci. Eng. A 2021, 819, 141527. [CrossRef]
Dezfoli, A.R.A.; Lo, Y.L.; Raza, M.M. Prediction of Epitaxial Grain Growth in Single-Track Laser Melting of IN718 Using Integrated Finite Element and Cellular Automaton Approach. Materials 2021, 14, 5202. [CrossRef]
Tiwari, S.K.; Pande, S.; Agrawal, S.; Bobade, S.M. Selection of selective laser sintering materials for different applications. Rapid Prototyp. J. 2015, 21, 630–648. [CrossRef]
Liu, F.H. Synthesis of bioceramic scaffolds for bone tissue engineering by rapid prototyping technique. J. Sol-Gel Sci. Technol. 2012, 64, 704–710. [CrossRef]
Ur Rehman, A.; Sglavo, V.M. 3D printing of geopolymer-based concrete for building applications. Rapid Prototyp. J. 2020, 26, 1783–1788. [CrossRef]
Ur Rehman, A.; Sglavo, V.M. 3D printing of Portland cement-containing bodies. Rapid Prototyp. J. 2021. ahead of print. [CrossRef]
Popovich, A.; Sufiiarov, V. Metal Powder Additive Manufacturing. In New Trends in 3D Printing; InTech: Rijeka, Croatia, 2016.
Jia, T.; Zhang, Y.; Chen, J.K.; He, Y.L. Dynamic simulation of granular packing of fine cohesive particles with different size distributions. Powder Technol. 2012, 218, 76–85. [CrossRef]
Ansari, P.; Ur Rehman, A.; Pitir, F.; Veziroglu, S.; Mishra, Y.K.; Aktas, O.C.; Salamci, M.U. Selective Laser Melting of 316L Austenitic Stainless Steel: Detailed Process Understanding Using Multiphysics Simulation and Experimentation. Metals 2021, 11, 1076. [CrossRef]
Ur Rehman, A.; Tingting, L.; Liao, W. 4D Printing; Printing Ceramics from Metals with Selective Oxidation. Patent No. W0/2019/052128, 21 March 2019.
Ullah, A.; Wu, H.; Ur Rehman, A.; Zhu, Y.; Liu, T.; Zhang, K. Influence of laser parameters and Ti content on the surface morphology of L-PBF fabricated Titania. Rapid Prototyp. J. 2021, 27, 71–80. [CrossRef]
Ur Rehman, A. Additive Manufacturing of Ceramic Materials and Combinations with New Laser Strategies. Master’s Thesis, Nanjing University of Science and Technology, Nanjing, China, 2017.
Wong, K.V.; Hernandez, A. A Review of Additive Manufacturing. ISRN Mech. Eng. 2012, 2012, 1–10. [CrossRef]
Körner, C. Additive manufacturing of metallic components by selective electron beam melting—A review. Int. Mater. Rev. 2016, 61, 361–377. [CrossRef]
Fayazfar, H.; Salarian, M.; Rogalsky, A.; Sarker, D.; Russo, P.; Paserin, V.; Toyserkani, E. A critical review of powder-based additive manufacturing of ferrous alloys: Process parameters, microstructure and mechanical properties. Mater. Des. 2018, 144, 98–128. [CrossRef]
Everton, S.K.; Hirsch, M.; Stavroulakis, P.I.; Leach, R.K.; Clare, A.T. Review of in-situ process monitoring and in-situ metrology for metal additive manufacturing. Mater. Des. 2016, 95, 431–445. [CrossRef]
Sing, S.L.; An, J.; Yeong, W.Y.; Wiria, F.E. Laser and electron-beam powder-bed additive manufacturing of metallic implants: A review on processes, materials and designs. J. Orthop. Res. 2016, 34, 369–385. [CrossRef] [PubMed]
Olakanmi, E.O.; Cochrane, R.F.; Dalgarno, K.W. A review on selective laser sintering/melting (SLS/SLM) of aluminium alloy powders: Processing, microstructure, and properties. Prog. Mater. Sci. 2015, 74, 401–477. [CrossRef]
Mahmood, M.A.; Popescu, A.C.; Hapenciuc, C.L.; Ristoscu, C.; Visan, A.I.; Oane, M.; Mihailescu, I.N. Estimation of clad geometry and corresponding residual stress distribution in laser melting deposition: Analytical modeling and experimental correlations. Int. J. Adv. Manuf. Technol. 2020, 111, 77–91. [CrossRef]
Mahmood, M.A.; Popescu, A.C.; Oane, M.; Ristoscu, C.; Chioibasu, D.; Mihai, S.; Mihailescu, I.N. Three-jet powder flow and laser–powder interaction in laser melting deposition: Modelling versus experimental correlations. Metals 2020, 10, 1113. [CrossRef]
King, W.; Anderson, A.T.; Ferencz, R.M.; Hodge, N.E.; Kamath, C.; Khairallah, S.A. Overview of modelling and simulation of metal powder bed fusion process at Lawrence Livermore National Laboratory. Mater. Sci. Technol. 2015, 31, 957–968. [CrossRef]
Gong, H.; Rafi, K.; Gu, H.; Starr, T.; Stucker, B. Analysis of defect generation in Ti-6Al-4V parts made using powder bed fusion additive manufacturing processes. Addit. Manuf. 2014, 1, 87–98. [CrossRef]
Frazier, W.E. Metal additive manufacturing: A review. J. Mater. Eng. Perform. 2014, 23, 1917–1928. [CrossRef]
Panwisawas, C.; Qiu, C.L.; Sovani, Y.; Brooks, J.W.; Attallah, M.M.; Basoalto, H.C. On the role of thermal fluid dynamics into the evolution of porosity during selective laser melting. Scr. Mater. 2015, 105, 14–17. [CrossRef]
Qian, Y.; Yan, W.; Lin, F. Parametric study and surface morphology analysis of electron beam selective melting. Rapid Prototyp. J. 2018, 24, 1586–1598. [CrossRef]
Panwisawas, C.; Perumal, B.; Ward, R.M.; Turner, N.; Turner, R.P.; Brooks, J.W.; Basoalto, H.C. Keyhole formation and thermal fluid flow-induced porosity during laser fusion welding in titanium alloys: Experimental and modelling. Acta Mater. 2017, 126, 251–263. [CrossRef]
Panwisawas, C.; Sovani, Y.; Turner, R.P.; Brooks, J.W.; Basoalto, H.C.; Choquet, I. Modelling of thermal fluid dynamics for fusion welding. J. Mater. Process. Technol. 2018, 252, 176–182. [CrossRef]
Martin, A.A.; Calta, N.P.; Hammons, J.A.; Khairallah, S.A.; Nielsen, M.H.; Shuttlesworth, R.M.; Sinclair, N.; Matthews, M.J.; Jeffries, J.R.; Willey, T.M.; et al. Ultrafast dynamics of laser-metal interactions in additive manufacturing alloys captured by in situ X-ray imaging. Mater. Today Adv. 2019, 1, 100002. [CrossRef]
Cunningham, R.; Zhao, C.; Parab, N.; Kantzos, C.; Pauza, J.; Fezzaa, K.; Sun, T.; Rollett, A.D. Keyhole threshold and morphology in laser melting revealed by ultrahigh-speed x-ray imaging. Science 2019, 363, 849–852. [CrossRef] [PubMed]
Tang, C.; Tan, J.L.; Wong, C.H. A numerical investigation on the physical mechanisms of single track defects in selective laser melting. Int. J. Heat Mass Transf. 2018, 126, 957–968. [CrossRef]
Mirkoohi, E.; Ning, J.; Bocchini, P.; Fergani, O.; Chiang, K.-N.; Liang, S. Thermal Modeling of Temperature Distribution in Metal Additive Manufacturing Considering Effects of Build Layers, Latent Heat, and Temperature-Sensitivity of Material Properties. J. Manuf. Mater. Process. 2018, 2, 63. [CrossRef]
Oane, M.; Sporea, D. Temperature profiles modeling in IR optical components during high power laser irradiation. Infrared Phys. Technol. 2001, 42, 31–40. [CrossRef]
Cleary, P.W.; Sawley, M.L. DEM modelling of industrial granular flows: 3D case studies and the effect of particle shape on hopper discharge. Appl. Math. Model. 2002, 26, 89–111. [CrossRef]
Parteli, E.J.R.; Pöschel, T. Particle-based simulation of powder application in additive manufacturing. Powder Technol. 2016, 288, 96–102. [CrossRef]
Cao, L. Numerical simulation of the impact of laying powder on selective laser melting single-pass formation. Int. J. Heat Mass Transf. 2019, 141, 1036–1048. [CrossRef]
Tian, Y.; Yang, L.; Zhao, D.; Huang, Y.; Pan, J. Numerical analysis of powder bed generation and single track forming for selective laser melting of SS316L stainless steel. J. Manuf. Process. 2020, 58, 964–974. [CrossRef]
Lee, Y.S.; Zhang, W. Modeling of heat transfer, fluid flow and solidification microstructure of nickel-base superalloy fabricated by laser powder bed fusion. Addit. Manuf. 2016, 12, 178–188. [CrossRef]
Tang, M.; Pistorius, P.C.; Beuth, J.L. Prediction of lack-of-fusion porosity for powder bed fusion. Addit. Manuf. 2017, 14, 39–48. [CrossRef]
Promoppatum, P.; Yao, S.C.; Pistorius, P.C.; Rollett, A.D. A Comprehensive Comparison of the Analytical and Numerical Prediction of the Thermal History and Solidification Microstructure of Inconel 718 Products Made by Laser Powder-Bed Fusion. Engineering 2017, 3, 685–694. [CrossRef]
Rosenthal, D. Mathematical Theory of Heat Distribution During Welding and Cutting. Weld. J. 1941, 20, 220–234.
Chen, Q.; Zhao, Y.Y.; Strayer, S.; Zhao, Y.Y.; Aoyagi, K.; Koizumi, Y.; Chiba, A.; Xiong, W.; To, A.C. Elucidating the Effect of Preheating Temperature on Melt Pool Morphology Variation in Inconel 718 Laser Powder Bed Fusion via Simulation and Experiment. Available online: https://www.sciencedirect.com/science/article/pii/S2214860420310149#bb8 (accessed on 30 April 2021).
Ur Rehman, A.; Pitir, F.; Salamci, M.U. Laser Powder Bed Fusion (LPBF) of In718 and the Impact of Pre-Heating at 500 and 1000 ◦C: Operando Study. Materials 2021, 14, 6683. [CrossRef] [PubMed]
Ur Rehman, A.; Pitir, F.; Salamci, M.U. Full-Field Mapping and Flow Quantification of Melt Pool Dynamics in Laser Powder Bed Fusion of SS316L. Materials 2021, 14, 6264. [CrossRef] [PubMed]
Gong, H.; Gu, H.; Zeng, K.; Dilip, J.J.S.; Pal, D.; Stucker, B.; Christiansen, D.; Beuth, J.; Lewandowski, J.J. Melt Pool Characterization for Selective Laser Melting of Ti-6Al-4V Pre-alloyed Powder. In Proceedings of the International Solid Freeform Fabrication Symposium, Austin, TX, USA, 10–12 August 2014; 2014; pp. 256–267.
Song, B.; Dong, S.; Liao, H.; Coddet, C. Process parameter selection for selective laser melting of Ti6Al4V based on temperature distribution simulation and experimental sintering. Int. J. Adv. Manuf. Technol. 2012, 61, 967–974. [CrossRef]
Design of Inductive Sensor System for Wear Particles in Oil
NIU Ze, LI Kai, BAI Wenbin, SUN Yuanyuan, GONG Qingqing, HAN Yan Shanxi Provincial Key Laboratory of Information Detection and Processing, North University of China, Taiyuan 030051
Abstract
오일의 연마 입자는 엔진 및 기타 장비의 마모 상태를 반영할 수 있습니다.오일 금속 연마 입자의 온라인 모니터링을 실현하기 위해 전자기 원리에 기반한 3코일 센서의 수학적 모델이 설정되었습니다. 유도 및 센서의 최적 구조 매개변수(내경), 간격, 너비 등), 간섭성 복조 모델을 사용하여 마모 입자 신호를 추출하고 마모 입자 신호의 생성 원리를 분석합니다.
시스템은 다층 차폐 구조를 채택하여 외부 자기장 간섭을 효과적으로 줄일 수 있으며 설계된 센서 감지 시스템은 관련 테스트를 위해 팬 기어 박스의 오일 회로에 연결됩니다. 테스트 결과 시스템은 마모 입자 신호를 효과적으로 추출할 수 있으며 마모 입자 신호는 동시에 연마 입자의 속도와 크기에 영향을 받습니다.
1-18의 유속에서 187μm 강자성을 달성할 수 있습니다 L/min 금속 연마 입자 및 578μm 비강자성 금속 연마 입자의 검출은 BP 신경망과 결합되어 오일 금속 연마 입자의 특성 매개변수를 적응적으로 구별할 수 있으며, 이는 오일 연마 입자의 개발에 대한 이론적 지원을 제공합니다.
미래의 라인 모니터링 장비 그리고 기술 지원은 기계 장비의 고장 진단을 위한 중요한 기반을 제공합니다.
[1] 郭静英, 赵志龙, 陈森, 等. 二节螺线管式润滑油金属颗粒传感器研究[J]. 仪表技术与传感器, 2018(1):13-16. GUO Jingying, ZHAO Zhilong, CHEN Sen, et al. Research on two-section solenoid type lubricating oil metal particle sensor[J]. Instrument Technology and Sensor, 2018(1):13-16. [2] 张勇, 司二伟, 李国盛, 等. 润滑油金属磨粒传感器设计及试验研究[J]. 润滑与密封, 2017, 42(4):89-94. ZHANG Yong, SI Erwei, LI Guosheng, et al. Design and experimental study of lubricating oil metal abrasive sensor[J]. Lubrication and Sealing, 2017, 42(4):89-94. [3] 曾霖, 张洪朋, 滕怀波, 等. 一种船机油液多污染物检测新方法研究[J]. 机械工程学报, 2018, 54(12):125-132. ZENG Lin, ZHANG Hongpeng, TENG Huaibo, et al. Research on a new method for detecting multiple pollutants in marine oil[J]. Journal of Mechanical Engineering, 2018, 54(12):125-132. [4] 孙衍山, 杨昊, 佟海滨, 等. 航空发动机滑油磨粒在线监测[J]. 仪器仪表学报, 2017, 38(7):1561-1569. SUN Yanshan, YANG Hao, TONG Haibin, et al. Online monitoring of aero-engine lubricant oil wear particles[J]. Chinese Journal of Scientific Instrument, 2017, 38(7):1561-1569. [5] DING Y, WANG Y, XIANG J. An online debris sensor system with vibration resistance for lubrication analysis[J]. Review of entific Instruments, 2016, 87(2):1590-1597. [6] 莫固良, 汪慧云, 李兴旺, 等. 飞机健康监测与预测系统的发展及展望[J]. 振动、测试与诊断, 2013, 33(6):925-930. MO Guliang, WANG Huiyun, LI Xingwang, et al. The development and prospect of aircraft health monitoring and prediction systems[J]. Vibration, Testing and Diagnosis, 2013, 33(6):925-930. [7] 李萌, 郑长松, 李和言, 等. 电感式磨粒在线监测传感器的激励特性分析[J]. 传感器与微系统, 2014, 33(6):19-22, 30. LI Meng, ZHENG Changsong, LI Heyan, et al. Analysis of excitation characteristics of inductive wear particle online monitoring sensors[J]. Sensors and Microsystems, 2014, 33(6):19-22, 30. [8] FAN X, LIANG M, YEAP T. A joint time-invariant wavelet transform and kurtosis approach to the improvement of in-line oil debris sensor capability[J]. Smart Materials & Structures, 2009, 18(8):1-13. [9] MURALI S, JAGTIANI A V, XIA G, et al. A microfluidic Coulter counting device for metal wear detection in lubrication oil[J]. Review of Scientific Instruments, 2009, 80(1):016105. [10] 孙广涛, 张洪朋, 顾长智, 等. 高精度微流体多参数液压油检测芯片设计[J]. 仪器仪表学报, 2019, 40(2):59-66. SUN Guangtao, ZHANG Hongpeng, GU Changzhi, et al. Design of high-precision microfluidic multi-parameter hydraulic oil detection chip[J]. Chinese Journal of Scientific Instrument, 2019, 40(2):59-66. [11] 马来好, 张洪朋, 乔卫亮, 等. 双螺线管套管结构的液压油金属颗粒检测传感器[J]. 仪器仪表学报, 2019, 40(7):216-223. MA Laihao, ZHANG Hongpeng, QIAO Weiliang, et al. Hydraulic oil metal particle detection sensor with double solenoid casing structure[J]. Chinese Journal of Scientific Instrument, 2019, 40(7):216-223. [12] 白晨朝, 张洪朋, 曾霖, 等. 双螺线圈式液压油微污染物检测传感器[J]. 仪器仪表学报, 2019, 40(6):16-22. BAI Chenchao, ZHANG Hongpeng, ZENG Lin, et al. Double spiral coil type hydraulic oil micro-pollutant detection sensor[J]. Chinese Journal of Scientific Instrument, 2019, 40(6):16-22. [13] 史皓天, 张洪朋, 曾霖, 等. 采用柱形极板的电容式油液检测传感器[J]. 仪表技术与传感器, 2019(8):8-12. SHI Haotian, ZHANG Hongpeng, ZENG Lin, et al. Capacitive oil detection sensor using columnar plates[J]. Instrument Technology and Sensor, 2019(8):8-12. [14] 虞子雷, 张洪朋, 曾霖, 等. 基于微流控谐振式芯片的金属颗粒检测[J]. 电子测量与仪器学报, 2017, 31(10):1627-1632. YU Zilei, ZHANG Hongpeng, ZENG Lin, et al. Metal particle detection based on microfluidic resonant chip[J]. Journal of Electronic Measurement and Instrument, 2017, 31(10):1627-1632. [15] 张洪朋, 白晨朝, 孙广涛, 等. 高通量微型多参数油液污染物检测传感器[J]. 光学精密工程, 2018, 26(9):2237-2245. ZHANG Hongpeng, BAI Chenchao, SUN Guangtao, et al. High-throughput miniature multi-parameter oil contaminant detection sensor[J]. Optics and Precision Engineering, 2018, 26(9):2237-2245. [16] 郑长松, 李萌, 高震, 等. 电感式磨粒传感器磨感电动势提取方法[J]. 振动. 测试与诊断, 2016, 36(1):36-41, 196. ZHENG Changsong, LI Meng, GAO Zhen, et al. Method for extracting the electromotive force of the inductive wear sensor[J]. Vibration. Test and Diagnosis, 2016, 36(01):36-41, 196. [17] 吴超, 郑长松, 马彪. 电感式磨粒传感器中铁磁质磨粒特性仿真研究[J]. 仪器仪表学报, 2011, 32(12):2774-2780. WU Chao, ZHENG Changsong, MA Biao. Simulation study on the characteristics of ferromagnetic wear particles in an inductive wear particle sensor[J]. Chinese Journal of Scientific Instrument, 2011, 32(12):2774-2780. [18] 把鑫, 王吉芳, 左云波, 等. 基于FPGA的油液在线监测系统[J]. 仪表技术与传感器, 2015(6):103-106. BA Xin, WANG Jifang, ZUO Yunbo, et al. On-line oil monitoring system based on FPGA[J]. Instrumentation Technology and Sensors, 2015(6):103-106. [19] 游修东, 陈勇, 陈遥沛. 近距离磁感应线圈的磁场计算与仿真分析[J]. 水雷战与舰船防护, 2017, 25(1):54-59. YOU Xiudong, CHEN Yong, CHEN Yaopei. Magnetic field calculation and simulation analysis of close-range magnetic induction coils[J]. Mine Warfare and Ship Protection, 2017, 25(1):54-59. [20] 高震, 郑长松, 贾然, 等. 综合传动油液金属磨粒在线监测传感器研究[J]. 广西大学学报, 2017, 42(2):409-418. GAO Zhen, ZHENG Changsong, JIA Ran, et al. Research on on-line monitoring sensor for metal wear particles in comprehensive transmission oil[J]. Journal of Guangxi University, 2017, 42(2):409-418. [21] 于振南, 刘倩, 高秀晓, 等. 基于低通滤波的相敏检波算法改进与实现[J]. 测井技术, 2018, 42(5):568-570, 576. YU Zhennan, LIU Qian, GAO Xiuxiao, et al. Improvement and realization of phase-sensitive detection algorithm based on low-pass filtering[J]. Logging Technology, 2018, 42(5):568-570, 576. [22] 范红波, 张英堂, 李志宁, 等. 电感式磨粒传感器中铁磁质磨粒的磁特性研究[J]. 摩擦学学报, 2009, 29(5):452-457. FAN Hongbo, ZHANG Yingtang, LI Zhining, et al. Study on the magnetic properties of ferromagnetic wear particles in inductive wear particle sensors[J]. Acta Tribology, 2009, 29(5):452-457. [23] FAN Hongbo, ZHANG Yingtang, LI Zhining, et al. Design and noise control of the portable wear debris concentration detector[C]//2009 International Conference on Measuring Technology and Mechatronics Automation, ICMTMA 2009:206-209. [24] DUKA K, GERRIT J. Advanced oil debris monitoring for pipeline mechanical drive gas turbines[C/CD]//Asme Turbo Expo:Power for Land, Sea, & Air, 2000. [25] 左云波, 谷玉海, 王立勇. 电磁式油液金属磨粒检测系统研究[J]. 设备管理与维修, 2018(13):21-23. ZUO Yunbo, GU Yuhai, WANG Liyong. Research on electromagnetic oil metal debris detection system[J]. Equipment Management and Maintenance, 2018(13):21-23. [26] DU Li, ZHU Xiaoliang, HAN Yu, et al. Improving sensitivity of an inductive pulse sensor for detection of metallic wear debris in lubricants using parallel LC resonance method[J]. Measurement Science and Technology, 2013, 24(7):075106. [27] CAO Yunpeng, LIU Rui, DU Jianwei, et al. Gas turbine bearing wear monitoring method based on magnetic plug inductance sensor[C/CD]//ASME Turbo Expo 2018:Turbomachinery Technical Conference and Exposition. 2018.
선택적 레이저 용융 동안 CP-Ti의 열 거동을 연구하기 위해 무작위 패킹 분말 베드 모델을 기반으로 하는 메조스코프 시뮬레이션이 설정되었습니다. 레이저와 분말의 상호 작용에 따른 용융 풀의 특성과 레이저 출력이 용융 풀의 열 거동, 유체 역학 및 표면 형태 변화에 미치는 영향을 연구했습니다.
결과는 레이저 출력이 증가함에 따라 최대 온도, 온도 변화율, 용융 풀의 수명 및 크기가 크게 향상되었음을 보여줍니다. 또한 본 연구에서는 이중궤도 하의 용융지의 특성과 열거동을 주로 연구하였다.
두 번째 트랙의 용융 풀의 최대 온도, 수명 및 길이와 너비는 첫 번째 트랙보다 더 높고 레이저 출력이 증가함에 따라 용융 풀에서 두 번째 트랙의 길이 너비 비율이 증가함을 알 수 있습니다. 더 커집니다.
A mesoscopic simulation based on random packing powder bed model was established to study the heat behavior of CP-Ti during selective laser melting. The characteristics of the molten pool under the interaction of laser and powder, and the influence of laser power on the thermal behavior, hydrodynamics and surface morphology evolution of the molten pool were studied. The results show that with the increase of laser power, the maximum temperature, temperature change rate, lifetime of molten pool and size are greatly improved. In addition, the characteristics and heat behavior of the molten pool under the double track are mainly studied in this study. It is found that the maximum temperature, lifetime, and the length and width of the molten pool of the second track are higher than those in the first, and with the increase of laser power, the length width ratio of the second track in molten pool becomes larger.
Multiphysics Modeling of Thermal Behavior of Commercial Pure Titanium Powder During Selective Laser Melting
Keywords
Additive manufacturing
Selective laser melting
Numerical simulation
Thermal behavior
References
1.D.K. Pattanayak, A. Fukuda, T. Matsushita, M. Takemoto, S. Fujibayashi, K. Sasaki, N. Nishida, T. Nakamura, T. Kokubo, Acta Biomater. 7, 1398 (2011)CASArticleGoogle Scholar
2.A.K. Patnaik, N. Poondla, C.C. Menzemer, T.S. Srivatsan, Mater. Sci. Eng. A 590, 390 (2014)CASArticleGoogle Scholar
3.D.D. Gu, Y.C. Hagedorn, W. Meiners, G.B. Meng, R.J.S. Batista, K. Wissenbach, R. Poprawe, Acta Mater. 60, 3849 (2012)CASArticleGoogle Scholar
4.H. Attar, M. Calin, L.C. Zhang, S. Scudino, J. Eckert, Mater. Sci. Eng. A 593, 170 (2014)CASArticleGoogle Scholar
5.J. Shen, B. Chen, J. Umeda, K. Kondoh, Mater. Sci. Eng. A 716, 1 (2018)CASArticleGoogle Scholar
6.E. Santos, K. Osakada, M. Shiomi, M. Morita, F. Abe, Fabrication of titanium dental implants by selective laser melting. in Proceedings of the 5th International Symposium on Laser Precision Microfabrication, Nara, 11–14 May 2004
26.Y.S. Lee, W. Zhang, Modeling of heat transfer, Addit. Manuf. 12, 178 (2016)CASGoogle Scholar
27.I. Kovaleva, O. Kovalev, I. Smurov, Phys. Procedia 56, 400 (2014)ArticleGoogle Scholar
28.Y.S. Lee, W. Zhang, Mesoscopic simulation of heat transfer and fluid flow in laser powder bed additive manufacturing. in Proceedings of 26th Solid Freeform Fabrication Symposium, Austin, 10-12 August 2015
29.W. Yan, W. Ge, Y. Qian, S. Lin, B. Zhou, W.K. Liu, Acta Mater. 134, 324 (2017)CASArticleGoogle Scholar
30.I. Yadroitsev, A. Gusarov, I. Yadroitsava, I. Smurov, J. Mater. Process. Tech. 210, 1624 (2010)CASArticleGoogle Scholar
43.H. Sakaguchi, E. Ozaki, T. Igarashi, Int. J. Mod. Phys. B 7, 1949 (1993)
44.Flow3D: Version 11 0.1.2: User Manual, Flow Science, Santa Fe, NM, USA, (2014)
45.S. Kolossov, E. Boillat, R. Glardon, P. Fischer, M. Locher, Int. J. Mach. Tool. Manu. 44, 117 (2004)ArticleGoogle Scholar
46.V.R. Voller, A.D. Brent, C. Prakash, Int. J. Heat Mass Tran. 32, 1719 (1989)CASArticleGoogle Scholar
47.Y.-C. Wu, C.-H. San, C.-H. Chang, H.-J. Lin, R. Marwan, S. Baba, W.-S. Hwang, J. Mater. Process. Tech. 254, 72 (2018)ArticleGoogle Scholar
48.B. Cheng, X. Li, C. Tuile, A. Ilin, H. Willeck, U. Hartel, Multi-physics modeling of single-track scanning in selective laser melting: powder compaction effect. in Proceedings of 29th Annual International Solid Freeform Fabrication Symposium-An Additive Manufacturing Conference, Austin, 13–15 August 2018
49.B. Liu, G. Fang, L. Lei, W. Liu, Appl. Math. Model. 79, 506 (2020)ArticleGoogle Scholar
50.S. Lee, J. Kim, J. Choe, S.-W. Kim, J.-K. Hong, Y.S. Choi, Met. Mater. Int. 27, 78 (2021)
레이저 사인파 진동(사인) 용접 및 레이저 용접(SLW)에서 1.5mm 6061/5182 알루미늄 합금 박판 랩 조인트의 수치 모델이 온도 분포와 용융 흐름을 시뮬레이션하기 위해 개발되었습니다.
SLW의 일반적인 에너지 분포와 달리 레이저 빔의 사인파 진동은 에너지 분포를 크게 균질화하고 에너지 피크를 줄였습니다. 에너지 피크는 사인 용접의 양쪽에 위치하여 톱니 모양의 단면이 형성되었습니다. 이 논문은 시뮬레이션을 통해 응고 미세구조에 대한 온도 구배(G)와 응고 속도(R)의 영향을 설명했습니다.
결과는 사인 용접의 중심이 낮은 G/R로 더 넓은 영역을 가짐으로써 더 넓은 등축 결정립 영역의 형성을 촉진하고 더 큰 GR로 인해 주상 결정립이 더 가늘다는 것을 나타냅니다. 다공성 및 비관통 용접은 레이저 사인파 진동에 의해 얻어졌습니다.
그 이유는 용융 풀의 부피가 확대되고 열쇠 구멍의 부피 비율이 감소하며 용융 풀의 난류가 완만해졌기 때문이며, 이는 용융 흐름의 고속 이미징 및 시뮬레이션 결과에서 관찰되었습니다. 두 용접부의 인장시험에서 융착선을 따라 인장파괴 형태를 보였고 사인 용접부의 인장강도가 SLW 용접부보다 유의하게 우수하였습니다.
이는 등축 결정립 영역이 넓을수록 균열 경향이 감소하고 파단 위치에 근접한 입자 크기가 미세하기 때문입니다. 결함이 없고 우수한 용접은 신에너지 자동차 산업에 매우 중요합니다.
A numerical model of 1.5 mm 6061/5182 aluminum alloys thin sheets lap joints under laser sinusoidal oscillation (sine) welding and laser welding (SLW) weld was developed to simulate temperature distribution and melt flow. Unlike the common energy distribution of SLW, the sinusoidal oscillation of laser beam greatly homogenized the energy distribution and reduced the energy peak. The energy peaks were located at both sides of the sine weld, resulting in the tooth-shaped sectional formation. This paper illustrated the effect of the temperature gradient (G) and solidification rate (R) on the solidification microstructure by simulation. Results indicated that the center of the sine weld had a wider area with low G/R, promoting the formation of a wider equiaxed grain zone, and the columnar grains were slenderer because of greater GR. The porosity-free and non-penetration welds were obtained by the laser sinusoidal oscillation. The reasons were that the molten pool volume was enlarged, the volume proportion of keyhole was reduced and the turbulence in the molten pool was gentled, which was observed by the high-speed imaging and simulation results of melt flow. The tensile test of both welds showed a tensile fracture form along the fusion line, and the tensile strength of sine weld was significantly better than that of the SLW weld. This was because that the wider equiaxed grain area reduced the tendency of cracks and the finer grain size close to the fracture location. Defect-free and excellent welds are of great significance to the new energy vehicles industry.
Keywords
Laser weldingSinusoidal oscillatingEnergy distributionNumerical simulationMolten pool flowGrain structure
Figures-Effects of sinusoidal oscillating laser beam on weld formation, melt flow and grain structure during aluminum alloys lap welding
적층 제조(AM) 기술은 복잡한 형상의 3D 부품을 쉽게 만들고 미세 구조 제어를 통해 재료 특성을 크게 제어할 수 있기 때문에 많은 관심을 받았습니다. PBF(Powderbed fusion) 방식의 AM 공정에서는 금속 분말을 레이저나 전자빔으로 녹이고 응고시키는 과정을 반복하여 3D 부품을 제작합니다.
일반적으로 응고 미세구조는 Hunt[Mater. 과학. 영어 65, 75(1984)]. 그러나 CET 이론이 일반 316L 스테인리스강에서도 높은 G와 R로 인해 PBF형 AM 공정에 적용될 수 있을지는 불확실하다.
본 연구에서는 미세구조와 응고 조건 간의 관계를 밝히기 위해 전자빔 조사에 의해 유도된 316L 강의 응고 미세구조를 분석하고 CtFD(Computational Thermal-Fluid Dynamics) 방법을 사용하여 고체/액체 계면에서의 응고 조건을 평가했습니다.
CET 이론과 반대로 높은 G 조건에서 등축 결정립이 종종 형성되는 것으로 밝혀졌다. CtFD 시뮬레이션은 약 400 mm s-1의 속도까지 유체 흐름이 있음을 보여 주며 수상 돌기의 파편 및 이동의 영향으로 등축 결정립이 형성됨을 시사했습니다.
Additive manufacturing(AM)technologies have attracted much attention because it enables us to build 3D parts with complicated geometry easily and control material properties significantly via the control of microstructures. In the powderbed fusion(PBF)type AM process, 3D parts are fabricated by repeating a process of melting and solidifying metal powders by laser or electron beams. In general, the solidification microstructures can be predicted from solidification conditions defined by the combination of temperature gradient G and solidification rate R on the basis of columnar-equiaxed transition(CET)theory proposed by Hunt [Mater. Sci. Eng. 65, 75(1984)]. However, it is unclear whether the CET theory can be applied to the PBF type AM process because of the high G and R, even for general 316L stainless steel. In this study, to reveal relationships between microstructures and solidification conditions, we have analyzed solidification microstructures of 316L steel induced by electronbeam irradiation and evaluated solidification conditions at the solid/liquid interface using a computational thermal-fluid dynamics (CtFD)method. It was found that equiaxed grains were often formed under high G conditions contrary to the CET theory. CtFD simulation revealed that there is a fluid flow up to a velocity of about 400 mm s-1, and suggested that equiaxed grains are formed owing to the effect of fragmentations and migrations of dendrites.
Keywords
Additive Manufacturing, 316L Stainless Steel, Powder Bed Fusion, Electron Beam Melting, Computational Thermal Fluid Dynamics Simulation
Fig. 1 Width, height, and height differences calculated from laser
microscope analysis of melt tracks formed by scanning electron
beam.
Fig. 2(a)Scanning electron microscope(SEM)image and(b)
corresponding electron back-scattering diffraction(EBSD)
IPF-map taken from the electron-beam irradiated region in
P900-V100 sample.
Fig. 3 Average grain size and their aspect ratio calculated from EBSD
IPF-map taken from the electron-beam irradiated region.Fig. 4 Comparison of experimental SEM image and computational
thermal fluid dynamics(CtFD)simulated melt pool with a beam
diameter of 700 μm and absorption rates of(a)0.3,(b)0.5, and
(c)0.7. Electron beam power and scan speed are 900 W and
100 mm s-1, respectively.
Fig. 5 Comparison of experimental SEM image and CtFD simulated
melt pool with beam diameters of(a)700 μm,(b)1000 μm,
and(c)1300 μm and an absorption rate of 0.3. Electron beam
power and scan speed are 900 W and 100 mm s-1, respectivelyFig. 6 Depth of melt tracks calculated from experimental SEM image
and CtFD simulation results.Fig. 7 G-R plots of 316L steel colored by(a)aspect ratio of crystalline
grains and(b)fluid velocity. Fig. 8 Comparison of solidification microstructure(EBSD IPF-map)of
melt region formed by scanning electron beam and corresponding
snap shot of CtFD simulation colored by fluid velocity
References
1) M.C. Sow, T. De Terris, O. Castelnau, Z. Hamouche, F. Coste, R. Fabbro and P. Peyre: “Influence of beam diameter on Laser Powder
Bed Fusion(L-PBF)process”, Addit. Manuf. 36(2020), 101532. 2) J.C. Simmons, X. Chen, A. Azizi, M.A. Daeumer, P.Y. Zavalij, G. Zhou and S.N. Schiffres: “Influence of processing and microstructure on the local and bulk thermal conductivity of selective laser melted 316L stainless steel”, Addit. Manuf. 32(2020), 100996. 3) S. Dryepondt, P. Nandwana, P. Fernandez-Zelaia and F. List: “Microstructure and High Temperature Tensile properties of 316L Fabricated by Laser Powder-Bed Fusion”, Addit. Manuf. 37(2020), 101723. 4) S.H. Sun, T. Ishimoto, K. Hagihara, Y. Tsutsumi, T. Hanawa and T. Nakano: “Excellent mechanical and corrosion properties of austenitic stainless steel with a unique crystallographic lamellar microstructure via selective laser melting”, Scr. Mater. 159(2019), 89-93. 5) T. Ishimoto, S. Wu, Y. Ito, S.H. Sun, H. Amano and T. Nakano: “Crystallographic orientation control of 316L austenitic stainless steel via selective laser melting”, ISIJ Int. 60(2020), 1758-1764. 6) T. Ishimoto, K. Hagihara, K. Hisamoto, S.H. Sun and T. Nakano: “Crystallographic texture control of beta-type Ti-15Mo-5Zr3Al alloy by selective laser melting for the development of novel implants with a biocompatible low Young’s modulus”, Scr. Mater. 132(2017), 34-38. 7) X. Ding, Y. Koizumi, D. Wei and A. Chiba: “Effect of process parameters on melt pool geometry and microstructure development for electron beam melting of IN718: A systematic single bead analysis study”, Addit. Manuf. 26(2019), 215-226. 8) K. Karayagiz, L. Johnson, R. Seede, V. Attari, B. Zhang, X. Huang, S. Ghosh, T. Duong, I. Karaman, A. Elwany and R. Arróyave: “Finite interface dissipation phase field modeling of Ni-Nb under additive manufacturing conditions”, Acta Mater. 185(2020), 320-339. 9) M.M. Kirka, Y. Lee, D.A. Greeley, A. Okello, M.J. Goin, M.T. Pearce and R.R. Dehoff: “Strategy for Texture Management in Metals Additive Manufacturing”, JOM, 69(2017), 523-531. 10) S.S. Babu, N. Raghavan, J. Raplee, S.J. Foster, C. Frederick, M. Haines, R. Dinwiddie, M.K. Kirka, A. Plotkowski, Y. Lee and R.R. Dehoff: “Additive Manufacturing of Nickel Superalloys: Opportunities for Innovation and Challenges Related to Qualification”, Metall. Mater. Trans. A. 49(2018), 3764-3780. 11) M.R. Gotterbarm, A.M. Rausch and C. Körner: “Fabrication of Single Crystals through a μ-Helix Grain Selection Process during Electron Beam Metal Additive Manufacturing”, Metals, 10(2020), 313. 12) J.D.D. Hunt: “Steady state columnar and equiaxed growth of dendrites and eutectic”, Mater. Sci. Eng. 65(1984), 75-83. 13) S. Bontha, N.W. Klingbeil, P.A. Kobryn and H.L. Fraser: “Effects of process variables and size-scale on solidification microstructure in beam-based fabrication of bulky 3D structures”, Mater. Sci. Eng. A. 513-514(2009), 311-318. 14) J. Gockel and J. Beuth: “Understanding Ti-6Al-4V microstructure control in additive manufacturing via process maps”, 24th Int. SFF Symp. – An Addit. Manuf. Conf. SFF 2013.(2013), 666-674. 15) B. Schoinochoritis, D. Chantzis and K. Salonitis: “Simulation of metallic powder bed additive manufacturing processes with the finite element method: A critical review”, Proc. of Instit. Mech. Eng., Part B: J. Eng. Manuf. 231(2017), 96-117. 16)小泉雄一郎: “計算機シミュレーションを用いたAdditive Manufacturing プロセス最適化予測”, スマートプロセス学会誌, 8-4(2019), 132-138. 17) Y. Zhao, Y. Koizumi, K. Aoyagi, D. Wei, K. Yamanaka and A. Chiba: “Molten pool behavior and effect of fluid flow on solidification conditions in selective electron beam melting(SEBM)of a biomedical Co-Cr-Mo alloy”, Addit. Manuf. 26(2019), 202-214. 18) C. Tang, J.L. Tan and C.H. Wong: “A numerical investigation on the physical mechanisms of single track defects in selective laser melting”, Int. J. Heat Mass Transf. 126(2018), 957-968. 19) Technical data for Iron, [Online]. Available: http://periodictable.com/ Elements/026/data.html. [Accessed: 8-Feb-2021]. 20) N. Raghavan, R. Dehoff, S. Pannala, S. Simunovic, M. Kirka, J. Turner, N. Carl-son and S.S. Babu: “Numerical modeling of heattransfer and the influence of process parameters on tailoring the grain morphology of IN718 in electron beam additive manufacturing”, Acta Mater. 112(2016), 303-314. 21) S. Morita, Y. Miki and K. Toishi: “Introduction of Dendrite Fragmentation to Microstructure Calculation by Cellular Automaton Method”, Tetsu-to-Hagane. 104(2018), 559-566. 22) H. Esaka and M. Tamura: “Model Experiment Using Succinonitrile on the Formation of Equiaxed Grains caused by Forced Convection”, Tetsu-to-Hagane. 86(2000), 252-258.
This paper presents computational fluid dynamics simulations of the deposition flow during printing of multiple layers in material extrusion additive manufacturing. The developed model predicts the morphology of the deposited layers and captures the layer deformations during the printing of viscoplastic materials. The physics is governed by the continuity and momentum equations with the Bingham constitutive model, formulated as a generalized Newtonian fluid. The cross-sectional shapes of the deposited layers are predicted, and the deformation of layers is studied for different constitutive parameters of the material. It is shown that the deformation of layers is due to the hydrostatic pressure of the printed material, as well as the extrusion pressure during the extrusion. The simulations show that a higher yield stress results in prints with less deformations, while a higher plastic viscosity leads to larger deformations in the deposited layers. Moreover, the influence of the printing speed, extrusion speed, layer height, and nozzle diameter on the deformation of the printed layers is investigated. Finally, the model provides a conservative estimate of the required increase in yield stress that a viscoplastic material demands after deposition in order to support the hydrostatic and extrusion pressure of the subsequently printed layers.
이 논문은 재료 압출 적층 제조에서 여러 레이어를 인쇄하는 동안 증착 흐름의 전산 유체 역학 시뮬레이션을 제공합니다. 개발된 모델은 증착된 레이어의 형태를 예측하고 점소성 재료를 인쇄하는 동안 레이어 변형을 캡처합니다.
물리학은 일반화된 뉴턴 유체로 공식화된 Bingham 구성 모델의 연속성 및 운동량 방정식에 의해 제어됩니다. 증착된 층의 단면 모양이 예측되고 재료의 다양한 구성 매개변수에 대해 층의 변형이 연구됩니다. 층의 변형은 인쇄물의 정수압과 압출시 압출압력으로 인한 것임을 알 수 있다.
시뮬레이션에 따르면 항복 응력이 높을수록 변형이 적은 인쇄물이 생성되는 반면 플라스틱 점도가 높을수록 증착된 레이어에서 변형이 커집니다. 또한 인쇄 속도, 압출 속도, 층 높이 및 노즐 직경이 인쇄된 층의 변형에 미치는 영향을 조사했습니다.
마지막으로, 이 모델은 후속 인쇄된 레이어의 정수압 및 압출 압력을 지원하기 위해 증착 후 점소성 재료가 요구하는 항복 응력의 필요한 증가에 대한 보수적인 추정치를 제공합니다.
Stability and deformations of deposited layers in material extrusion additive manufacturing
17-4 PH 스테인리스강의 레이저 분말 베드 융합: 열처리가 미세조직의 진화 및 기계적 특성에 미치는 영향에 대한 비교 연구
panelS.Saboonia, A.Chaboka, S.Fenga,e, H.Blaauwb, T.C.Pijperb,c, H.J.Yangd, Y.T.Peia aDepartment of Advanced Production Engineering, Engineering and Technology Institute Groningen, University of Groningen, Nijenborgh 4, 9747 AG, Groningen, The Netherlands bPhilips Personal Care, Oliemolenstraat 5, 9203 ZN, Drachten, The Netherlands cInnovation Cluster Drachten, Nipkowlaan 5, 9207 JA, Drachten, The Netherlands dShi-changxu Innovation Center for Advanced Materials, Institute of Metal Research, Chinese Academy of Sciences, 72 Wenhua Road, Shenyang 110016, P. R. China eSchool of Mechanical Engineering, University of Science and Technology Beijing, Beijing, 100083, P.R. China
Abstract
17-4 PH (precipitation hardening) stainless steel is commonly used for the fabrication of complicated molds with conformal cooling channels using laser powder bed fusion process (L-PBF). However, their microstructure in the as-printed condition varies notably with the chemical composition of the feedstock powder, resulting in different age-hardening behavior. In the present investigation, 17-4 PH stainless steel components were fabricated by L-PBF from two different feedstock powders, and subsequently subjected to different combinations of post-process heat treatments. It was observed that the microstructure in as-printed conditions could be almost fully martensitic or ferritic, depending on the ratio of Creq/Nieq of the feedstock powder. Aging treatment at 480 °C improved the yield and ultimate tensile strengths of the as-printed components. However, specimens with martensitic structures exhibited accelerated age-hardening response compared with the ferritic specimens due to the higher lattice distortion and dislocation accumulation, resulting in the “dislocation pipe diffusion mechanism”. It was also found that the martensitic structures were highly susceptible to the formation of reverted austenite during direct aging treatment, where 19.5% of austenite phase appeared in the microstructure after 15 h of direct aging. Higher fractions of reverted austenite activates the transformation induced plasticity and improves the ductility of heat treated specimens. The results of the present study can be used to tailor the microstructure of the L-PBF printed 17-4 PH stainless steel by post-process heat treatments to achieve a good combination of mechanical properties.
17-4 PH(석출 경화) 스테인리스강은 레이저 분말 베드 융합 공정(L-PBF)을 사용하여 등각 냉각 채널이 있는 복잡한 금형 제작에 일반적으로 사용됩니다. 그러나 인쇄된 상태의 미세 구조는 공급원료 분말의 화학적 조성에 따라 크게 달라지므로 시효 경화 거동이 다릅니다.
현재 조사에서 17-4 PH 스테인리스강 구성요소는 L-PBF에 의해 두 가지 다른 공급원료 분말로 제조되었으며, 이후에 다양한 조합의 후처리 열처리를 거쳤습니다. 인쇄된 상태의 미세구조는 공급원료 분말의 Creq/Nieq 비율에 따라 거의 완전히 마르텐사이트 또는 페라이트인 것으로 관찰되었습니다.
480 °C에서 노화 처리는 인쇄된 구성 요소의 수율과 극한 인장 강도를 개선했습니다. 그러나 마텐자이트 구조의 시편은 격자 변형 및 전위 축적이 높아 페라이트 시편에 비해 시효 경화 반응이 가속화되어 “전위 파이프 확산 메커니즘”이 발생합니다.
또한 마르텐사이트 구조는 직접 시효 처리 중에 복귀된 오스테나이트의 형성에 매우 민감한 것으로 밝혀졌으며, 여기서 15시간의 직접 시효 후 미세 조직에 19.5%의 오스테나이트 상이 나타났습니다.
복귀된 오스테나이트의 비율이 높을수록 변형 유도 가소성이 활성화되고 열처리된 시편의 연성이 향상됩니다. 본 연구의 결과는 기계적 특성의 우수한 조합을 달성하기 위해 후처리 열처리를 통해 L-PBF로 인쇄된 17-4 PH 스테인리스강의 미세 구조를 조정하는 데 사용할 수 있습니다.
Fig. 1. Schematic of (a) geometry of the simulation model, (b) A-A cross-section presenting the locations of point probes for recording temperature history (unit: µm).Fig. 2. Optical (a, b) and TEM (c) micrographs of the wrought 17-4 PH stainless steel.Fig. 3. EBSD micrographs of the as-printed 17-4 PH steel fabricated with “powder A” (a, b) and “powder B” (c, d) on two different cross sections: (a, c) perpendicular to the building direction, and (b, d) parallel to the building direction.Fig. 4. Microstructure of the as-printed 17-4 PH stainless steel fabricated with “powder A” (a) and “powder B” (b).Fig. 5. Simulated temperature history of the probes located at the cross section of the L-PBF 17-4 PH steel sample.Fig. 6. Dependency of the volume fraction of delta ferrite in the final microstructure of L-PBF printed 17-4 PH steel as a function of Creq/Nieq.Fig. 7. IQ + IPF (left column), parent austenite grain maps (middle column) and phase maps (right column, green color = martensite, red color = austenite) of the post-process heat treated 17-4 PH stainless steel: (a-c) direct aged, (d-f) HIP + aging, (g-i) SA + Aging, and (j-l) HIP + SA + aging (all sample were printed with “powder A”).Fig. 8. TEM micrographs of the post process heat treated 17-4 PH stainless steel: (a) direct aging and (b) HIP + aging (printed with “powder A”).Fig. 9. XRD patterns of the post-process heat treated 17-4 PH stainless steel printed with “powder A”.Fig. 10. (a) Volume fraction of reverted austenite as a function of aging time for “direct aging” condition, (b) phase map (green color = martensite, red color = austenite) of the 15 h direct aged specimen printed with “powder A”.Fig. 11. Microhardness variations of the “direct aged” specimens as a function of aging time at 480 °C.Fig. 12. Kernel average misorientation graphs of the as-printed 17-4 PH steel with (a) martensitic structure (printed with “powder A”) and (b) ferritic structure (printed with “powder b”).Fig. 13. Typical stress-strain curves (a) along with the yield and ultimate tensile strengths (b) and elongation (c) of the as-printed and post-process heat treated 17-4 PH stainless steel (all sample are fabricated with “powder A”).Fig. 14. (a) IQ + IPF and (b) phase map (green color = martensite, red color = austenite) of the “direct aged” specimen after tensile test at a location nearby the rupture point (tension direction from left to right).
Atom Probe Tomographic Characterization of nanoscale cu-rich Precipitates in 17-4 precipitate hardened stainless steel tempered at different temperatures
An analytical method to predict and compensate for residual stress-induced deformation in overhanging regions of internal channels fabricated using powder bed fusion
Nano/ultrafine grained austenitic stainless steel through the formation and reversion of deformation-induced martensite: Mechanisms, microstructures, mechanical properties, and TRIP effect
J.B. Ferguson, Benjamin F. Schultz, Dev Venugopalan1, Hugo F. Lopez, Pradeep K. Rohatgi, Kyu Cho, Chang-Soo Kim
On the Superposition of Strengthening Mechanisms in Dispersion Strengthened Alloys and Metal-Matrix Nanocomposites: Considerations of Stress and Energy
J.B. Speed School of Engineering, University of Louisville, Louisville, KY 40292, United States
Abstract
The surface morphology of parts made by the laser powder bed fusion (L-PBF) process is governed by the flow of the melt pool. The nature of the molten metal flow depends on the material properties, process parameters, and powder-bed particles, etc., and may result in potentially significant variations along a laser scanning path.
This study investigates the formation of transient and steady-state zones through a single-track l-PBF experiment using Inconel 625 powder. Single tracks with lengths of 1 mm and 2 mm were fabricated using 195 W laser power and scan speeds of 400 mm/s or 800 mm/s. The surface morphology of the track was analyzed using a white light interferometer (WLI), and an individual single track can be divided into three distinct zones based on the track width and height.
The initial transient region has a wider and taller solidified track geometry, the region near the end of a scan has a tapered profile with a decreasing track width and height, while the steady-state region in the middle has a smaller variation in the width and height.
A mesoscale numerical model was further developed using FLOW-3D to examine the formation of the transient and steady-state zones. At the start of a scan, strong flow occurs outward and backward, leading to the formation of a wider track with a bump. As the scan continues, the thermal gradient stabilizes, leading to a steady state, which resulted in a very small fluctuation in the width. Furthermore, the tapered end of the scan track is due to the half-lemniscate shape of the melt pool during laser scanning.
L-PBF(Laser Powder Bed fusion) 공정으로 만든 부품의 표면 형태는 용융 풀의 흐름에 따라 결정됩니다. 용융 금속 흐름의 특성은 재료 특성, 공정 매개변수 및 분말층 입자 등에 따라 달라지며 레이저 스캐닝 경로를 따라 잠재적으로 상당한 변동이 발생할 수 있습니다.
이 연구는 Inconel 625 분말을 사용하여 단일 트랙 l-PBF 실험을 통해 과도 및 정상 상태 영역의 형성을 조사합니다. 1 mm 및 2 mm 길이의 단일 트랙은 195 W 레이저 출력과 400 mm/s 또는 800 mm/s의 스캔 속도를 사용하여 제작되었습니다. 트랙의 표면 형태는 백색광 간섭계(WLI)를 사용하여 분석되었으며 개별 단일 트랙은 트랙 너비와 높이에 따라 3개의 별개 영역으로 나눌 수 있습니다.
초기 과도 영역은 더 넓고 더 높은 응고된 트랙 형상을 가지며, 스캔 끝 근처의 영역은 트랙 너비와 높이가 감소하는 테이퍼 프로파일을 갖는 반면, 중간의 정상 상태 영역은 너비와 높이에서 더 작은 변동을 가집니다. 신장. 중간 규모 수치 모델은 과도 및 정상 상태 영역의 형성을 조사하기 위해 FLOW-3D를 사용하여 추가로 개발되었습니다.
스캔이 시작될 때 강한 흐름이 바깥쪽과 뒤쪽으로 발생하여 범프가 있는 더 넓은 트랙이 형성됩니다. 스캔이 계속됨에 따라 열 구배가 안정화되어 정상 상태로 이어지며 폭의 변동이 매우 작습니다. 또한 스캔 트랙의 끝이 가늘어지는 것은 레이저 스캔 중 용융 풀의 반-렘니케이트 모양 때문입니다.
A study of transient and steady-state regions from single-track deposition in laser powder bed fusion
Keywords
Additive manufacturing, Laser powder bed fusion, Numerical modelling, Transient region
냉각 속도 및 온도 구배와 같은 FLOW-3D AM 데이터를 미세 구조 모델에 입력하여 결정 성장 및 수상 돌기 암 간격을 예측할 수 있습니다.
레이저 파우더 베드 융합으로 제작 된 니켈 기반 초합금의 열전달, 유체 흐름 및 응고 미세 구조 모델링
오하이오 주립 대학의 연구원들은 니켈 기반 초합금의 미세 구조 진화를 예측하기 위해 용융 풀과 고체 / 액체 인터페이스의 적절한 위치에서 열 구배 및 냉각 속도 데이터를 추출했습니다.
참조 : YS Lee and W. Zhang, Modeling of heat transfer, fluid flow and solidification microstructure of nickel-base superalloy fabricated by laser powder bed fusion , S2214-8604 (16) 30087-2, doi.org/10.1016/j.addma .2016.05.003 , ADDMA 86.
열 응력 | Thermal Stresses
FLOW-3D AM 시뮬레이션의 결과를 ABAQUS 또는 MSC NASTRAN과 같은 FEA 소프트웨어에 입력하여 추가 열 응력 분석을 실행할 수 있습니다. 여기에서 T- 조인트의 레이저 용접 시뮬레이션 결과를 추가 응력 분석을 위해 ABAQUS로 가져 오는 방법을 볼 수 있습니다. 마찬가지로 LPBF 시뮬레이션에서 응고 된 용융 풀 데이터의 결과를 사용하여 다른 FEA 소프트웨어에서 열 응력 및 왜곡 분석을 연구 할 수 있습니다.
DED (Directed Energy Deposition)는 레이저 또는 전자 빔과 같은 에너지 소스를 사용하여 가열 및 융합되는 와이어 또는 분말을 증착하여 부품을 만드는 적층 제조 공정입니다. FLOW-3D AM 은 분말 또는 와이어 이송 속도 및 크기 특성, 레이저 출력 및 스캔 속도와 같은 공정 매개 변수를 고려하여 DED 공정을 시뮬레이션 할 수 있습니다. 또한, 기판과 분말 재료의 서로 다른 합금에 대해 독립적 인 열 물리적 재료 특성을 정의하여 다중 재료 DED 프로세스를 시뮬레이션 할 수 있습니다.
레이저 물리학의 구현과 열 전달, 응고, 표면 장력, 차폐 가스 효과 및 반동 압력을 포함한 압력 효과를 통해 연구원은 결과 용접 비드의 강도 및 균일성에 대한 공정 매개 변수의 영향을 정확하게 분석 할 수 있습니다. 또한 이러한 시뮬레이션을 여러 레이어로 확장하여 후속 레이어 간의 융합을 분석 할 수 있습니다.
Electromagnetic metal casting (EMC) is a casting technique that uses electromagnetic energy to heat metal powders. It is a faster, cleaner, and less time-consuming operation. Solid metals create issues in electromagnetics since they reflect the electromagnetic radiation rather than consume it—electromagnetic energy processing results in sounded pieces with higher-ranking material properties and a more excellent microstructure solution. For the physical production of the electromagnetic casting process, knowledge of electromagnetic material interaction is critical. Even where the heated material is an excellent electromagnetic absorber, the total heating quality is sometimes insufficient. Numerical modelling works on finding the proper coupled effects between properties to bring out the most effective operation. The main parameters influencing the quality of output of the EMC process are: power dissipated per unit volume into the material, penetration depth of electromagnetics, complex magnetic permeability and complex dielectric permittivity. The contact mechanism and interference pattern also, in turn, determines the quality of the process. Only a few parameters, such as the environment’s temperature, the interference pattern, and the rate of metal solidification, can be controlled by AI models. Neural networks are used to achieve exact outcomes by stimulating the neurons in the human brain. Additive manufacturing (AM) is used to design mold and cores for metal casting. The models outperformed the traditional DFA optimization approach, which is susceptible to local minima. The system works only offline, so real-time analysis and corrections are not yet possible.
Korea Abstract
전자기 금속 주조 (EMC)는 전자기 에너지를 사용하여 금속 분말을 가열하는 주조 기술입니다. 더 빠르고 깨끗하며 시간이 덜 소요되는 작업입니다.
고체 금속은 전자기 복사를 소비하는 대신 반사하기 때문에 전자기학에서 문제를 일으킵니다. 전자기 에너지 처리는 더 높은 등급의 재료 특성과 더 우수한 미세 구조 솔루션을 가진 사운드 조각을 만듭니다.
전자기 주조 공정의 물리적 생산을 위해서는 전자기 물질 상호 작용에 대한 지식이 중요합니다. 가열된 물질이 우수한 전자기 흡수재인 경우에도 전체 가열 품질이 때때로 불충분합니다. 수치 모델링은 가장 효과적인 작업을 이끌어 내기 위해 속성 간의 적절한 결합 효과를 찾는데 사용됩니다.
EMC 공정의 출력 품질에 영향을 미치는 주요 매개 변수는 단위 부피당 재료로 분산되는 전력, 전자기의 침투 깊이, 복합 자기 투과성 및 복합 유전율입니다. 접촉 메커니즘과 간섭 패턴 또한 공정의 품질을 결정합니다. 환경 온도, 간섭 패턴 및 금속 응고 속도와 같은 몇 가지 매개 변수 만 AI 모델로 제어 할 수 있습니다.
신경망은 인간 뇌의 뉴런을 자극하여 정확한 결과를 얻기 위해 사용됩니다. 적층 제조 (AM)는 금속 주조용 몰드 및 코어를 설계하는 데 사용됩니다. 모델은 로컬 최소값에 영향을 받기 쉬운 기존 DFA 최적화 접근 방식을 능가했습니다. 이 시스템은 오프라인에서만 작동하므로 실시간 분석 및 수정은 아직 불가능합니다.
electromagnetic metal casting computation designs Fig1electromagnetic metal casting computation designs Fig2electromagnetic metal casting computation designs Fig3electromagnetic metal casting computation designs Fig4electromagnetic metal casting computation designs Fig5electromagnetic metal casting computation designs Fig6electromagnetic metal casting computation designs Fig7electromagnetic metal casting computation designs Fig8electromagnetic metal casting computation designs Fig9
References
1.J. Sun, W. Wang, Q. Yue, Review on electromagnetic-matter interaction fundamentals and efficient electromagnetic-associated heating strategies. Materials 9(4), 231 (2016). https://doi.org/10.3390/ma9040231ADSArticleGoogle Scholar
2.E. Ghasali, A. Fazili, M. Alizadeh, K. Shirvanimoghaddam, T. Ebadzadeh, Evaluation of microstructure and mechanical properties of Al-TiC metal matrix composite prepared by conventional, electromagnetic and spark plasma sintering methods. Materials 10(11), 1255 (2017). https://doi.org/10.3390/ma10111255ADSArticleGoogle Scholar
10.R. Singh, S. Singh, V. Mahajan, Investigations for dimensional accuracy of investment casting process after cycle time reduction by advancements in shell moulding. Procedia Mater. Sci. 6, 859–865 (2014). https://doi.org/10.1016/j.mspro.2014.07.103ArticleGoogle Scholar
19.V. Gangwar, S. Kumar, V. Singh, H. Singh, Effect of process parameters on hardness of AA-6063 in-situ electromagnetic casting by using taguchi method, in IOP Conference Series: Materials Science and Engineering, vol. 804(1) (IOP Publishing, 2020), p. 012019
20.X. Ye, S. Guo, L. Yang, J. Gao, J. Peng, T. Hu, L. Wang, M. Hou, Q. Luo, New utilization approach of electromagnetic thermal energy: preparation of metallic matrix diamond tool bit by electromagnetic hot-press sintering. J. Alloy. Compd. (2018). https://doi.org/10.1016/j.jallcom.2018.03.183ArticleGoogle Scholar
22.K.L. Glass, D.M. Ashby, U.S. Patent No. 9050656. (U.S. Patent and Trademark Office, Washington, DC, 2015)
23.S. Verma, P. Gupta, S. Srivastava, S. Kumar, A. Anand, An overview: casting/melting of non ferrous metallic materials using domestic electromagnetic oven. J. Mater. Sci. Mech. Eng. 4(4), (2017). p-ISSN: 2393-9095; e-ISSN: 2393-9109
24.S.S. Panda, V. Singh, A. Upadhyaya, D. Agrawal, Sintering response of austenitic (316L) and ferritic (434L) stainless steel consolidated in conventional and electromagnetic furnaces. Scripta Mater. 54(12), 2179–2183 (2006). https://doi.org/10.1016/j.scriptamat.2006.02.034ArticleGoogle Scholar
25.Y. Zhang, S. Yang, S. Wang, X. Liu, L. Li, Microwave/freeze casting assisted fabrication of carbon frameworks derived from embedded upholder in tremella for superior performance supercapacitors. Energy Storage Mater. (2018). https://doi.org/10.1016/j.ensm.2018.08.006ArticleGoogle Scholar
27.M.H. Awida, N. Shah, B. Warren, E. Ripley, A.E. Fathy, Modeling of an industrial Electromagnetic furnace for metal casting applications. 2008 IEEE MTT-S Int. Electromagn. Symp. Digest. (2008). https://doi.org/10.1109/mwsym.2008.4633143ArticleGoogle Scholar
29.E.B. Ripley, J.A. Oberhaus, WWWeb search power page-melting and heat treating metals using electromagnetic heating-the potential of electromagnetic metal processing techniques for a wide variety of metals and alloys is. Ind. Heat. 72(5), 65–70 (2005)Google Scholar
30.J. Campbell, Complete Casting Handbook: Metal Casting Processes, Metallurgy, Techniques and Design (Butterworth-Heinemann, 2015)Google Scholar
31.B. Ravi, Metal Casting: Computer-Aided Design and Analysis, 1st edn. (PHI Learning Ltd, 2005)Google Scholar
34.J. Ha, P. Cleary, V. Alguine, T. Nguyen, Simulation of die filling in gravity die casting using SPH and MAGMAsoft, in Proceedings of 2nd International Conference on CFD in Minerals & Process Industries (1999) pp. 423–428
35.M. Sirviö, M. Woś, Casting directly from a computer model by using advanced simulation software FLOW-3D Cast Ž. Arch. Foundry Eng. 9(1), 79–82 (2009)Google Scholar
38.EKK, Inc. Metal Casting Simulation Software and Consulting Services, CAPCAST Brochure
39.P. Muenprasertdee, Solidification modeling of iron castings using SOLIDCast (2007)
40.CasCAE, CT-CasTest Inc. Oy, Kerava
41.E. Dominguez-Tortajada, J. Monzo-Cabrera, A. Diaz-Morcillo, Uniform electric field distribution in electromagnetic heating applicators by means of genetic algorithms optimization of dielectric multilayer structures. IEEE Trans. Electromagn. Theory Tech. 55(1), 85–91 (2007). https://doi.org/10.1109/tmtt.2006.886913ADSArticleGoogle Scholar
42.B. Warren, M.H. Awida, A.E. Fathy, Electromagnetic heating of metals. IET Electromagn. Antennas Propag. 6(2), 196–205 (2012)ArticleGoogle Scholar
43.S. Ashouri, M. Nili-Ahmadabadi, M. Moradi, M. Iranpour, Semi-solid microstructure evolution during reheating of aluminum A356 alloy deformed severely by ECAP. J. Alloy. Compd. 466(1–2), 67–72 (2008). https://doi.org/10.1016/j.jallcom.2007.11.010ArticleGoogle Scholar
45.R.R. Mishra, A.K. Sharma, A review of research trends in electromagnetic processing of metal-based materials and opportunities in electromagnetic metal casting. Crit. Rev. Solid State Mater. Sci. 41(3), 217–255 (2016). https://doi.org/10.1080/10408436.2016.1142421ADSArticleGoogle Scholar
46.D.K. Ghodgaonkar, V.V. Varadan, V.K. Varadan, Free-space measurement of complex permittivity and complex permeability of magnetic materials at Electromagnetic frequencies. IEEE Trans. Instrum. Meas. 39(2), 387–394 (1990). https://doi.org/10.1109/19.52520ArticleGoogle Scholar
47.J. Baker-Jarvis, E.J. Vanzura, W.A. Kissick, Improved technique for determining complex permittivity with the transmission/reflection method. Microw. Theory Tech. IEEE Trans. 38, 1096–1103 (1990)ADSArticleGoogle Scholar
48.M. Bologna, A. Petri, B. Tellini, C. Zappacosta, Effective magnetic permeability measurementin composite resonator structures. Instrum. Meas. IEEE Trans. 59, 1200–1206 (2010)ArticleGoogle Scholar
49.B. Ravi, G.L. Datta, Metal casting–back to future, in 52nd Indian Foundry Congress, (2004)
51.H. Sekiguchi, Y. Mori, Steam plasma reforming using Electromagnetic discharge. Thin Solid Films 435, 44–48 (2003)ADSArticleGoogle Scholar
52.J. Sun, W. Wang, C. Zhao, Y. Zhang, C. Ma, Q. Yue, Study on the coupled effect of wave absorption and metal discharge generation under electromagnetic irradiation. Ind. Eng. Chem. Res. 53, 2042–2051 (2014)ArticleGoogle Scholar
56.B. Ravi, Metal Casting: Computer-Aided Design and Analysis. (PHI Learning Pvt. Ltd., 2005)
57.J.H. Lee, S.D. Noh, H.-J. Kim, Y.-S. Kang, Implementation of cyber-physical production systems for quality prediction and operation control in metal casting. Sensors 18, 1428 (2018). https://doi.org/10.3390/s18051428ADSArticleGoogle Scholar
58.B. Aksoy, M. Koru, Estimation of casting mold interfacial heat transfer coefficient in pressure die casting process by artificial intelligence methods. Arab. J. Sci. Eng. 45, 8969–8980 (2020). https://doi.org/10.1007/s13369-020-04648-7ArticleGoogle Scholar
61.W. Chen, B. Gutmann, C.O. Kappe, Characterization of electromagnetic-induced electric discharge phenomena in metal-solvent mixtures. ChemistryOpen 1, 39–48 (2012)ArticleGoogle Scholar
62.J. Walker, A. Prokop, C. Lynagh, B. Vuksanovich, B. Conner, K. Rogers, J. Thiel, E. MacDonald, Real-time process monitoring of core shifts during metal casting with wireless sensing and 3D sand printing. Addit. Manuf. (2019). https://doi.org/10.1016/j.addma.2019.02.018ArticleGoogle Scholar
63.G.C. Manjunath Patel, A.K. Shettigar, M.B. Parappagoudar, A systematic approach to model and optimize wear behaviour of castings produced by squeeze casting process. J. Manuf. Process. 32, 199–212 (2018). https://doi.org/10.1016/j.jmapro.2018.02.004ArticleGoogle Scholar
64.G.C. Manjunath Patel, P. Krishna, M.B. Parappagoudar, An intelligent system for squeeze casting process—soft computing based approach. Int. J. Adv. Manuf. Technol. 86, 3051–3065 (2016). https://doi.org/10.1007/s00170-016-8416-8ArticleGoogle Scholar
65.M. Ferguson, R. Ak, Y.T. Lee, K.H. Law, Automatic localization of casting defects with convolutional neural networks, in 2017 IEEE International Conference on Big Data (Big Data) (Boston, MA, USA, 2017), pp. 1726–1735. https://doi.org/10.1109/BigData.2017.8258115.
67.G.C. ManjunathPatel, A.K. Shettigar, P. Krishna, M.B. Parappagoudar, Back propagation genetic and recurrent neural network applications in modelling and analysis of squeeze casting process. Appl. Soft Comput. 59, 418–437 (2017). https://doi.org/10.1016/j.asoc.2017.06.018ArticleGoogle Scholar
69.E. Mares, J. Sokolowski, Artificial intelligence-based control system for the analysis of metal casting properties. J. Achiev. Mater. Manuf. Eng. 40, 149–154 (2010)Google Scholar
70.K.S. Senthil, S. Muthukumaran, C. Chandrasekhar Reddy, Suitability of friction welding of tube to tube plate using an external tool process for different tube diameters—a study. Exp. Tech. 37(6), 8–14 (2013)ArticleGoogle Scholar
72.K.S. Senthil, D.A. Daniel, An investigation of boiler grade tube and tube plate without block by using friction welding process. Mater. Today Proc. 5(2), 8567–8576 (2018)ArticleGoogle Scholar
73.E. Hetmaniok, D. Słota, A. Zielonka, Restoration of the cooling conditions in a three-dimensional continuous casting process using artificial intelligence algorithms. Appl. Math. Modell. 39(16), 4797–4807 (2015). https://doi.org/10.1016/j.apm.2015.03.056ArticleMATHGoogle Scholar
74.C.V. Kumar, S. Muthukumaran, A. Pradeep, S.S. Kumaran, Optimizational study of friction welding of steel tube to aluminum tube plate using an external tool process. Int. J. Mech. Mater. Eng. 6(2), 300–306 (2011)Google Scholar
75.T. Adithiyaa, D. Chandramohan, T. Sathish, Optimal prediction of process parameters by GWO-KNN in stirring-squeeze casting of AA2219 reinforced metal matrix composites. Mater. Today Proc. 150, 1598 (2020). https://doi.org/10.1016/j.matpr.2019.10.051ArticleGoogle Scholar
76.B.P. Pehrson, A.F. Moore (2014). U.S. Patent No. 8708031 (U.S. Patent and Trademark Office, Washington, DC, 2014)
77.Liu, J., & Rynerson, M. L. (2008). U.S. Patent No. 7,461,684. Washington, DC: U.S. Patent and Trademark Office.
79.R.R. Mishra, A.K. Sharma, Effect of solidification environment on microstructure and indentation hardness of Al–Zn–Mg alloy casts developed using electromagnetic heating. Int. J. Metal Cast. 10, 1–13 (2017). https://doi.org/10.1007/s40962-017-0176-1ArticleGoogle Scholar
84.M.P. Reddy, R.A. Shakoor, G. Parande, V. Manakari, F. Ubaid, A.M.A. Mohamed, M. Gupta, Enhanced performance of nano-sized SiC reinforced Al metal matrix nanocomposites synthesized through electromagnetic sintering and hot extrusion techniques. Prog. Nat. Sci. Mater. Int. 27(5), 606–614 (2017). https://doi.org/10.1016/j.pnsc.2017.08.015ArticleGoogle Scholar
86.V. Bist, A.K. Sharma, P. Kumar, Development and microstructural characterisations of the lead casting using electromagnetic technology. Manager’s J. Mech. Eng. 4(4), 6 (2014). https://doi.org/10.26634/jme.4.4.2840ArticleGoogle Scholar
87.A. Sharma, A. Chouhan, L. Pavithran, U. Chadha, S.K. Selvaraj, Implementation of LSS framework in automotive component manufacturing: a review, current scenario and future directions. Mater Today: Proc. (2021). https://doi.org/10.1016/J.MATPR.2021.02.374ArticleGoogle Scholar
Surface roughness of laser powder bed fusion (L-PBF) printed overhang regions is a major contributor to deteriorated shape accuracy/surface quality. This study investigates the mechanisms behind the evolution of surface roughness (Ra) in overhang regions. The evolution of surface morphology is the result of a combination of border track contour, powder adhesion, warp deformation, and dross formation, which is strongly related to the overhang angle (θ). When 0° ≤ θ ≤ 15°, the overhang angle does not affect Ra significantly since only a small area of the melt pool boundaries contacts the powder bed resulting in slight powder adhesion. When 15° < θ ≤ 50°, powder adhesion is enhanced by the melt pool sinking and the increased contact area between the melt pool boundary and powder bed. When θ > 50°, large waviness of the overhang contour, adhesion of powder clusters, severe warp deformation and dross formation increase Ra sharply.
레이저 파우더 베드 퓨전 (L-PBF) 프린팅 오버행 영역의 표면 거칠기는 형상 정확도 / 표면 품질 저하의 주요 원인입니다. 이 연구 는 오버행 영역에서 표면 거칠기 (Ra ) 의 진화 뒤에 있는 메커니즘을 조사합니다 . 표면 형태의 진화는 오버행 각도 ( θ ) 와 밀접한 관련이있는 경계 트랙 윤곽, 분말 접착, 뒤틀림 변형 및 드로스 형성의 조합의 결과입니다 . 0° ≤ θ ≤ 15° 인 경우 , 용융풀 경계의 작은 영역 만 분말 베드와 접촉하여 약간의 분말 접착이 발생하기 때문에 오버행 각도가 R a에 큰 영향을 주지 않습니다 . 15° < θ 일 때 ≤ 50°, 용융 풀 싱킹 및 용융 풀 경계와 분말 베드 사이의 증가된 접촉 면적으로 분말 접착력이 향상됩니다. θ > 50° 일 때 오버행 윤곽의 큰 파형, 분말 클러스터의 접착, 심한 휨 변형 및 드 로스 형성이 Ra 급격히 증가 합니다.
KEYWORDS: Laser powder bed fusion (L-PBF), melt pool dynamics, overhang region, shape deviation, surface roughness
1. Introduction
레이저 분말 베드 융합 (L-PBF)은 첨단 적층 제조 (AM) 기술로, 집중된 레이저 빔을 사용하여 금속 분말을 선택적으로 융합하여 슬라이스 된 3D 컴퓨터 지원에 따라 층별로 3 차원 (3D) 금속 부품을 구축합니다. 설계 (CAD) 모델 (Chatham, Long 및 Williams 2019 ; Tan, Zhu 및 Zhou 2020 ). 재료가 인쇄 층 아래에 존재하는지 여부에 따라 인쇄 영역은 각각 솔리드 영역 또는 돌출 영역으로 분류 될 수 있습니다. 따라서 오버행 영역은 고체 기판이 아니라 분말 베드 바로 위에 건설되는 특수 구조입니다 (Patterson, Messimer 및 Farrington 2017). 오버행 영역은지지 구조를 포함하거나 포함하지 않고 구축 할 수 있으며, 지지대가있는 돌출 영역의 L-PBF는 지지체가 더 낮은 밀도로 구축된다는 점을 제외 하고 (Wang and Chou 2018 ) 고체 기판의 공정과 유사합니다 (따라서 기계적 강도가 낮기 때문에 L-PBF 공정 후 기계적으로 쉽게 제거 할 수 있습니다. 따라서지지 구조로 인쇄 된 오버행 영역은 L-PBF 공정 후 지지물 제거, 연삭 및 연마와 같은 추가 후 처리 단계가 필요합니다.
수평 내부 채널의 제작과 같은 일부 특정 경우에는 공정 후 지지대를 제거하기가 어려우므로 채널 상단 절반의 돌출부 영역을 지지대없이 건설해야합니다 (Hopkinson and Dickens 2000 ). 수평 내부 채널에 사용할 수없는지지 구조 외에도 내부 표면, 특히 등각 냉각 채널 (Feng, Kamat 및 Pei 2021 ) 에서 발생하는 복잡한 3D 채널 네트워크의 경우 표면 마감 프로세스를 구현하는 것도 어렵습니다 . 결과적으로 오버행 영역은 (i) 잔류 응력에 의한 변형, (ii) 계단 효과 (Kuo et al. 2020 ; Li et al. 2020 )로 인해 설계된 모양에서 벗어날 수 있습니다 .) 및 (iii) 원하지 않는 분말 소결로 인한 향상된 표면 거칠기; 여기서, 앞의 두 요소는 일반적으로 mm 길이 스케일에서 ‘매크로’편차로 분류되고 후자는 일반적으로 µm 길이 스케일에서 ‘마이크로’편차로 인식됩니다.
열 응력에 의한 변형은 오버행 영역에서 발생하는 중요한 문제입니다 (Patterson, Messimer 및 Farrington 2017 ). 국부적 인 용융 / 냉각은 용융 풀 내부 및 주변에서 큰 온도 구배를 유도하여 응고 된 층에 집중적 인 열 응력을 유발합니다. 열 응력에 의한 뒤틀림은 고체 영역을 현저하게 변형하지 않습니다. 이러한 영역은 아래의 여러 레이어에 의해 제한되기 때문입니다. 반면에 오버행 영역은 구속되지 않고 공정 중 응력 완화로 인해 상당한 변형이 발생합니다 (Kamat 및 Pei 2019 ). 더욱이 용융 깊이는 레이어 두께보다 큽니다 (이전 레이어도 재용 해되어 빌드 된 레이어간에 충분한 결합을 보장하기 때문입니다 [Yadroitsev et al. 2013 ; Kamath et al.2014 ]),응고 된 두께가 설계된 두께보다 크기 때문에형태 편차 (예 : 드 로스 [Charles et al. 2020 ; Feng et al. 2020 ])가 발생합니다. 마이크로 스케일에서 인쇄 된 표면 (R a 및 S a ∼ 10 μm)은 기계적으로 가공 된 표면보다 거칠다 (Duval-Chaneac et al. 2018 ; Wen et al. 2018 ). 이 문제는고형화 된 용융 풀의 가장자리에 부착 된 용융되지 않은 분말의 결과로 표면 거칠기 (R a )가 일반적으로 약 20 μm인 오버행 영역에서 특히 심각합니다 (Mazur et al. 2016 ; Pakkanen et al. 2016 ).
오버행 각도 ( θ , 빌드 방향과 관련하여 측정)는 오버행 영역의 뒤틀림 편향과 표면 거칠기에 영향을 미치는 중요한 매개 변수입니다 (Kamat and Pei 2019 ; Mingear et al. 2019 ). θ ∼ 45 ° 의 오버행 각도 는 일반적으로지지 구조없이 오버행 영역을 인쇄 할 수있는 임계 값으로 합의됩니다 (Pakkanen et al. 2016 ; Kadirgama et al. 2018 ). θ 일 때이 임계 값보다 크면 오버행 영역을 허용 가능한 표면 품질로 인쇄 할 수 없습니다. 오버행 각도 외에도 레이저 매개 변수 (레이저 에너지 밀도와 관련된)는 용융 풀의 모양 / 크기 및 용융 풀 역학에 영향을줌으로써 오버행 영역의 표면 거칠기에 영향을줍니다 (Wang et al. 2013 ; Mingear et al . 2019 ).
용융 풀 역학은 고체 (Shrestha 및 Chou 2018 ) 및 오버행 (Le et al. 2020 ) 영역 모두에서 수행되는 L-PBF 공정을 포함한 레이저 재료 가공의 일반적인 물리적 현상입니다 . 용융 풀 모양, 크기 및 냉각 속도는 잔류 응력으로 인한 변형과 표면 거칠기에 모두 영향을 미치므로 처리 매개 변수와 표면 형태 / 품질 사이의 다리 역할을하며 용융 풀을 이해하기 위해 수치 시뮬레이션을 사용하여 추가 조사를 수행 할 수 있습니다. 거동과 표면 거칠기에 미치는 영향. 현재까지 고체 영역의 L-PBF 동안 용융 풀 동작을 시뮬레이션하기 위해 여러 연구가 수행되었습니다. 유한 요소 방법 (FEM)과 같은 시뮬레이션 기술 (Roberts et al. 2009 ; Du et al.2019 ), 유한 차분 법 (FDM) (Wu et al. 2018 ), 전산 유체 역학 (CFD) (Lee and Zhang 2016 ), 임의의 Lagrangian-Eulerian 방법 (ALE) (Khairallah and Anderson 2014 )을 사용하여 증발 반동 압력 (Hu et al. 2018 ) 및 Marangoni 대류 (Zhang et al. 2018 ) 현상을포함하는 열 전달 (온도 장) 및 물질 전달 (용융 흐름) 프로세스. 또한 이산 요소법 (DEM)을 사용하여 무작위 분산 분말 베드를 생성했습니다 (Lee and Zhang 2016 ; Wu et al. 2018 ). 이 모델은 분말 규모의 L-PBF 공정을 시뮬레이션했습니다 (Khairallah et al. 2016) 메조 스케일 (Khairallah 및 Anderson 2014 ), 단일 트랙 (Leitz et al. 2017 )에서 다중 트랙 (Foroozmehr et al. 2016 ) 및 다중 레이어 (Huang, Khamesee 및 Toyserkani 2019 )로.
그러나 결과적인 표면 거칠기를 결정하는 오버행 영역의 용융 풀 역학은 문헌에서 거의 관심을받지 못했습니다. 솔리드 영역의 L-PBF에 대한 기존 시뮬레이션 모델이 어느 정도 참조가 될 수 있지만 오버행 영역과 솔리드 영역 간의 용융 풀 역학에는 상당한 차이가 있습니다. 오버행 영역에서 용융 금속은 분말 입자 사이의 틈새로 아래로 흘러 용융 풀이 다공성 분말 베드가 제공하는 약한 지지체 아래로 가라 앉습니다. 이것은 중력과 표면 장력의 영향이 용융 풀의 결과적인 모양 / 크기를 결정하는 데 중요하며, 결과적으로 오버행 영역의 마이크로 스케일 형태의 진화에 중요합니다. 또한 분말 입자 사이의 공극, 열 조건 (예 : 에너지 흡수,2019 ; Karimi et al. 2020 ; 노래와 영 2020 ). 표면 거칠기는 (마이크로) 형상 편차를 증가시킬뿐만 아니라 주기적 하중 동안 미세 균열의 시작 지점 역할을함으로써 기계적 강도를 저하시킵니다 (Günther et al. 2018 ). 오버행 영역의 높은 표면 거칠기는 (마이크로) 정확도 / 품질에 대한 엄격한 요구 사항이있는 부품 제조에서 L-PBF의 적용을 제한합니다.
본 연구는 실험 및 시뮬레이션 연구를 사용하여 오버행 영역 (지지물없이 제작)의 미세 형상 편차 형성 메커니즘과 표면 거칠기의 기원을 체계적이고 포괄적으로 조사합니다. 결합 된 DEM-CFD 시뮬레이션 모델은 경계 트랙 윤곽, 분말 접착 및 뒤틀림 변형의 효과를 고려하여 오버행 영역의 용융 풀 역학과 표면 형태의 형성 메커니즘을 나타 내기 위해 개발되었습니다. 표면 거칠기 R의 시뮬레이션 및 단일 요인 L-PBF 인쇄 실험을 사용하여 오버행 각도의 함수로 연구됩니다. 용융 풀의 침몰과 관련된 오버행 영역에서 분말 접착의 세 가지 메커니즘이 식별되고 자세히 설명됩니다. 마지막으로, 인쇄 된 오버행 영역에서 높은 표면 거칠기 문제를 완화 할 수 있는 잠재적 솔루션에 대해 간략하게 설명합니다.
The shape and size of the L-PBF printed samples are illustrated in Figure 1Figure 2. Borders in the overhang region depending on the overhang angle θFigure 3. (a) Profile of the volumetric heat source, (b) the model geometry of single-track printing on a solid substrate (unit: µm), and (c) the comparison of melt pool dimensions obtained from the experiment (right half) and simulation (left half) for a calibrated optical penetration depth of 110 µm (laser power 200 W and scan speed 800 mm/s, solidified layer thickness 30 µm, powder size 10–45 µm).Figure 4. The model geometry of an overhang being L-PBF processed: (a) 3D view and (b) right view.Figure 5. The cross-sectional contour of border tracks in a 45° overhang region.Figure 6. Evolution of melt pool in the overhang region (θ = 45°, P = 100 W, v = 1000 mm/s, the streamlines are shown by arrows).Figure 7. The overhang contour is contributed by (a) only outer borders when θ ≤ 60° (b) both inner borders and outer borders when θ > 60°.Figure 8. Schematic of powder adhesion on a 45° overhang region.Figure 9. The L-PBF printed samples with various overhang angle (a) θ = 0° (cube), (b) θ = 30°, (c) θ = 45°, (d) θ = 55° and (e) θ = 60°.Figure 10. Two mechanisms of powder adhesion related to the overhang angle: (a) simulation-predicted, θ = 45°; (b) simulation-predicted, θ = 60°; (c, e) optical micrographs, θ = 45°; (d, f) optical micrographs, θ = 60°. (e) and (f) are partial enlargement of (c) and (d), respectively.Figure 11. Simulation-predicted surface morphology in the overhang region at different overhang angle: (a) θ = 15°, (b) θ = 30°, (c) θ = 45°, (d) θ = 60° and (e) θ = 80° (Blue solid lines: simulation-predicted contour; red dashed lines: the planar profile of designed overhang region specified by the overhang angles).Figure 12. Effect of overhang angle on surface roughness Ra in overhang regionsFigure 13. Surface morphology of L-PBF printed overhang regions with different overhang angle: (a) θ = 15°, (b) θ = 30°, (c) θ = 45° and (d) θ = 60° (overhang border parameters: P = 100 W, v = 1000 mm/s).Figure 14. Effect of (a) laser power (scan speed = 1000 mm/s) and (b) scan speed (lase power = 100 W) on surface roughness Ra in overhang regions (θ = 45°, laser power and scan speed referred to overhang border parameters, and the other process parameters are listed in Table 2).
References
Cai, Chao, Chrupcala Radoslaw, Jinliang Zhang, Qian Yan, Shifeng Wen, Bo Song, and Yusheng Shi. 2019. “In-Situ Preparation and Formation of TiB/Ti-6Al-4V Nanocomposite via Laser Additive Manufacturing: Microstructure Evolution and Tribological Behavior.” Powder Technology 342: 73–84. doi:10.1016/j.powtec.2018.09.088. [Crossref], [Web of Science ®], [Google Scholar]
Cai, Chao, Wei Shian Tey, Jiayao Chen, Wei Zhu, Xingjian Liu, Tong Liu, Lihua Zhao, and Kun Zhou. 2021. “Comparative Study on 3D Printing of Polyamide 12 by Selective Laser Sintering and Multi Jet Fusion.” Journal of Materials Processing Technology 288 (August 2020): 116882. doi:10.1016/j.jmatprotec.2020.116882. [Crossref], [Web of Science ®], [Google Scholar]
Cai, Chao, Xu Wu, Wan Liu, Wei Zhu, Hui Chen, Jasper Dong Qiu Chua, Chen Nan Sun, Jie Liu, Qingsong Wei, and Yusheng Shi. 2020. “Selective Laser Melting of Near-α Titanium Alloy Ti-6Al-2Zr-1Mo-1V: Parameter Optimization, Heat Treatment and Mechanical Performance.” Journal of Materials Science and Technology 57: 51–64. doi:10.1016/j.jmst.2020.05.004. [Crossref], [Web of Science ®], [Google Scholar]
Charles, Amal, Ahmed Elkaseer, Lore Thijs, and Steffen G. Scholz. 2020. “Dimensional Errors Due to Overhanging Features in Laser Powder Bed Fusion Parts Made of Ti-6Al-4V.” Applied Sciences 10 (7): 2416. doi:10.3390/app10072416. [Crossref], [Google Scholar]
Chatham, Camden A., Timothy E. Long, and Christopher B. Williams. 2019. “A Review of the Process Physics and Material Screening Methods for Polymer Powder Bed Fusion Additive Manufacturing.” Progress in Polymer Science 93: 68–95. doi:10.1016/j.progpolymsci.2019.03.003. [Crossref], [Web of Science ®], [Google Scholar]
Du, Yang, Xinyu You, Fengbin Qiao, Lijie Guo, and Zhengwu Liu. 2019. “A Model for Predicting the Temperature Field during Selective Laser Melting.” Results in Physics 12 (November 2018): 52–60. doi:10.1016/j.rinp.2018.11.031. [Crossref], [Web of Science ®], [Google Scholar]
Duval-Chaneac, M. S., S. Han, C. Claudin, F. Salvatore, J. Bajolet, and J. Rech. 2018. “Experimental Study on Finishing of Internal Laser Melting (SLM) Surface with Abrasive Flow Machining (AFM).” Precision Engineering 54 (July 2017): 1–6. doi:10.1016/j.precisioneng.2018.03.006. [Crossref], [Web of Science ®], [Google Scholar]
Feng, Shaochuan, Shijie Chen, Amar M. Kamat, Ru Zhang, Mingji Huang, and Liangcai Hu. 2020. “Investigation on Shape Deviation of Horizontal Interior Circular Channels Fabricated by Laser Powder Bed Fusion.” Additive Manufacturing 36 (December): 101585. doi:10.1016/j.addma.2020.101585. [Crossref], [Web of Science ®], [Google Scholar]
Feng, Shaochuan, Chuanzhen Huang, Jun Wang, Hongtao Zhu, Peng Yao, and Zhanqiang Liu. 2017. “An Analytical Model for the Prediction of Temperature Distribution and Evolution in Hybrid Laser-Waterjet Micro-Machining.” Precision Engineering 47: 33–45. doi:10.1016/j.precisioneng.2016.07.002. [Crossref], [Web of Science ®], [Google Scholar]
Feng, Shaochuan, Amar M. Kamat, and Yutao Pei. 2021. “Design and Fabrication of Conformal Cooling Channels in Molds: Review and Progress Updates.” International Journal of Heat and Mass Transfer. doi:10.1016/j.ijheatmasstransfer.2021.121082. [Crossref], [PubMed], [Web of Science ®], [Google Scholar]
Flow-3D V11.2 Documentation. 2016. Flow Science, Inc. [Crossref], [Google Scholar]
Foroozmehr, Ali, Mohsen Badrossamay, Ehsan Foroozmehr, and Sa’id Golabi. 2016. “Finite Element Simulation of Selective Laser Melting Process Considering Optical Penetration Depth of Laser in Powder Bed.” Materials and Design 89: 255–263. doi:10.1016/j.matdes.2015.10.002. [Crossref], [Web of Science ®], [Google Scholar]
“Geometrical Product Specifications (GPS) — Surface Texture: Profile Method — Rules and Procedures for the Assessment of Surface Texture (ISO 4288).” 1996. International Organization for Standardization. https://www.iso.org/standard/2096.html. [Google Scholar]
Günther, Johannes, Stefan Leuders, Peter Koppa, Thomas Tröster, Sebastian Henkel, Horst Biermann, and Thomas Niendorf. 2018. “On the Effect of Internal Channels and Surface Roughness on the High-Cycle Fatigue Performance of Ti-6Al-4V Processed by SLM.” Materials & Design 143: 1–11. doi:10.1016/j.matdes.2018.01.042. [Crossref], [Web of Science ®], [Google Scholar]
Hopkinson, Neil, and Phill Dickens. 2000. “Conformal Cooling and Heating Channels Using Laser Sintered Tools.” In Solid Freeform Fabrication Conference, 490–497. Texas. doi:10.26153/tsw/3075. [Crossref], [Google Scholar]
Hu, Zhiheng, Haihong Zhu, Changchun Zhang, Hu Zhang, Ting Qi, and Xiaoyan Zeng. 2018. “Contact Angle Evolution during Selective Laser Melting.” Materials and Design 139: 304–313. doi:10.1016/j.matdes.2017.11.002. [Crossref], [Web of Science ®], [Google Scholar]
Hu, Cheng, Kejia Zhuang, Jian Weng, and Donglin Pu. 2019. “Three-Dimensional Analytical Modeling of Cutting Temperature for Round Insert Considering Semi-Infinite Boundary and Non-Uniform Heat Partition.” International Journal of Mechanical Sciences 155 (October 2018): 536–553. doi:10.1016/j.ijmecsci.2019.03.019. [Crossref], [Web of Science ®], [Google Scholar]
Huang, Yuze, Mir Behrad Khamesee, and Ehsan Toyserkani. 2019. “A New Physics-Based Model for Laser Directed Energy Deposition (Powder-Fed Additive Manufacturing): From Single-Track to Multi-Track and Multi-Layer.” Optics & Laser Technology 109 (August 2018): 584–599. doi:10.1016/j.optlastec.2018.08.015. [Crossref], [Web of Science ®], [Google Scholar]
Kadirgama, K., W. S. W. Harun, F. Tarlochan, M. Samykano, D. Ramasamy, Mohd Zaidi Azir, and H. Mehboob. 2018. “Statistical and Optimize of Lattice Structures with Selective Laser Melting (SLM) of Ti6AL4V Material.” International Journal of Advanced Manufacturing Technology 97 (1–4): 495–510. doi:10.1007/s00170-018-1913-1. [Crossref], [Web of Science ®], [Google Scholar]
Kamat, Amar M, and Yutao Pei. 2019. “An Analytical Method to Predict and Compensate for Residual Stress-Induced Deformation in Overhanging Regions of Internal Channels Fabricated Using Powder Bed Fusion.” Additive Manufacturing 29 (March): 100796. doi:10.1016/j.addma.2019.100796. [Crossref], [Web of Science ®], [Google Scholar]
Kamath, Chandrika, Bassem El-Dasher, Gilbert F. Gallegos, Wayne E. King, and Aaron Sisto. 2014. “Density of Additively-Manufactured, 316L SS Parts Using Laser Powder-Bed Fusion at Powers up to 400 W.” International Journal of Advanced Manufacturing Technology 74 (1–4): 65–78. doi:10.1007/s00170-014-5954-9. [Crossref], [Web of Science ®], [Google Scholar]
Karimi, J., C. Suryanarayana, I. Okulov, and K. G. Prashanth. 2020. “Selective Laser Melting of Ti6Al4V: Effect of Laser Re-Melting.” Materials Science and Engineering A (July): 140558. doi:10.1016/j.msea.2020.140558. [Crossref], [Web of Science ®], [Google Scholar]
Khairallah, Saad A., and Andy Anderson. 2014. “Mesoscopic Simulation Model of Selective Laser Melting of Stainless Steel Powder.” Journal of Materials Processing Technology 214 (11): 2627–2636. doi:10.1016/j.jmatprotec.2014.06.001. [Crossref], [Web of Science ®], [Google Scholar]
Khairallah, Saad A., Andrew T. Anderson, Alexander Rubenchik, and Wayne E. King. 2016. “Laser Powder-Bed Fusion Additive Manufacturing: Physics of Complex Melt Flow and Formation Mechanisms of Pores, Spatter, and Denudation Zones.” Edited by Adedeji B. Badiru, Vhance V. Valencia, and David Liu. Acta Materialia 108 (April): 36–45. doi:10.1016/j.actamat.2016.02.014. [Crossref], [Web of Science ®], [Google Scholar]
Kuo, C. N., C. K. Chua, P. C. Peng, Y. W. Chen, S. L. Sing, S. Huang, and Y. L. Su. 2020. “Microstructure Evolution and Mechanical Property Response via 3D Printing Parameter Development of Al–Sc Alloy.” Virtual and Physical Prototyping 15 (1): 120–129. doi:10.1080/17452759.2019.1698967. [Taylor & Francis Online], [Web of Science ®], [Google Scholar]
Le, K. Q., C. H. Wong, K. H. G. Chua, C. Tang, and H. Du. 2020. “Discontinuity of Overhanging Melt Track in Selective Laser Melting Process.” International Journal of Heat and Mass Transfer 162 (December): 120284. doi:10.1016/j.ijheatmasstransfer.2020.120284. [Crossref], [Web of Science ®], [Google Scholar]
Lee, Y. S., and W. Zhang. 2016. “Modeling of Heat Transfer, Fluid Flow and Solidification Microstructure of Nickel-Base Superalloy Fabricated by Laser Powder Bed Fusion.” Additive Manufacturing 12: 178–188. doi:10.1016/j.addma.2016.05.003. [Crossref], [Web of Science ®], [Google Scholar]
Leitz, K. H., P. Singer, A. Plankensteiner, B. Tabernig, H. Kestler, and L. S. Sigl. 2017. “Multi-Physical Simulation of Selective Laser Melting.” Metal Powder Report 72 (5): 331–338. doi:10.1016/j.mprp.2016.04.004. [Crossref], [Google Scholar]
Li, Jian, Jing Hu, Yi Zhu, Xiaowen Yu, Mengfei Yu, and Huayong Yang. 2020. “Surface Roughness Control of Root Analogue Dental Implants Fabricated Using Selective Laser Melting.” Additive Manufacturing 34 (September 2019): 101283. doi:10.1016/j.addma.2020.101283. [Crossref], [Web of Science ®], [Google Scholar]
Li, Yingli, Kun Zhou, Pengfei Tan, Shu Beng Tor, Chee Kai Chua, and Kah Fai Leong. 2018. “Modeling Temperature and Residual Stress Fields in Selective Laser Melting.” International Journal of Mechanical Sciences 136 (February): 24–35. doi:10.1016/j.ijmecsci.2017.12.001. [Crossref], [Web of Science ®], [Google Scholar]
Mazur, MacIej, Martin Leary, Matthew McMillan, Joe Elambasseril, and Milan Brandt. 2016. “SLM Additive Manufacture of H13 Tool Steel with Conformal Cooling and Structural Lattices.” Rapid Prototyping Journal 22 (3): 504–518. doi:10.1108/RPJ-06-2014-0075. [Crossref], [Web of Science ®], [Google Scholar]
Mingear, Jacob, Bing Zhang, Darren Hartl, and Alaa Elwany. 2019. “Effect of Process Parameters and Electropolishing on the Surface Roughness of Interior Channels in Additively Manufactured Nickel-Titanium Shape Memory Alloy Actuators.” Additive Manufacturing 27 (October 2018): 565–575. doi:10.1016/j.addma.2019.03.027. [Crossref], [Web of Science ®], [Google Scholar]
Pakkanen, Jukka, Flaviana Calignano, Francesco Trevisan, Massimo Lorusso, Elisa Paola Ambrosio, Diego Manfredi, and Paolo Fino. 2016. “Study of Internal Channel Surface Roughnesses Manufactured by Selective Laser Melting in Aluminum and Titanium Alloys.” Metallurgical and Materials Transactions A 47 (8): 3837–3844. doi:10.1007/s11661-016-3478-7. [Crossref], [Web of Science ®], [Google Scholar]
Patterson, Albert E., Sherri L. Messimer, and Phillip A. Farrington. 2017. “Overhanging Features and the SLM/DMLS Residual Stresses Problem: Review and Future Research Need.” Technologies 5 (4): 15. doi:10.3390/technologies5020015. [Crossref], [Web of Science ®], [Google Scholar]
Roberts, I. A., C. J. Wang, R. Esterlein, M. Stanford, and D. J. Mynors. 2009. “A Three-Dimensional Finite Element Analysis of the Temperature Field during Laser Melting of Metal Powders in Additive Layer Manufacturing.” International Journal of Machine Tools and Manufacture 49 (12–13): 916–923. doi:10.1016/j.ijmachtools.2009.07.004. [Crossref], [Web of Science ®], [Google Scholar]
Shrestha, Subin, and Kevin Chou. 2018. “Computational Analysis of Thermo-Fluid Dynamics with Metallic Powder in SLM.” In CFD Modeling and Simulation in Materials Processing 2018, edited by Laurentiu Nastac, Koulis Pericleous, Adrian S. Sabau, Lifeng Zhang, and Brian G. Thomas, 85–95. Cham, Switzerland: Springer Nature. doi:10.1007/978-3-319-72059-3_9. [Crossref], [Google Scholar]
Sing, S. L., and W. Y. Yeong. 2020. “Laser Powder Bed Fusion for Metal Additive Manufacturing: Perspectives on Recent Developments.” Virtual and Physical Prototyping 15 (3): 359–370. doi:10.1080/17452759.2020.1779999. [Taylor & Francis Online], [Web of Science ®], [Google Scholar]
Šmilauer, Václav, Emanuele Catalano, Bruno Chareyre, Sergei Dorofeenko, Jérôme Duriez, Nolan Dyck, Jan Eliáš, et al. 2015. Yade Documentation. 2nd ed. The Yade Project. doi:10.5281/zenodo.34073. [Crossref], [Google Scholar]
Tan, Pengfei, Fei Shen, Biao Li, and Kun Zhou. 2019. “A Thermo-Metallurgical-Mechanical Model for Selective Laser Melting of Ti6Al4V.” Materials & Design 168 (April): 107642. doi:10.1016/j.matdes.2019.107642. [Crossref], [Web of Science ®], [Google Scholar]
Tan, Lisa Jiaying, Wei Zhu, and Kun Zhou. 2020. “Recent Progress on Polymer Materials for Additive Manufacturing.” Advanced Functional Materials 30 (43): 1–54. doi:10.1002/adfm.202003062. [Crossref], [Web of Science ®], [Google Scholar]
Wang, Xiaoqing, and Kevin Chou. 2018. “Effect of Support Structures on Ti-6Al-4V Overhang Parts Fabricated by Powder Bed Fusion Electron Beam Additive Manufacturing.” Journal of Materials Processing Technology 257 (February): 65–78. doi:10.1016/j.jmatprotec.2018.02.038. [Crossref], [Web of Science ®], [Google Scholar]
Wang, Di, Yongqiang Yang, Ziheng Yi, and Xubin Su. 2013. “Research on the Fabricating Quality Optimization of the Overhanging Surface in SLM Process.” International Journal of Advanced Manufacturing Technology 65 (9–12): 1471–1484. doi:10.1007/s00170-012-4271-4. [Crossref], [Web of Science ®], [Google Scholar]
Wen, Peng, Maximilian Voshage, Lucas Jauer, Yanzhe Chen, Yu Qin, Reinhart Poprawe, and Johannes Henrich Schleifenbaum. 2018. “Laser Additive Manufacturing of Zn Metal Parts for Biodegradable Applications: Processing, Formation Quality and Mechanical Properties.” Materials and Design 155: 36–45. doi:10.1016/j.matdes.2018.05.057. [Crossref], [Web of Science ®], [Google Scholar]
Wu, Yu-che, Cheng-hung San, Chih-hsiang Chang, Huey-jiuan Lin, Raed Marwan, Shuhei Baba, and Weng-Sing Hwang. 2018. “Numerical Modeling of Melt-Pool Behavior in Selective Laser Melting with Random Powder Distribution and Experimental Validation.” Journal of Materials Processing Technology 254 (November 2017): 72–78. doi:10.1016/j.jmatprotec.2017.11.032. [Crossref], [Web of Science ®], [Google Scholar]
Yadroitsev, I., P. Krakhmalev, I. Yadroitsava, S. Johansson, and I. Smurov. 2013. “Energy Input Effect on Morphology and Microstructure of Selective Laser Melting Single Track from Metallic Powder.” Journal of Materials Processing Technology 213 (4): 606–613. doi:10.1016/j.jmatprotec.2012.11.014. [Crossref], [Web of Science ®], [Google Scholar]
Yu, Wenhui, Swee Leong Sing, Chee Kai Chua, and Xuelei Tian. 2019. “Influence of Re-Melting on Surface Roughness and Porosity of AlSi10Mg Parts Fabricated by Selective Laser Melting.” Journal of Alloys and Compounds 792: 574–581. doi:10.1016/j.jallcom.2019.04.017. [Crossref], [Web of Science ®], [Google Scholar]
Zhang, Dongyun, Pudan Zhang, Zhen Liu, Zhe Feng, Chengjie Wang, and Yanwu Guo. 2018. “Thermofluid Field of Molten Pool and Its Effects during Selective Laser Melting (SLM) of Inconel 718 Alloy.” Additive Manufacturing 21 (100): 567–578. doi:10.1016/j.addma.2018.03.031. [Crossref], [Web of Science ®], [Google Scholar]
State Key Laboratory for Mechanical Behavior of Materials, Xi’an Jiaotong University, Xi’an 710049, China
Received 22 January 2021, Revised 6 April 2021, Accepted 6 May 2021, Available online 2 June 2021.
Abstract
Ti-6Al-4V alloys mad by additive manufacturing (AM) with slower cooling rate (e. g., direct energy deposition (DED)) generally have the problem of severe coarsening of α phase. This study presents a method to refine the microstructure of the primary β phase formed during the solid–liquid transformation, microstructures formed during the β → α + β transformation, and recrystallized microstructures formed during the repeated heating cycles encountered in AM processes. This is accomplished by the in situ precipitation of nano-sized dispersed high-melting-point yttria Y2O3 particles. The addition of micron-sized particles with high melting points can refine primary crystallized grains and transformed grains corresponding to the secondary phase in Ti-6Al-4V alloys. In addition, they can effectively inhibit the recrystallization and growth of prior-deposited metal grains. The microstructural and tensile properties of laser additive manufactured with filler wire Ti-6Al-4V components with different amounts of Y2O3 (0, 0.12, and 0.22 wt%) were investigated. The refining effect of Y2O3 was significant and the tensile strength of Ti-6Al-4V containing 0.22 wt% Y2O3 in the longitudinal and transverse directions was greater than that of Ti-6Al-4V by approximately 12% and 9%, respectively. Concurrently, there was no loss in the elongation of the material in either direction. The strategy of using micron-sized refractory particles to control phase transformation (primary crystallization, solid-state phase transformation, and recrystallization) can be applied to the AM of different metals, in which microstructures are susceptible to coarsening.
Korea Abstract
더 느린 냉각 속도 (예를 들어, 직접 에너지 증착 (DED))를 가진 적층 제조 (AM)에 의해 미친 Ti-6Al-4V 합금은 일반적으로 α상의 심한 조 대화 문제가 있습니다. 이 연구는 고체-액체 변환 중에 형성된 1 차 β상의 미세 구조, β → α + β 변환 중에 형성된 미세 구조, AM 공정에서 발생하는 반복되는 가열주기 동안 형성된 재결정 화 된 미세 구조를 정제하는 방법을 제시합니다.
이는 나노 크기의 분산 된 고 융점이 트리아 Y2O3 입자의 현장 침전에 의해 달성됩니다. 녹는 점이 높은 미크론 크기의 입자를 추가하면 Ti-6Al-4V 합금의 2 차 상에 해당하는 1 차 결정 입자 및 변형 된 입자를 정제 할 수 있습니다. 또한 사전에 증착 된 금속 입자의 재결정 화 및 성장을 효과적으로 억제 할 수 있습니다.
Y2O3 (0, 0.12, 0.22 wt %)의 양이 다른 필러 와이어 Ti-6Al-4V 성분으로 제조 된 레이저 첨가제의 미세 구조 및 인장 특성을 조사했습니다. Y2O3의 정제 효과는 유의미했으며, Y2O3 0.22 wt %를 세로 및 가로 방향으로 포함하는 Ti-6Al-4V의 인장 강도는 Ti-6Al-4V보다 각각 약 12 % 및 9 % 더 컸습니다.
동시에 어느 방향으로도 재료의 연신율에 손실이 없었습니다. 미크론 크기의 내화 입자를 사용하여 상 변환 (1 차 결정화, 고체 상 변환 및 재결정 화)을 제어하는 전략은 미세 구조가 거칠어지기 쉬운 다양한 금속의 AM에 적용될 수 있습니다.
Hierarchical grain refinement during the laser additive manufacturing of Ti-6Al-4V alloys by the addition of micron-sized refractory particlesHierarchical grain refinement during the laser additive manufacturing of Ti-6Al-4V alloys by the addition of micron-sized refractory particles Fig1Hierarchical grain refinement during the laser additive manufacturing of Ti-6Al-4V alloys by the addition of micron-sized refractory particles Fig2Hierarchical grain refinement during the laser additive manufacturing of Ti-6Al-4V alloys by the addition of micron-sized refractory particles Fig3Hierarchical grain refinement during the laser additive manufacturing of Ti-6Al-4V alloys by the addition of micron-sized refractory particles Fig4Hierarchical grain refinement during the laser additive manufacturing of Ti-6Al-4V alloys by the addition of micron-sized refractory particles Fig5Hierarchical grain refinement during the laser additive manufacturing of Ti-6Al-4V alloys by the addition of micron-sized refractory particles Fig6Hierarchical grain refinement during the laser additive manufacturing of Ti-6Al-4V alloys by the addition of micron-sized refractory particles Fig7
Won-Ik Cho, Peer Woizeschke Bremer Institut für angewandte Strahltechnik GmbH, Klagenfurter Straße 5, Bremen 28359, Germany
Received 30 July 2020, Revised 3 October 2020, Accepted 18 October 2020, Available online 1 November 2020.
Abstract
Molten pool flow and heat transfer in a laser welding process using beam oscillation and filler wire feeding were calculated using computational fluid dynamics (CFD). There are various indirect methods used to analyze the molten pool dynamics in fusion welding. In this work, based on the simulation results, the surface fluctuation was directly measured to enable a more intuitive analysis, and then the signal was analyzed using the Fourier transform and wavelet transform in terms of the beam oscillation frequency and buttonhole formation. The 1st frequency (2 x beam oscillation frequency, the so-called chopping frequency), 2nd frequency (4 x beam oscillation frequency), and beam oscillation frequency components were the main components found. The 1st and 2nd frequency components were caused by the effect of the chopping process and lumped line energy. The beam oscillation frequency component was related to rapid, unstable molten pool behavior. The wavelet transform effectively analyzed the rapid behaviors based on the change of the frequency components over time.
Korea Abstract
빔 진동 및 필러 와이어 공급을 사용하는 레이저 용접 공정에서 용융 풀 흐름 및 열 전달은 CFD (전산 유체 역학)를 사용하여 계산되었습니다. 용융 용접에서 용융 풀 역학을 분석하는 데 사용되는 다양한 간접 방법이 있습니다.
본 연구에서는 시뮬레이션 결과를 바탕으로 보다 직관적 인 분석이 가능하도록 표면 변동을 직접 측정 한 후 빔 발진 주파수 및 버튼 홀 형성 측면에서 푸리에 변환 및 웨이블릿 변환을 사용하여 신호를 분석했습니다.
1 차 주파수 (2 x 빔 발진 주파수, 이른바 초핑 주파수), 2 차 주파수 (4 x 빔 발진 주파수) 및 빔 발진 주파수 성분이 발견 된 주요 구성 요소였습니다. 1 차 및 2 차 주파수 성분은 쵸핑 공정과 집중 라인 에너지의 영향으로 인해 발생했습니다.
빔 진동 주파수 성분은 빠르고 불안정한 용융 풀 동작과 관련이 있습니다. 웨이블릿 변환은 시간 경과에 따른 주파수 구성 요소의 변화를 기반으로 빠른 동작을 효과적으로 분석했습니다.
1 . 소개
융합 용접에서 용융 풀 역학은 용접 결함과 시각적 이음새 품질에 직접적인 영향을 미칩니다. 이러한 역학을 연구하기 위해 고속 카메라를 사용하는 직접 방법과 광학 또는 음향 신호를 사용하는 간접 방법과 같은 다양한 측정 방법을 사용하여 여러 실험 방법을 고려했습니다. 시간 도메인의 원래 신호는 특별히 주파수 도메인에서 변환 된 신호로 변환되어 용융 풀 동작에 영향을 미치는 주파수 성분을 분석합니다. Kotecki et al. (1972)는 고속 카메라를 사용하여 가스 텅스텐 아크 용접에서 용융 풀을 관찰했습니다. [1]. 그들은 120Hz 리플 DC 출력을 가진 용접 전원을 사용할 때 용융 풀 진동 주파수가 120Hz임을 보여주었습니다. 전원을 끈 후 진동 주파수는 용융 풀의 고유 주파수를 나타내는 용융 풀 크기와 관련이 있습니다. 진동은 응고 중에 용접 표면 스케일링을 생성했습니다. Zacksenhouse and Hardt (1983)는 레이저 섀도 잉 동작 측정 기술을 사용하여 가스 텅스텐 아크 용접에서 완전히 관통 된 용융 풀의 동작을 측정했습니다 [2] . 그들은 2.5mm 두께의 강판에서 6mm 풀 반경 (고정 용접)에 대해 용융 풀의 고유 주파수가 18.9Hz라는 것을 발견했습니다. Semak et al. (1995) 고속 카메라를 사용하여 레이저 스폿 용접에서 용융 풀 및 키홀 역학 조사 [3]. 그들은 깊이가 약 3mm이고 반경이 약 3mm 인 용융 풀에서 200Hz의 낮은 체적 진동 주파수를 관찰했습니다. 0.45mm Aendenroomer와 den Ouden (1998)은 강철의 펄스 가스 텅스텐 아크 용접에서 용융 풀 진동을보고했습니다 [4] . 그들은 침투 깊이에 따라 진동 모드 변화를 보였고 주파수는 50Hz에서 150Hz 사이에서 변화했습니다. 주파수는 완전히 침투 된 용융 풀에서 더 낮았습니다. Hermans와 den Ouden (1999)은 단락 가스 금속 아크 용접에서 용융 풀 진동을 분석했습니다. [5]. 그들은 용융 풀의 단락 주파수와 고유 주파수가 같을 때 부분적으로 침투 된 용융 풀의 경우 공정 안정성이 향상되었음을 보여주었습니다. Yudodibroto et al. (2004)는 가스 텅스텐 아크 용접에서 용융 풀 진동에 대한 필러 와이어의 영향을 조사했습니다 [6] . 그들은 금속 전달이 특히 부분적으로 침투 된 용융 풀에서 진동 거동을 방해한다는 것을 보여주었습니다. Geiger et al. (2009) 레이저 키홀 용접에서 발광 분석 [7]. 신호의 주파수 분석을 사용하여 용융 풀 (1.5kHz 미만)과 키홀 (약 3kHz)에 해당하는 진동 주파수 범위를 찾았습니다. Kägeler와 Schmidt (2010)는 레이저 용접에서 용융 풀 크기의 변화를 관찰하기 위해 고속 카메라를 사용했습니다 [8] . 그들은 용융 풀에서 지배적 인 저주파 진동 성분 (100Hz 미만)을 발견했습니다. Shi et al. (2015) 고속 카메라를 사용하여 펄스 가스 텅스텐 아크 용접에서 용융 풀 진동 주파수 분석 [9]. 그들은 용접 침투 깊이가 작을수록 용융 풀의 진동 빈도가 더 높다는 것을 보여주었습니다. 추출 된 진동 주파수는 완전 용입 용접의 경우 85Hz 미만 이었지만 부분 용입 용접의 경우 110Hz에서 125Hz 사이였습니다. Volpp와 Vollertsen (2016)은 레이저 키홀 역학을 분석하기 위해 광학 신호를 사용했습니다 [10] . 그들은 공간 레이저 강도 분포로 인해 0.8에서 154 kHz 사이의 고주파 범위에서 피크를 발견했습니다. 위에서 언급 한 실험적 접근법은 공정 조건, 측정 방법 및 측정 된 위치에 따라 수십 Hz에서 수십 kHz까지 광범위한 용융 풀 역학에 대한 결과를 보여 주었다는 점에 유의해야합니다.
융합 용접에서 용융 풀 역학을 연구하기 위해 분석 접근 방식도 사용되었습니다. Zacksenhouse와 Hardt (1983)는 2.5mm 두께의 강판에서 대칭형 완전 관통 용융 풀의 고유 진동수를 계산했습니다 [2] . 매스 스프링 해석 모델을 사용하여 용융 풀 반경 6mm (고정 용접)에 대해 20.4Hz (실험에서 18.9Hz)의 고유 진동수와 3mm 풀 반경 (연속 용접)에 대해 40Hz의 고유 진동수를 예측했습니다. ). Postacioglu et al. (1989)는 원통형 용융 풀과 키홀을 가정하여 레이저 용접의 용융 풀에서 키홀 진동의 고유 진동수를 계산했습니다 .. 특정 열쇠 구멍 모양의 경우 약 900Hz의 기본 주파수가 계산되었습니다. Postacioglu et al. (1991)은 또한 레이저 용접에서 용접 속도를 고려하기 위해 타원형 용융 풀의 고유 진동수를 계산했습니다 [12] . 그들은 타원형 용융 풀의 모양이 고유 진동수에 영향을 미친다는 것을 보여주었습니다. 고유 진동수는 축의 길이 비율이 낮았으며, 즉 타원의 반장 축과 반 단축의 비율이 낮았습니다. Kroos et al. (1993)은 축 대칭 용융 풀과 키홀을 가정하여 레이저 키홀 용접의 동적 거동에 대한 이론적 모델을 개발했습니다 .. 키홀 폐쇄 시간은 0.1ms였으며 안정성 분석은 약 500Hz의 주파수에서 공진과 같은 진동을 예측했습니다. Maruo와 Hirata (1993)는 완전 관통 아크 용접에서 용융 풀을 모델링했습니다 [14] . 그들은 녹은 웅덩이가 정적 타원 모양을 가지고 있다고 가정했습니다. 그들은 고유 진동수와 진동 모드 사이의 관계를 조사하고 용융 풀 크기가 감소함에 따라 고유 진동수가 증가한다는 것을 보여주었습니다. Klein et al. (1994)는 원통형 키홀 모양을 사용하여 완전 침투 레이저 용접에서 키홀 진동을 연구했습니다 [15] . 그들은 점성 감쇠로 인해 키홀 진동이 낮은 kHz 범위로 제한된다는 것을 보여주었습니다. Klein et al. (1996)은 또한 레이저 출력의 작은 변동이 강한 키홀 진동으로 이어질 수 있음을 보여주었습니다[16] . 그들은 키홀 진동의 주요 공진 주파수 범위가 500 ~ 3500Hz라는 것을 발견했습니다. Andersen et al. (1997)은 고정 가스 텅스텐 아크 용접 [17] 에서 고정 된 원통형 모양을 가정하여 용융 풀의 고유 진동수를 예측 했으며 완전 용입 용접에서 용융 풀 폭이 증가함에 따라 감소하는 것으로 나타났습니다. 3.175mm 두께의 강판의 경우 주파수는 20Hz ~ 100Hz 범위였습니다. 위에 표시된 분석 방법은 일반적으로 단순한 용융 풀 모양을 가정하고 고유 진동수를 계산했습니다. 이것은 단순한 용융 풀 모양으로 고정 용접 공정을 분석하는 데 충분하지만 대부분의 용접 사례를 설명하는 과도 용접 공정에서 용융 풀 역학 분석에는 적합하지 않습니다.
반면에 수치 접근 방식은 고온 및 강한 빛과 같은 실험적 제한없이 자세한 정보를 제공하기 때문에 용융 풀 역학을 분석하는 이점이 있습니다. 전산 유체 역학 (CFD)의 수치 시뮬레이션 기술이 발전함에 따라 용융 풀 역학 분석에 대한 많은 연구가 수행되었습니다. 실제 용융 표면 변화는 VOF (체적 부피) 방법을 사용하여 계산할 수 있습니다. Cho et al. (2010) CO 2 레이저-아크 하이브리드 용접 공정을 위한 수학적 모델 개발 [18], 구형 방울이 생성 된 금속 와이어의 용융 과정이 와이어 공급 속도와 일치한다고 가정합니다. 그들은 필러 와이어가 희석되는 용융 풀 동작을 보여주었습니다. Cho et al. (2012)는 높은 빔 품질과 높은 금속 흡수율로 인해 업계에서 널리 사용되는 디스크 레이저 키홀 용접으로 수학적 모델을 확장했습니다 [19] . 그들은 열쇠 구멍에서 레이저 광선 번들의 다중 반사를 고려하고 용융 풀에서 keyholing과 같은 빠른 표면 변화를 자세히보고했습니다. 최근 CFD 시뮬레이션은 험핑 (Otto et al., 2016 [20] ) 및 기공 (Lin et al., 2017 [21] )과 같은보다 구체적인 현상을 분석하는데도 사용되었습니다 .) 레이저 용접에서. 그러나 용융 풀 역학과 관련된 연구는 거의 수행되지 않았습니다. Ko et al. (2000)은 수치 시뮬레이션을 사용하여 가스 텅스텐 아크 용접 풀의 동적 거동을 조사했습니다 [22] . 그들은 완전히 침투 된 용융 풀이 부분적으로 침투 된 풀보다 낮은 주파수에서 진동한다는 것을 보여주었습니다. 진동은 수십 분의 1 초 내에 무시할 수있는 크기로 감쇠되었습니다. Geiger et al. (2009)는 또한 수치 시뮬레이션을 사용하여 레이저 용접에서 용융 풀 거동을 보여주었습니다 [7]. 그들은 계산 된 증발 속도를 주파수 분석에 사용하여 공정에서 나오는 빛의 실험 결과와 비교했습니다. 판금 레이저 용접에서 중요한 공간 빔 진동 및 추가 필러 재료가있는 공정에 대한 용융 풀 역학에 대한 연구도 불충분합니다. Hu et al. (2018)은 금속 전달 메커니즘을 밝히기 위해 전자빔 3D 프린팅에서 와이어 공급 모델링을 수행했습니다. 그들은 주로 열 입력에 의해 결정되는 액체 브리지 전이, 액적 전이 및 중간 전이의 세 가지 유형의 금속 전달 모드를 보여주었습니다 .. Meng et al. (2020)은 레이저 빔 용접에서 용융 풀에 필러 와이어에 의해 추가 된 추가 요소의 전자기 교반 효과를 모델링했습니다. 용가재의 연속적인 액체 브릿지 이동이 가정되었고, 그 결과 전자기 교반의 영향이 키홀 깊이에 미미한 반면 필러 와이어 혼합을 향상 시켰습니다 [24] . Cho et al. (2017) 용접 방향에 수직 인 1 차원 빔 진동과 용접 라인을 따라 공급되는 필러 와이어를 사용하여 레이저 용접을위한 시뮬레이션 모델 개발 [25]. 그들은 시뮬레이션을 사용하여 특정 용접 현상, 즉 용융 풀의 단추 구멍 형성을 보여주었습니다. Cho et al. (2018)은 다중 반사 수와 전력 흡수량의 푸리에 변환을 사용하여 주파수 영역에서 소위 쵸핑 주파수 (2 x 빔 발진 주파수) 성분을 발견했습니다 [26] . 그러나 그들은 용융 풀 역학을 분석하기 위해 간접 신호를 사용했습니다. 따라서보다 직관적 인 분석을 위해서는 표면의 변동을 직접 측정해야합니다.
이 연구는 이전 연구에서 개발 된 레이저 용접 모델을 사용하여 3 차원 과도 CFD 시뮬레이션을 수행하여 빔 진동 및 필러 와이어 공급을 포함한 레이저 용접 공정에서 용융 풀 역학을 조사합니다. 용융 된 풀 표면의 시간적 변화는 시뮬레이션 결과에서 추출되었습니다. 추출 된 데이터는 주파수 영역뿐만 아니라 시간-주파수 영역에서도 분석되었습니다. 신호 처리를 통해 도출 된 결과는 특징적인 용융 풀 역학을 나타내며 빔 진동 주파수 및 단추 구멍 형성 측면에서 레이저 용접의 역학을 줄일 수있는 잠재력을 제공합니다.
2 . 방법론
그림 1도 1은 용접 방향에 수직 인 1 차원 빔 진동과 용접 라인을 따라 공급되는 필러 와이어를 사용하는 레이저 용접 프로세스의 개략적 설명을 보여줍니다. 1mm 두께의 알루미늄 합금 (AlSi1MgMn) 시트는 시트 표면에 초점을 맞춘 멀티 kW 파이버 레이저 (YLR-8000S, IPG Photonics, USA)를 사용하여 용접되었습니다. 시트는 에어 갭이있는 맞대기 이음으로 정렬되었습니다. 1 차원 스캐너 (ILV DC-Scanner, Ingenieurbüro für Lasertechnik + Verschleiss-Schutz (ILV), 독일)를 사용하여 레이저 빔의 1 차원 정현파 진동을 실현했습니다. 이 스캔 시스템에서 최대 진동 폭은 250Hz의 진동 주파수에서 1.4mm입니다. 오정렬에 대한 공차를 개선하기 위해 동일한 최대 너비 값이 사용되었습니다. 와이어 공급 시스템은 1을 공급했습니다. 2mm 직경의 알루미늄 합금 (AlSi5) 필러 와이어를 일정한 공급 속도로 에어 갭을 채 웁니다. 1mm 에어 갭의 경우 와이어 이송 속도는 용접 속도의 1.5 배 값으로 설정되었으며 참조 실험 조건은 문헌에서 얻었습니다 (Schultz, 2015 참조).[27] ).
CFD 시뮬레이션은 레이저 용접에서 열 전달 및 용융 풀 동작을 계산하기 위해 수행되었습니다. 그림 2 는 CFD 시뮬레이션을위한 계산 영역을 보여줍니다. 실온에서 1.2mm 직경의 필러 와이어가 공급되고 레이저 빔이 진동했습니다. 1mm 두께의 공작물이 용접 속도로 왼쪽에서 오른쪽으로 이동했습니다. 0.1mm의 최소 메쉬 크기가 도메인에서 생성되었습니다. 침투 깊이가 더 깊은 이전 연구의 메쉬 테스트 결과는 0.2mm 이하의 메쉬 크기로 시뮬레이션 정확도가 확보 된 것으로 나타 났으므로 [28] 본 연구에서 사용 된 메쉬 크기가 적절할 수 있습니다. 도메인을 구성하는 세포의 수는 약 120 만 개였습니다. 1 번 테이블사용 된 레이저 용접 매개 변수를 보여줍니다. 용융 풀 역학 측면에서 다양한 진동 주파수와 에어 갭 크기가 고려되었으며 12 개의 용접 사례가 표 2 에 나와 있습니다. 표 3 은 시뮬레이션에 사용 된 알루미늄 합금과 순수 알루미늄 (Cho et al., 2018 [26] )의 표면 장력 계수를 제외하고 온도와 무관 한 열-물리적 재료 특성을 보여줍니다 . 여기서 표면 장력 계수는 액체 온도에서 온도와 표면 장력 계수 사이의 선형 관계를 가진 유일한 온도 의존적 특성이었습니다.
시뮬레이션을 위해 단상 뉴턴 유체와 비압축성 층류가 가정되었습니다. 질량, 운동량 및 에너지 보존의 지배 방정식을 해결하여 계산 영역에서 속도, 압력 및 온도 분포를 얻었습니다. VOF 방법은 자유 표면 경계를 찾는 데 사용되었습니다. 스칼라 보존 방정식을 추가로 도입하여 용융 풀에서 충전재의 부피 분율을 계산했습니다. 시뮬레이션에 사용 된 레이저 용접의 수학적 모델은 다음과 같습니다. 레이저 빔은 가우스와 같은 전력 밀도 분포를 기반으로 697 개의 광선 에너지 번들로 나뉩니다. 광선 추적 방법을 사용하여 다중 반사를 고려했습니다. 재료에 대한 레이저 빔의 반사 (또는 흡수) 에너지는 프레 넬 반사 모델을 사용하여 계산되었습니다. 온도에 따른 흡수율의 변화를 고려 하였다. 혼합물의 흡수율은베이스 및 충전제 물질 분획의 가중 평균을 사용하여 계산되었습니다. 반동 압력과 부력도 고려되었습니다. 경계 조건으로 에너지와 압력의 균형은 VOF 방법으로 계산 된 자유 표면에서 고려되었습니다. 레이저 용접 모델과 지배 방정식은 FLOW-3D v.11.2 (2017), Flow Science, Inc.에서 유한 차분 방법과 유한 체적 방법을 사용하여 이산화되고 해결되었습니다. 경계 조건으로 에너지와 압력의 균형은 VOF 방법으로 계산 된 자유 표면에서 고려되었습니다. 레이저 용접 모델과 지배 방정식은 FLOW-3D v.11.2 (2017), Flow Science, Inc.에서 유한 차분 방법과 유한 체적 방법을 사용하여 이산화되고 해결되었습니다. 경계 조건으로 에너지와 압력의 균형은 VOF 방법으로 계산 된 자유 표면에서 고려되었습니다. 레이저 용접 모델과 지배 방정식은 FLOW-3D v.11.2 (2017), Flow Science, Inc.에서 유한 차분 방법과 유한 체적 방법을 사용하여 이산화되고 해결되었습니다.[29] . 계산에는 48GB RAM이 장착 된 Intel® Xeon® 프로세서 E5649로 구성된 워크 스테이션이 사용되었습니다. 계산 시스템을 사용하여 0.2 초 레이저 용접을 시뮬레이션하는 데 약 18 시간이 걸렸습니다. 지배 방정식 (Cho and Woizeschke, 2020 [30] ) 및 레이저 용접 모델 (Cho et al., 2018 [26] )에 대한 자세한 설명은 부록 A 에서 확인할 수 있습니다 .
그림 3 은 용융 풀 변동의 직접 측정에 대한 개략적 설명을 보여줍니다. 용융 풀의 역학을 분석하기 위해 시뮬레이션 중에 용융 풀 표면의 시간적 변동 운동을 측정했습니다. 상단 및 하단 표면 모두에서 10kHz의 샘플링 주파수로 변동을 측정 한 반면, 측정 위치는 X 축의 레이저 빔 위치에서 2mm 떨어진 용접 중심선에있었습니다. 그림 4시간 신호를 분석하는 데 사용되는 푸리에 변환 및 웨이블릿 변환의 개략적 설명을 보여줍니다. 측정 된 시간 신호는 고속 푸리에 변환 (FFT) 방법을 사용하여 주파수 영역으로 변환되었습니다. 결과는 측정 기간 동안 평균화 된 주파수 성분의 크기를 보여줍니다. 웨이블릿 변환 방법은 시간-주파수 영역에서 국부적 인 특성을 찾는 데 사용되었습니다. 결과는 주파수 구성 요소의 크기뿐만 아니라 시간 변화도 보여줍니다.
3 . 결과
이 연구 에서는 표 2에 표시된 12 가지 용접 사례 를 시뮬레이션했습니다. 그림 5 는 3 차원 시뮬레이션 결과를 평면도 와 바닥면으로 보여줍니다. 결과는 용융 된 풀의 거동에 따라 분류 할 수 있습니다 : 단추 구멍 형성 없음 (녹색), 안정 또는 불안정 단추 구멍 있음 (파란색), 불안정한 단추 구멍으로 인한 구멍 결함 (빨간색). 일반적인 열쇠 구멍보다 훨씬 큰 직경을 가진 단추 구멍은 레이저 용접의 특정 진동 조건에서 나타날 수 있습니다 (Vollertsen, 2016 [31]). 진동 주파수가 증가함에 따라 용접 이음 부 코스 및 스케일링 측면에서 시각적 이음새 품질이 향상되었습니다. 고주파에서 스케일링은 무시할 수있을 정도 였고 코스는 균질했습니다. 언더컷 결함의 발생도 감소했습니다. 그러나 관통 결함 부족 (case 7, case 10)이 나타났다. 에어 갭은 단추 구멍 형성에 중요했습니다. 에어 갭 크기가 증가함에 따라 단추 구멍이 더 쉽게 형성되었지만 구멍 결함으로 더 쉽게 남아 있습니다. 안정적인 단추 구멍 형성은 고려 된 공극 조건의 좁은 영역에서만 나타납니다.
그림 6 은 시뮬레이션과 실험에서 융합 영역의 모양을 보여줍니다. 버튼 홀이없는 경우 1, 불안정한 버튼 홀 형성이있는 경우 8, 안정적인 버튼 홀 형성이있는 경우 11의 3 가지 경우에 대해 시뮬레이션 결과와 실험 결과를 비교하여 유사성을 나타냈다. 본 연구에서 고려한 용접 조건의 경우 표면 품질 결과는 Fig. 5 와 같이 큰 차이를 보였으 나 단면 융착 영역 [26] 과 형상은 큰 차이를 보이지 않았다.
무화과. 7 과 8 은 각각 100Hz와 250Hz의 진동 주파수에서 시뮬레이션 결과를 기반으로 분석 된 용융 풀 역학과 시뮬레이션 및 실험 결과를 보여줍니다. 이전 연구에서 볼 수 있듯이 레이저 빔의 진동 주파수는 단추 구멍 형성과 밀접한 관련이 있습니다 (Cho et al., 2018 [26] 참조 ). 그림 7 (a) 및 (b)는 각각 시뮬레이션 및 실험을 기반으로 한 진동 주파수 100Hz에서 대표적인 용융 풀 동작을 보여줍니다. 완전히 관통 된 키홀 및 버튼 홀 형성은 관찰되지 않았으며 응고 후 거친 비드 표면이 남았습니다. 그림 7(c)와 (d)는 각각 윗면과 바닥면의 표면 변동에 대한 시뮬레이션 결과를 기반으로 한 용융 풀 역학 분석을 보여줍니다. 샘플링 데이터는 상단 표면이 공작물의 상단 표면 위치에서 평균적으로 변동하는 반면 하단 표면은 공작물의 하단 표면 위치에서 평균적으로 변동하는 것으로 나타났습니다. 표면 변동의 푸리에 변환 및 웨이블릿 변환 결과는 명확한 1 차 주파수 (2 x 빔 발진 주파수, 이른바 초핑 주파수, Cho et al., 2018 [26] 참조 ) 및 2 차 주파수 (4 x 빔 발진)를 보여줍니다. 주파수) 두 표면의 구성 요소, 그러나 바닥 표면과 첫 번째에 대한 결과주파수 성분이 더 강합니다. 반면 그림 8 (a)와 (b)에서 보는 바와 같이 250Hz의 진동 주파수에서 시뮬레이션과 실험 결과는 안정된 버튼 홀 형성과 응고 후 매끄러운 비드 표면을 나타냈다. 그림 8 의 샘플링 신호의 진폭은 그림 7 의 진폭 보다 작으며 푸리에 변환 및 웨이블릿 변환의 결과에서 중요한 주파수 성분이 발견되지 않았습니다.
Fig. 9 는 진동 주파수 200Hz에서 시뮬레이션 결과를 바탕으로 분석 된 용융 풀 역학과 시뮬레이션 및 실험 결과를 보여준다. 이 주파수에서 Fig. 9 (a)와 (b) 에서 보는 바와 같이 , 시뮬레이션과 실험 모두에서 불안정한 buttonhole 거동이 관찰되었다. 바닥면에서 샘플링 데이터의 푸리에 변환 및 웨이블릿 변환의 결과 빔 발진 주파수 성분이 발견되었습니다.
4 . 토론
시뮬레이션 및 실험 결과는 비드 표면 품질이 향상되고 빔 진동 주파수가 증가함에 따라 버튼 홀이 형성되는 것으로 나타났습니다. 표면의 변동 데이터에 대한 푸리에 변환 및 웨이블릿 변환의 결과에 따라 다음과 같은 주요 주파수 구성 요소가 발견되었습니다. 1 차 및 2 차버튼 홀 형성이없는 주파수, 불안정한 용융 풀 거동이있는 빔 진동 주파수, 안정적인 버튼 홀 형성이있는 중요한 주파수 성분이 없습니다. 이들 중 불안정한 용융 풀 동작과 관련된 빔 진동 주파수 성분은 완전히 관통 된 키홀과 반복적으로 생성 및 붕괴되는 불안정한 버튼 홀의 특성으로 인해 웨이블릿 변환 결과에서 명확한 실선 형태로 나타나지 않았습니다. 분석 결과는 윗면보다 바닥면에서 더 분명했습니다. 이는 필러 와이어 공급 및 키홀 링 공정에서 강한 하향 흐름으로 인해 용융 풀 역학이 바닥 표면 영역에서 더 강했기 때문입니다. 진동 주파수가 증가함에 따라 용융 풀 역학과 상단 표면과 하단 표면 간의 차이가 감소했습니다.
첫 번째 주파수 (2 x 빔 진동 주파수)는이 연구에서 관찰 된 가장 분명한 구성 요소였습니다. Schultz et al. (2018)은 또한 실험을 통해 동일한 성분을 발견했습니다 [32] , 용융 풀 표면 운동에 대한 푸리에 분석을 수행했습니다. 첫 번째 주파수 성분은 빔 발진주기 당 두 개의 주요 이벤트가 있음을 의미합니다. 이것은 레이저 빔이 빔 진동주기 당 두 번 와이어를 절단하거나 절단하는 프로세스와 일치합니다. 용융 된 와이어 팁은 낮은 진동 주파수에서 고르지 않고 날카로운 모서리를 갖는 것으로 나타났습니다 (Cho et al., 2018 [26] ). 이것은 첫 번째 원인이 될 수 있습니다.용융 된 풀에서 지배적이되는 주파수 성분. 진동 주파수가 증가하면 용융 된 와이어 팁이 더 균일 해 지므로 효과가 감소합니다. 용접 방향으로의 정현파 횡 방향 빔 진동을 통한 에너지 집중도 빔 진동주기 당 두 번 발생합니다. 그림 10 은 발진 주파수에 따른 레이저 빔의 라인 에너지 (단위 길이 당 에너지)의 변화를 보여줍니다. 그림 10 b) 의 라인 에너지 는 레이저 출력을 공정 속도로 나누어 계산했습니다. 여기서 처리 속도는(w이자형엘디나는엔지에스피이자형이자형디)2+(디(에스나는엔유에스영형나는디ㅏ엘wㅏV이자형나는엔에프나는지.10ㅏ))디티)2. 낮은 발진 주파수에서 라인 에너지는 발진 폭의 양쪽 끝에 과도하게 집중됩니다. 이러한 집중된 에너지는 과도한 키홀 링 프로세스를 초래하므로 언더컷 결함이 나타날 수있는 높은 흐름 역학이 발생합니다. 진동 주파수가 증가함에 따라 집중 에너지는 더 작은 조각으로 나뉩니다. 따라서 높은 진동 주파수에서 과도한 키홀 링 및 수반되는 언더컷 결함의 발생이 감소되었습니다. 위에서 언급 한 두 가지 현상 (불균일 한 와이어 팁과 집중된 라인 에너지)은 빔 발진주기 당 두 번 발생하며 발진 주파수가 증가하면 그 효과가 감소합니다. 따라서 저주파 에서 2 차 주파수 성분 (4 x 빔 발진 주파수)이 나타나는 것은이 두 현상의 동시 작용입니다.
두 가지 현상 중 첫 번째 주파수 에 대한 주된 효과 는 집중된 라인 에너지입니다. Cho et al. (2018)은 전력 흡수 데이터를 푸리에 변환을 사용하여 분석했을 때 1 차 주파수 성분이 더 우세 해졌고, 2 차 주파수 성분은 발진 주파수가 증가함에 따라 상대적으로 약화 되었음을 보여주었습니다 [26] . 용융 된 와이어 팁은 또한 빈도가 증가함에 따라 더욱 균일 해졌습니다. 결과는 진동 주파수의 증가가 용융 풀에 대한 와이어의 영향을 제거하는 것으로 나타났습니다. 따라서 발진 주파수가 증가함에 따라 라인 에너지 집중의 영향 만 남을 수 있습니다. 그림 10 과 같이, 집중 선 에너지가 작은 조각으로 분할되기 때문에 효과도 감소하지만 최대 값이 변경되지 않았기 때문에 여전히 효과적입니다.
빔 진동 주파수 성분은 불안정한 단추 구멍 및 열쇠 구멍 붕괴를 수반하는 불안정한 용융 풀 동작과 관련이 있습니다. 언더컷 결함이있는 케이스 8 (발진 주파수 200Hz)에서 발진 주파수 성분이 관찰되었습니다. 이것은 특히 완전히 관통 된 열쇠 구멍과 불안정한 단추 구멍에서 불안정한 용융 풀 동작을 보여주었습니다. 경우 10 (진동 주파수 250Hz)의 경우 상대적으로 건강한 비드가 형성 되었으나, 도 11 (a) 와 같이 웨이블릿 변환 결과에서 t1의 시간 간격으로 진동 주파수 성분이 관찰되었다 . 이 시간 간격 t1의 용융 풀 거동은 그림 11에 나와 있습니다.(비). 완전히 관통 된 열쇠 구멍이 즉시 무너지는 것이 분명하게 관찰되었습니다. 이것은 진동 주파수 성분이 불안정한 용융 풀 거동과 밀접한 관련이 있음을 보여줍니다. 발견 된 주파수 성분으로부터 완전히 관통 된 열쇠 구멍과 같은 불안정한 용융 풀 거동을 예측할 수 있습니다. 완전히 관통 된 키홀이 반복적으로 붕괴되기 때문에 빔 진동 주파수 성분은 그림 9 (d) 와 같이 웨이블릿 변환 결과에서 명확한 실선 형태로 보이지 않습니다 .
Cho and Woizeschke (2020)에 따르면 단추 구멍 형성은 자체 지속 가능한 카테 노이드처럼 작용하기 때문에 용융 풀 역학을 감소시킬 수 있습니다 [30] . 그림 12 는 버튼 홀 형성 측면에서 t2의 시간 간격에서 용융 풀 거동의 변화를 보여줍니다. 단추 구멍은 t2의 간헐적 인 부분에만 형성되었습니다. 1st 이후이 시간 동안 웨이블릿 변환의 결과로 주파수 성분이 사라졌고, 버튼 홀 형성은 용융 풀 역학을 줄이는 데 효과적이었습니다. 따라서, 웨이블릿 변환의 결과로 주파수 성분이 지워지는 것을 관찰함으로써 버튼 홀 형성을 예측할 수있다. 이와 관련하여 웨이블릿 변환 기술은 시간에 따른 용융 풀 변화를 나타낼 수 있습니다. 이 기술은 향후 용융 풀 동작을 모니터링하는 데 사용될 수 있습니다.
5 . 결론
CFD 시뮬레이션 결과를 사용하여 빔 진동 및 필러 와이어 공급을 통한 레이저 용접에서 용융 풀 역학을 분석 할 수있었습니다. 용융 풀 표면의 변동 데이터의 푸리에 변환 및 웨이블릿 변환은 여기서 용융 풀 역학을 분석하는 데 사용되었습니다. 결과는 다음과 같은 결론으로 이어집니다.1.
1 차 주파수 (2 x 빔 발진 주파수, 이른바 초핑 주파수), 2 차 주파수 (4 x 빔 발진 주파수) 및 빔 발진 주파수 성분은 푸리에 변환 및 웨이블릿 변환 분석에서 발견 된 주요 성분이었습니다.2.
1 차 주파수와 2 차 주파수 성분 의 출현은 두 가지 사건, 즉 레이저 빔에 의한 필러 와이어의 절단 공정과 집중된 레이저 라인 에너지의 효과의 결과였습니다. 이는 빔 진동주기 당 두 번 발생했습니다. 따라서 두 번째 주파수 성분은 동시 작용으로 인해 발생했습니다. 빔 진동 주파수 성분은 불안정한 용융 풀 동작과 관련이 있습니다. 구성 요소는 열쇠 구멍과 단추 구멍의 붕괴와 함께 나타났습니다.삼.
낮은 발진 주파수에서는 1 차 주파수와 2 차 주파수 성분이 함께 나타 났지만 발진 주파수가 증가함에 따라 그 크기가 함께 감소했습니다. 집중 선 에너지는 주파수가 증가함에 따라 최대 값이 변하지 않는 반면, 잘게 잘린 선단이 평평 해져 그 효과가 사라졌기 때문에 쵸핑 프로세스보다 더 큰 영향을 미쳤습니다.4.
용융 풀 거동의 빠른 시간적 변화는 웨이블릿 변환 방법을 사용하여 분석되었습니다. 따라서이 방법은 열쇠 구멍 및 단추 구멍의 형성 및 붕괴와 같은 일시적인 용융 풀 변화를 해석하는 데 사용할 수 있습니다.
CRediT 저자 기여 성명
조원익 : 개념화, 방법론, 소프트웨어, 검증, 형식 분석, 조사, 데이터 큐 레이션, 글쓰기-원고, 글쓰기-검토 및 편집. Peer Woizeschke : 감독, 프로젝트 관리, 작문-검토 및 편집.
경쟁 관심의 선언
저자는이 논문에보고 된 작업에 영향을 미칠 수있는 경쟁적인 재정적 이해 관계 나 개인적 관계가 없다고 선언합니다.
감사의 말
이 작업은 알루미늄 합금 용접 역량 센터 (Centr-Al)에서 수행되었습니다. Deutsche Forschungsgemeinschaft (DFG, 프로젝트 번호 290705638 , “용접 풀 캐비티를 생성하여 레이저 깊은 용입 용접에서 매끄러운 이음매 표면”) 의 자금은 감사하게도 인정됩니다.
-대량 보존 방정식,(A1)∇·V→=미디엄˙에스ρ어디, V→속도 벡터입니다. ρ밀도이고 미디엄˙에스필러 와이어를 공급하여 질량 소스의 비율입니다. 단위미디엄에스단위 부피당 질량입니다. WFS (와이어 공급 속도) 및 필러 와이어의 직경과 같은 매스 소스 및 필러 와이어 조건,디w계산 영역에서 다음과 같은 관계가 있습니다.(A2)미디엄=∫미디엄에스디V=미디엄0+씨×ρ×W에프에스×π디w24×티어디, 미디엄총 질량, 미디엄0초기 총 질량, V볼륨입니다.씨단위 변환 계수입니다. 티시간입니다.
-운동량 보존 방정식,(A3)∂V→∂티+V→·∇V→=−1ρ∇피+ν∇2V→−케이V→+미디엄˙에스ρ(V에스→−V→)+지어디, 피압력입니다. ν동적 점도입니다. 케이뭉툭한 영역의 다공성 매체 모델에 대한 항력 계수, V에스→질량 소스에 대한 속도 벡터입니다. 지신체 힘으로 인한 신체 가속도입니다.
-에너지 절약 방정식,(A4)∂h∂티+V→·∇h=1ρ∇·(케이∇티)+h˙에스어디, h특정 엔탈피입니다. 케이열전도율, 티온도이고 h˙에스특정 엔탈피 소스로, Eq 의 질량 소스와 연관됩니다 . (A1) . 계산 영역의 총 에너지,이자형다음과 같이 계산됩니다.(A5)이자형=∫미디엄에스h에스디V=∫미디엄에스씨Vw티w디V어디, 씨Vw질량 원의 비열, 티w질량 소스의 온도입니다.
또한, 엔탈피 기반 연속체 모델을 사용하여 고체-액체 상 전이를 고려했습니다.
-VOF 방정식,(A6)∂에프∂티+∇·(V→에프)=에프˙에스어디, 에프유체가 차지하는 부피 분율이며 0과 1 사이의 값을 가지며 에프˙에스질량의 소스와 연결된 유체의 체적 분율의 비율 식. (A1) . 질량 공급원에 해당하는 부피 분율은 다음에 할당됩니다.에프에스.
-스칼라 보존 방정식,(A7)∂Φ∂티+∇·(V→Φ)=Φ˙에스어디, Φ필러 와이어의 스칼라 값입니다. 셀의 유체가 전적으로 필러 와이어로 구성된 경우Φ1이고 유체에 대한 필러 와이어의 부피 분율에 따라 0과 1 사이에서 변경됩니다. Φ˙에스Eq 에서 질량 소스에 연결된 스칼라 소스의 비율입니다 . (A1) . 스칼라 소스는 전적으로 필러 와이어이기 때문에 1에 할당됩니다. 확산 효과는 고려되지 않았습니다.
흡수율을 계산하기 위해 프레 넬 반사 모델을 사용했습니다. ㅏ=1−ρ씨재료의 표면 상에 도시 된 바와 같이 수학 식. (A8) 원 편광 빔의 경우.(A8)ㅏ=1−ρ씨=1−12(ρ에스+ρ피)어디,ρ에스=(엔1씨영형에스θ−피)2+큐2(엔1씨영형에스θ+피)2+큐2,ρ에스=(피−엔1에스나는엔θ티ㅏ엔θ)2+큐2(피+엔1에스나는엔θ티ㅏ엔θ)2+큐2,피2=12{[엔22−케이22−(엔1에스나는엔θ)2]2+2엔22케이22+[엔22−케이22−(엔1에스나는엔θ)2]},큐2=12{[엔22−케이22−(엔1에스나는엔θ)2]2+2엔22케이22−[엔22−케이22−(엔1에스나는엔θ)2]}.어디, 복잡한 인덱스 엔1과 케이1반사 지수와 공기의 흡수 지수이며 엔2과 케이2공작물을위한 것입니다. θ입사각입니다. 도시 된 바와 같이 수학 식. (A9)에서 , 혼합물의 흡수율은 식에서 얻은 모재 및 필러 와이어 분획의 가중 평균이됩니다 . (A7) .(A9)ㅏ미디엄나는엑스티유아르 자형이자형=Φㅏw나는아르 자형이자형+(1−Φ)ㅏ비ㅏ에스이자형어디, ㅏ비ㅏ에스이자형과 ㅏw나는아르 자형이자형각각 비금속과 필러 와이어의 흡수율입니다.
자유 표면 경계에서의 반동 압력 에이 싱은 Eq. (A10) .(A10)피아르 자형(티)≅0.54피에스ㅏ티(티)=0.54피0이자형엑스피(엘V티−티비아르 자형¯티티비)어디, 피에스ㅏ티포화 압력, 피0대기압입니다. 엘V기화의 잠열, 티비끓는 온도이고 아르 자형¯보편적 인 기체 상수입니다.
참고 문헌
D.J. Kotecki, D.L. Cheever, D.G. Howden Mechanism of ripple formation during weld solidification Weld. J., 51 (8) (1972), pp. 386s-391s Google Scholar [2] M. Zacksenhouse, D.E. Hardt Weld pool impedance identification for size measurement and control J. Dyn. Syst. Meas. Control, 105 (3) (1983), pp. 179-184 CrossRefView Record in ScopusGoogle Scholar [3] V.V. Semak, J.A. Hopkins, M.H. McCay, T.D. McCay Melt pool dynamics during laser welding J. Phys. D, 28 (1995), pp. 2443-2450 CrossRefView Record in ScopusGoogle Scholar [4] A.J.R. Aendenroomer, G. den Ouden Weld pool oscillation as a tool for penetration sensing during pulsed GTA welding Weld. J., 77 (5) (1998), pp. 181s-187s Google Scholar [5] M.J.M. Hermans, G. den Ouden Process behavior and stability in short circuit gas metal arc welding Weld. J., 78 (4) (1999), pp. 137-141 View Record in ScopusGoogle Scholar [6] B.Y.B. Yudodibroto, M.J.M. Hermans, Y. Hirata, G. den Ouden Influence of filler wire addition on weld pool oscillation during gas tungsten arc welding Sci. Technol. Weld. Join., 9 (2) (2004), pp. 163-168 View Record in ScopusGoogle Scholar [7] M. Geiger, K.-H. Leitz, H. Koch, A. Otto A 3D transient model of keyhole and melt pool dynamics in laser beam welding applied to the joining of zinc coated sheets Prod. Eng. Res. Dev., 3 (2009), pp. 127-136 CrossRefView Record in ScopusGoogle Scholar [8] C. Kägeler, M. Schmidt Frequency-based analysis of weld pool dynamics and keyhole oscillations at laser beam welding of galvanized steel sheets Phys. Procedia, 5 (2010), pp. 447-453 ArticleDownload PDFView Record in ScopusGoogle Scholar [9] Y. Shi, G. Zhang, X.J. Ma, Y.F. Gu, J.K. Huang, D. Fan Laser-vision-based measurement and analysis of weld pool oscillation frequency in GTAW-P Weld. J., 94 (2015), pp. 176s-187s Google Scholar [10] J. Volpp, F. Vollertsen Keyhole stability during laser welding—part I: modelling and evaluation Prod. Eng.-Res. Dev., 10 (2016), pp. 443-457 CrossRefView Record in ScopusGoogle Scholar [11] N. Postacioglu, P. Kapadia, J. Dowden Capillary waves on the weld pool in penetration welding with a laser J. Phys. D, 22 (1989), pp. 1050-1061 CrossRefView Record in ScopusGoogle Scholar [12] N. Postacioglu, P. Kapadia, J. Dowden Theory of the oscillations of an ellipsoidal weld pool in laser welding J. Phys. D, 24 (1991), pp. 1288-1292 CrossRefView Record in ScopusGoogle Scholar [13] J. Kroos, U. Gratzke, M. Vicanek, G. Simon Dynamic behaviour of the keyhole in laser welding J. Phys. D, 26 (1993), pp. 481-486 View Record in ScopusGoogle Scholar [14] H. Maruo, Y. Hirata Natural frequency and oscillation modes of weld pools. 1st Report: weld pool oscillation in full penetration welding of thin plate Weld. Int., 7 (8) (1993), pp. 614-619 CrossRefView Record in ScopusGoogle Scholar [15] T. Klein, M. Vicanek, J. Kroos, I. Decker, G. Simon Oscillations of the keyhole in penetration laser beam welding J. Phys. D, 27 (1994), pp. 2023-2030 CrossRefView Record in ScopusGoogle Scholar [16] T. Klein, M. Vicanek, G. Simon Forced oscillations of the keyhole in penetration laser beam welding J. Phys. D, 29 (1996), pp. 322-332 View Record in ScopusGoogle Scholar [17] K. Andersen, G.E. Cook, R.J. Barnett, A.M. Strauss Synchronous weld pool oscillation for monitoring and control IEEE Trans. Ind. Appl., 33 (2) (1997), pp. 464-471 View Record in ScopusGoogle Scholar [18] W.-I. Cho, S.-J. Na, M.-H. Cho, J.-S. Lee Numerical study of alloying element distribution in CO2 laser-GMA hybrid welding Comput. Mater. Sci., 49 (2010), pp. 792-800 ArticleDownload PDFView Record in ScopusGoogle Scholar [19] W.-I. Cho, S.-J. Na, C. Thomy, F. Vollertsen Numerical simulation of molten pool dynamics in high power disk laser welding J. Mater. Process. Technol., 212 (2012), pp. 262-275 ArticleDownload PDFView Record in ScopusGoogle Scholar [20] A. Otto, A. Patschger, M. Seiler Numerical and experimental investigations of humping phenomena in laser micro welding Phys. Procedia, 83 (2016), pp. 1415-1423 ArticleDownload PDFView Record in ScopusGoogle Scholar [21] R. Lin, H.-P. Wang, F. Lu, J. Solomon, B.E. Carlson Numerical study of keyhole dynamics and keyhole-induced porosity formation in remote laser welding of Al alloys Int. J. Heat Mass Trans., 108 (2017), pp. 244-256 ArticleDownload PDFView Record in ScopusGoogle Scholar [22] S.H. Ko, C.D. Yoo, D.F. Farson, S.K. Choi Mathematical modeling of the dynamic behavior of gas tungsten arc weld pools Metall. Mater. Trans. B., 31B (2000), pp. 1465-1473 CrossRefView Record in ScopusGoogle Scholar [23] R. Hu, X. Chen, G. Yang, S. Gong, S. Pang Metal transfer in wire feeding-based electron beam 3D printing: modes, dynamics, and transition criterion Int. J. Heat Mass Transf., 126 (2018), pp. 877-887 ArticleDownload PDFView Record in ScopusGoogle Scholar [24] X. Meng, A. Artinov, M. Bachmann, M. Rethmeier Theoretical study of influence of electromagnetic stirring on transport phenomena in wire feed laser beam welding J. Laser Appl., 32 (2020), Article 022026 CrossRefGoogle Scholar [25] W.-I. Cho, V. Schultz, F. Vollertsen Simulation of the buttonhole formation during laser welding with wire feeding and beam oscillation L. Overmeyer, U. Reisgen, A. Ostendorf, M. Schmidt (Eds.), Proceedings of the Lasers in Manufacturing, German Scientific Laser Society, Munich, Germany (2017) Google Scholar [26] W.-I. Cho, V. Schultz, P. Woizeschke Numerical study of the effect of the oscillation frequency in buttonhole welding J. Mater. Process. Technol., 261 (2018), pp. 202-212 ArticleDownload PDFView Record in ScopusGoogle Scholar [27] V. Schultz, T. Seefeld, F. Vollertsen Bridging Large Air Gaps by Laser Welding with Beam Oscillation International Conference on Application of Lasers in Manufacturing, New Delhi, India (2015), pp. 31-32 CrossRefGoogle Scholar [28] W.-I. Cho, S.-J. Na Impact of wavelengths of CO2, disk, and green lasers on fusion zone shape in laser welding of steel J. Weld. Join., 38 (3) (2020), pp. 235-240 CrossRefView Record in ScopusGoogle Scholar [29] FLOW-3D User Manual. 2017. Version 11.2.1.06, Flow Science Inc. Google Scholar [30] W.-I. Cho, P. Woizeschke Analysis of molten pool behavior with buttonhole formation in laser keyhole welding of sheet metal Int. J. Heat Mass Transf., 152 (2020), Article 119528 ArticleDownload PDFView Record in ScopusGoogle Scholar [31] F. Vollertsen Loopless production: definition and examples from joining 69th IIW Annual Assembly and International Conference, Melbourne, Australia (2016) Google Scholar [32] V. Schultz, W.-I. Cho, A. Merkel, P. Woizeschke Deep penetration laser welding with high seam surface quality due to buttonhole welding Proc. of the IIW Annual Assembly, Com. IV, Bali, Indonesia (2018) IIW-Doc. IV-1390-18
Department of mechanical engineering, Technical University of Denmark (DTU), Building 425, 2800 Kgs., Lyngby, Denmark
Received 21 August 2020, Revised 18 November 2020, Accepted 25 November 2020, Available online 15 December 2020.
Abstract
Several different interfacial forces affect the free surface of liquid metals during metal additive manufacturing processes. One of these is thermo-capillarity or the so-called Marangoni effect. In this work, a novel framework is introduced for unraveling the effects of thermo-capillarity on the melt pool morphology/size and its thermo-fluid conditions during the Laser Powder Bed Fusion (L-PBF) process. In this respect, a multi-physics numerical model is developed based on the commercial software package Flow-3D. The model is verified and validated via mesh-independency analysis and by comparison of the predicted melt pool profile with those from lab-scale single-track experiments. Two sets of parametric studies are carried out to find the role of both positive and inverse thermo-capillarity on the melt pool shape and its thermal and fluid dynamics conditions. The thermo-fluid conditions of the melt pool are further investigated using appropriate dimensionless numbers. The results show that for the higher Marangoni number cases, the melt pool temperature drops, and at the same time, the temperature field becomes more uniform. Also, it is shown that at higher Marangoni numbers, temperature gradients decrease, thus reducing the role of conduction in the heat transfer from the melt pool. Furthermore, for the first time, a novel methodology is introduced for the calculation of the melt pool’s average Nusselt number. The average Nusselt numbers calculated for the positive and inverse thermo-capillarity are then used for finding the effective liquid conductivity required for a computationally cheaper pure heat conduction simulation. The results show that the deviation between the average melt pool temperature, using the pure conduction model with effective conductivity, and the one obtained from the advanced fluid dynamics model is less than 2%.
Keywords
Thermo-capillarity, Melt pool, Heat and fluid flow, Numerical model, L-PBF
Korea Abstract
금속 적층 제조 공정 중 액체 금속의 자유 표면에 여러 가지 다른 계면력이 영향을 미칩니다. 이들 중 하나는 열 모세관 또는 소위 Marangoni 효과입니다.
이 작업에서는 L-PBF (Laser Powder Bed Fusion) 공정 중 용융 풀 형태 / 크기 및 열 유동 조건에 대한 열 모세관의 영향을 밝히기 위한 새로운 프레임워크가 도입되었습니다.
이러한 점에서 상용 소프트웨어 패키지 Flow-3D를 기반으로 다중 물리 수치 모델이 개발되었습니다. 모델은 메쉬 독립 분석을 통해 그리고 예측 된 용융 풀 프로필을 실험실 규모의 단일 트랙 실험에서 얻은 프로필과 비교하여 검증 및 검증됩니다.
용융 풀 모양과 열 및 유체 역학 조건에 대한 양 및 역 열 모세관의 역할을 찾기 위해 두 세트의 매개 변수 연구가 수행됩니다. 용융 풀의 열 유동 조건은 적절한 무 차원 숫자를 사용하여 추가로 조사됩니다.
결과는 Marangoni 수가 더 높은 경우 용융 풀 온도가 떨어지고 동시에 온도 필드가 더 균일 해짐을 보여줍니다. 또한 Marangoni 수가 높을수록 온도 구배가 감소하여 용융 풀에서 열 전달에서 전도의 역할이 감소하는 것으로 나타났습니다.
또한 용융 풀의 평균 Nusselt 수를 계산하기위한 새로운 방법론이 처음으로 도입되었습니다. 그런 다음 양수 및 역 열 모세관에 대해 계산 된 평균 Nusselt 수는 계산적으로 더 저렴한 순수 열 전도 시뮬레이션에 필요한 효과적인 액체 전도도를 찾는 데 사용됩니다. 결과는 유효 전도도가 있는 순수 전도 모델을 사용한 평균 용융 풀 온도와 고급 유체 역학 모델에서 얻은 편차가 2 % 미만임을 보여줍니다.
A fundamental investigation of thermo-capillarity in laser powder bed fusion of metals and alloys Fig1A fundamental investigation of thermo-capillarity in laser powder bed fusion of metals and alloys Fig2A fundamental investigation of thermo-capillarity in laser powder bed fusion of metals and alloys Fig3A fundamental investigation of thermo-capillarity in laser powder bed fusion of metals and alloys Fig4A fundamental investigation of thermo-capillarity in laser powder bed fusion of metals and alloys Fig5A fundamental investigation of thermo-capillarity in laser powder bed fusion of metals and alloys Fig6A fundamental investigation of thermo-capillarity in laser powder bed fusion of metals and alloys Fig7A fundamental investigation of thermo-capillarity in laser powder bed fusion of metals and alloys Fig8A fundamental investigation of thermo-capillarity in laser powder bed fusion of metals and alloys Fig9A fundamental investigation of thermo-capillarity in laser powder bed fusion of metals and alloys Fig10A fundamental investigation of thermo-capillarity in laser powder bed fusion of metals and alloys Fig11
미크론 크기의 내화물 입자를 추가하여 Ti-6Al-4V 합금의 레이저 적층 제조중 계층적 입자 미세 조정
Xiang Wang, Lin-Jie Zhang, Jie Ning, Sen Li, Liang-Liang Zhang, Jian Long State Key Laboratory for Mechanical Behavior of Materials, Xi’an Jiaotong University, Xi’an 710049, China
Abstract
Ti-6Al-4V alloys mad by additive manufacturing (AM) with slower cooling rate (e. g., direct energy deposition (DED)) generally have the problem of severe coarsening of α phase. This study presents a method to refine the microstructure of the primary β phase formed during the solid–liquid transformation, microstructures formed during the β → α + β transformation, and recrystallized microstructures formed during the repeated heating cycles encountered in AM processes. This is accomplished by the in situ precipitation of nano-sized dispersed high-melting-point yttria Y2O3 particles. The addition of micron-sized particles with high melting points can refine primary crystallized grains and transformed grains corresponding to the secondary phase in Ti-6Al-4V alloys. In addition, they can effectively inhibit the recrystallization and growth of prior-deposited metal grains. The microstructural and tensile properties of laser additive manufactured with filler wire Ti-6Al-4V components with different amounts of Y2O3 (0, 0.12, and 0.22 wt%) were investigated. The refining effect of Y2O3 was significant and the tensile strength of Ti-6Al-4V containing 0.22 wt% Y2O3 in the longitudinal and transverse directions was greater than that of Ti-6Al-4V by approximately 12% and 9%, respectively. Concurrently, there was no loss in the elongation of the material in either direction. The strategy of using micron-sized refractory particles to control phase transformation (primary crystallization, solid-state phase transformation, and recrystallization) can be applied to the AM of different metals, in which microstructures are susceptible to coarsening.
냉각 속도가 느린 적층 제조(AM)에 의해 제조된 Ti-6Al-4V 합금은 일반적으로 α상(예: 직접 에너지 증착(DED)의 심각한 응고 문제를 가지고 있습니다. 이 연구는 고체-액체 변환 중에 형성된 1 차 β상의 미세 구조, β → α + β 변환 중에 형성된 미세 구조, AM 공정에서 발생하는 반복되는 가열주기 동안 형성된 재 결정화된 미세 구조를 정제하는 방법을 제시합니다.
이것은 나노 크기의 분산된 고 융점이 트리아 Y2O3 입자의 현장 침전에 의해 달성됩니다. 녹는 점이 높은 미크론 크기의 입자를 추가하면 Ti-6Al-4V 합금의 2 차 상에 해당하는 1차 결정 입자 및 변형된 입자를 정제 할 수 있습니다.
또한 사전에 증착된 금속 입자의 재 결정화 및 성장을 효과적으로 억제 할 수 있습니다. Y2O3 (0, 0.12, 0.22 wt %)의 양이 다른 필러 와이어 Ti-6Al-4V 성분으로 제조 된 레이저 첨가제의 미세 구조 및 인장 특성을 조사했습니다.
Y2O3의 정제 효과는 유의미했으며, Y2O3 0.22 wt %를 세로 및 가로 방향으로 포함하는 Ti-6Al-4V의 인장 강도는 Ti-6Al-4V보다 각각 약 12 % 및 9 % 더 컸습니다. 동시에 어느 방향으로도 재료의 연신율에 손실이 없었습니다.
미크론 크기의 내화 입자를 사용하여 상 변환 (1 차 결정화, 고체 상 변환 및 재결정 화)을 제어하는 전략은 미세 구조가 거칠어지기 쉬운 다양한 금속의 AM에 적용될 수 있습니다.
Nowadays, the requirements of customers undergo dynamic changes and industries are heading towards the manufacturing of customized end-user products, making market fluctuations extremely unpredictable. This demands the production industries to shift towards instantaneous product development strategies that can deliver products on the shortest lead time without compromise in the quality and accuracy. Direct metal deposition is one such evolving additive manufacturing (AM) technique that has found its application from rapid prototyping to production of real-time industrial components. In addition, the process is ideal for just-in-time manufacturing, producing parts-on-demand while offering the potential to reduce cost, energy consumption, and carbon footprint. The evolution of this advanced manufacturing technique had drastically reduced the manufacturing constraints and greatly improved the product versatility. This review provides insight into the evolution, current status, and challenges of metal additive manufacturing (MAM) techniques, starting from powder bed fusion and direct metal deposition. In addition to this, the review explores the variants of metal additive manufacturing with its process mechanism, merits, demerits, and applications. The efficiency of the processes is finally analysed using a time–cost triangle and the mechanical properties are comprehensively compared. The review will enhance the basic understanding of MAM and thus broaden the scope of research and development.
오늘날 고객의 요구 사항은 역동적 인 변화를 겪고 있으며 산업은 맞춤형 최종 사용자 제품의 제조로 향하고있어 시장 변동을 예측할 수 없게 만듭니다. 따라서 생산 산업은 품질과 정확성을 타협하지 않고 최단 리드 타임에 제품을 제공 할 수있는 즉각적인 제품 개발 전략으로 전환해야합니다. 직접 금속 증착은 쾌속 프로토 타이핑에서 실시간 산업 부품 생산에 이르기까지 응용 분야를 발견 한 진화하는 적층 제조 (AM) 기술 중 하나입니다. 또한이 프로세스는 적시 제조에 이상적이며 주문형 부품을 생산하는 동시에 비용, 에너지 소비 및 탄소 발자국을 줄일 수있는 잠재력을 제공합니다. 이 고급 제조 기술의 발전으로 제조 제약이 크게 줄어들고 제품의 다양성이 크게 향상되었습니다. 이 리뷰는 분말 베드 융합 및 직접 금속 증착에서 시작하여 금속 적층 제조 (MAM) 기술의 발전, 현재 상태 및 과제에 대한 통찰력을 제공합니다. 이 외에도이 리뷰에서는 프로세스 메커니즘, 장점, 단점 및 응용 프로그램과 함께 금속 적층 제조의 변형을 탐색합니다. 프로세스의 효율성은 마지막으로 시간-비용 삼각형을 사용하여 분석되고 기계적 특성이 포괄적으로 비교됩니다. 검토는 MAM에 대한 기본적인 이해를 높이고 연구 개발 범위를 넓힐 것입니다.
Keywords: Metal additive manufacturing, 3D Printing, Direct energy deposition, Electron beam meltingRapid prototyping
전산 유체 역학을 사용하여 GMAW에 대한 Marangoni 흐름에서 슬래그 이동의 수치 시뮬레이션
Dae-WonChoaYeong-DoParkbMuralimohanCheepucaBusan Machinery Research Center, Korea Institute of Machinery and Materials, 48, Mieumsandan 5-ro 41beon-gil, Gangseo-gu, Busan 46744, Republic of KoreabDepartment of Advanced Materials Engineering, Dong-Eui University, Busan, Republic of KoreacSuper-TIG Welding Co., Limited, Busan, Republic of Korea
Keywords : Marangoni flowMolten slag movementMolten pool behavorSurface tension gradient
Abstract
이 연구는 전산 유체 역학을 이용하여 스프레이 모드 가스 금속 아크 용접에서 생성되는 산화물인 용융 슬래그의 거동을 분석했습니다. 주로 규산염 (SiO2)으로 구성된 용융 슬래그는 용융 풀 표면에 있습니다. 일반적으로 용융 슬래그는 아크 플라즈마 경계 주변에서 생성된다고 가정합니다.
따라서 이 연구의 수치 시뮬레이션에서 슬래그는 특정 밀도와 크기를 가진 구형 입자로 모델링됩니다. Marangoni 유동 효과를 비교하기 위해 이 연구는 표면 장력 구배가 다른 두 가지 사례 (양수 및 음수)를 조사했습니다. 수치 시뮬레이션과 실험 결과 모두 음의 표면 장력 구배가 비드 가장자리에 갇힌 슬래그를 형성하는 반면 양의 표면 장력 구배는 상단 표면의 중앙에 갇힌 슬래그를 형성하는 것으로 나타났습니다.
This study analyzed the behavior of molten slag, which is an oxide generated during spray mode gas metal arc welding, with computational fluid dynamics. The molten slag, composed mainly of silicate (SiO2), is located on the molten pool surface. It is generally assumed that the molten slag is generated around the arc plasma boundary. Therefore, in the numerical simulation in this study the slag is modeled as a spherical particle, which has a specific density and size. To compare the Marangoni flow effect, this study investigated two different cases where the surface tension gradients were different (positive and negative). In both the numerical simulation and experimental results it was found that negative surface tension gradient formed trapped slag on the bead edge while the positive surface tension gradient formed trapped slag on the center of the top surface.
Numerical simulation of slag movement from Marangoni flow for GMAW with computational fluid dynamics Figures
가스 금속 아크 용접 (GMAW) 와이어의 합금 원소가 CMT (Cold Metal Transfer)에서 용접 풀 흐름 및 슬래그 형성 위치에 미치는 영향
Md. R. U. Ahsan1,3, Muralimohan. Cheepu2, Yeong-Do Park* 2,3 1Department of Mechanical Engineering, International University of Business, Agriculture and Technology, Dhaka 1230, Bangladesh. r.ahsan06me@gmail.com 2Department of Advanced Materials and Industrial Management Engineering, Dong-Eui University, Busan 47340, Republic of Korea. muralicheepu@gmail.com 3Department of Advanced Materials Engineering, Dong-Eui University, B
Abstract
용접시 표면 장력 구동 흐름 또는 마랑고니 흐름은 용접 비드 모양을 제어하는데 중요한 역할을 하므로 용접 접합 품질에 영향을 미칩니다. 용해된 금속의 표면 장력은 보통 음의 온도 계수를 가지므로 용접 풀이 중심에서 토우 방향으로 흐르게 됩니다.
표면 장력의 이 온도 계수는 황(S), 산소(O), 셀레늄(Se) 및 텔루륨(Te)과 같은 표면 활성 요소가 있는 경우 양의 계수로 변경할 수 있습니다. 소모품에 존재하는 탈산화 원소의 양이 용접 금속에 존재하는 산소량을 결정합니다. 탈산화제 양이 적으면 용접 금속에 산소 농도가 높아집니다.
적절한 양의 산소가 있으면 용융지에 표면 장력 구배의 양의 온도 계수가 발생할 수 있습니다. 이 경우 용접 풀은 토우에서 중앙 방향으로 흐릅니다. 그 결과, 아크와 용융지에 있는 화농성 반응의 경우, 합금 요소의 다양한 산화물이 슬래그(slag)라고 합니다. 슬래그는 용융지 표면에 떠서 용융지 흐름 패턴에 따라 누적됩니다.
그 결과, 슬래그는 용융지 흐름 패턴에 따라 용접 비드 중심 또는 토우 중심을 따라 형성됩니다. 슬래그는 용접 비드의 외관과 도장 접착력을 저하시키므로 제거해야 합니다. 쉽게 분리할 수 있기 때문에 용접 비드 중심 부근에서 슬래그가 형성되는 것이 좋습니다.
용접 풀의 현장 고속 비디오 촬영, 용접 금속 화학 성분 분석, 소모품 합금 요소가 용접 풀 흐름 패턴 및 슬래그 형성 위치에 미치는 영향이 공개되어 CMT-GMAW의 생산성 향상을 위해 용접 소모품 선택을 용이하게 할 수 있습니다.
The surface tension driven flow or Marangoni flow in welding plays an important role in governing weld bead shape hence affecting the weld joint quality. The surface tension of molten metal usually has a negative temperature coefficient causing the weld pool to flow from the center towards the toe.
This temperature coefficient of the surface tension can be altered to be a positive one in the presence of surface-active elements like sulfur (S), oxygen (O), selenium (Se) and tellurium (Te). The amount of deoxidizing elements present in the consumables governs the amount of oxygen present in the weld metal. The presence of a lower amount of deoxidizers results in higher concentration of oxygen in the weld metal.
The presence of adequate amount of oxygen can result in a positive temperature coefficient of surface tension gradient in the weld pool. In such situation, the weld pool flows from the toe towards the direction of the center. As a result, of pyrometallurgical reactions in the arc and the weld pool various oxides of the alloying elements are former which are referred as slag.
The slags float on the weld pool surface and accumulate following the weld pool flow pattern. As a result, slags form either along the center of the weld bead or the toe depending on the weld pool flow pattern. The slags need to be removed as they degrade the weld bead appearance and paint adhesiveness.
Due to easy detachability, slag formation near the center of the weld bead is desired. From in-situ high-speed videography of weld pool, weld metal chemical composition analysis, the effect of consumables alloying elements on weld pool flow pattern and slag formation location are disclosed, which can facilitate the selection of the welding consumables for better productivity in CMT-GMAW.
Weld bead surface images showing the slag formation location for (a) wire 1 and (b) wire 2.Fig. 2: High-speed movie frames and schematic showing
the weld pool flow pattern and the slag formation location
for wire 1 and wire 2.Fig. 3: Quantitative analysis data on slag
formation for different wire.
References
[1] S. Lu, H. Fujii, and K. Nogi: “Marangoni convection and weld shape variations in He-CO2 shielded gas tungsten arc welding on SUS304 stainless steel,” J. Mater. Sci., Vol. 43, No. 13 (2008), pp. 4583–4591. [2] Y. Wang and H. L. Tsai: “Effects of surface active elements on weld pool fluid flow and weld penetration in gas metal arc welding,” Metall. Mater. Trans. B, Vol. 32, No. 3 (2001), pp. 501–515. [3] P. Sahoo, T. Debroy, and M. J. McNallan: “Surface tension of binary metal-surface active solute systems under conditions relevant to welding metallurgy,” Metall. Trans. B, Vol. 19, No. 2 (1988), pp. 483–491. [4] M. J. Mcnallan and T. Debroy: “Effect of Temperature and in Fe-Ni-Cr Alloys Containing Sulfur,”Metall. Trans. B,Vol. 22, No. 4 (1991) pp. 557-560. [5] S. Kou, C. Limmaneevichitr, and P. S. Wei: “Oscillatory Marangoni flow: A fundamental study by conductionmode laser spot welding,” Weld. J., Vol. 90, No. 12 (2011), pp. 229–240. [6] M. Hasegawa, M. Watabe, and W. H. Young: “Theory of the surface tension of liquid metals,” J. Phys. F Met. Phys., Vol. 11, No. 8 (2000), pp. 173–177. [7] C. Heiple and J. Roper: “Effect of selenium on GTAW fusion zone geometry,” Weld. J., (1981), pp. 143–145. [8] C. R. Heiple and J. R. Roper: “Mechanism for Minor Element Effect on {GTA} Fusion Zone Geometry,” Weld. J., Vol. 61, (1982)pp. 97–102. [9] C. Heiple, J. Roper, R. Stagner, and R. Aden: “Surface active element effects on the shape of GTA, laser and electron beam welds,” Weld. J., (1983) pp. 72–77. [10] C. R. Heiple and P. Burgardt: “Effects of SO2 Shielding Gas Additions on GTA Weld Shape,” Weld. J., (1985) pp. 159–162. [11] P. F. Mendez, and T. W. Eagar: “Penetration and Defect Formation in High-Current Arc Welding,” Weld. J., (2003) pp. 296–306. [12] B. Ribic, S. Tsukamoto, R. Rai, and T. DebRoy: “Role of surface-active elements during keyhole-mode laser welding,” J. Phys. D. Appl. Phys., Vol. 44, No. 48 (2011), pp. 485–203. [13] C. Limmaneevichitr and S. Kou, “Experiments to simulate effect of Marangoni convection on weld pool shape,” Weld. J., Vol. 79, (2000)pp. 231–237. [14] C. Limmaneevichitr and S. Kou: “Visualization of Marangoni convection in simulated weld pools containing a surface-active agent,” Weld. J., vol. 79, No. 11 (2000), pp. 324–330. [15] Y. Wang and H. L. Tsai: “Impingement of filler droplets and weld pool dynamics during gas metal arc welding process,” Int. J. Heat Mass Transf., Vol. 44, No. 11 (2001), pp. 2067–2080. [16] S. Liu: “Pyrometallurgical Studies of Molten Metal Droplets for the Characterization of Gas Metal Arc Welding,” Proc 9thTrends in Welding Research Conf., Chicago, Illinois, June 2012, pp. 353–361. [17] Y. Umehara, R. Suzuki and T. Nakano: “Development of the innovative GMA wire improving the flow direction of molten pool” Quart. J. Japan Weld. Soc., Vol. 27, NO. 2 (2009), pp. 163–168.



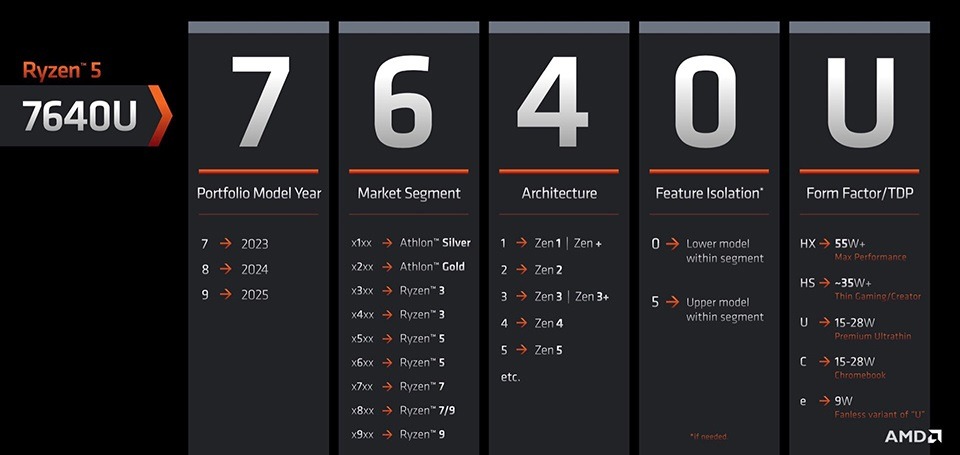


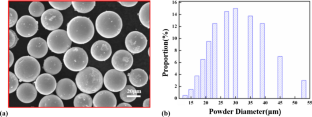
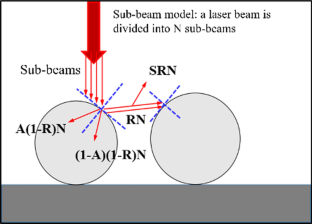
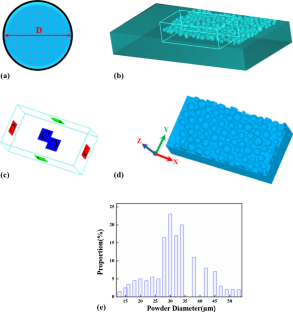
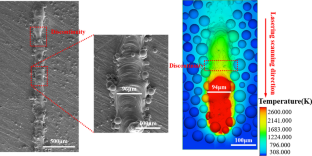
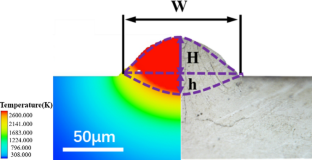
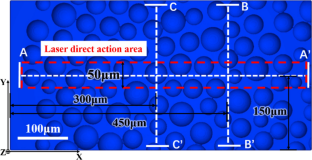
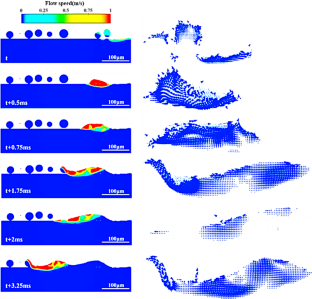
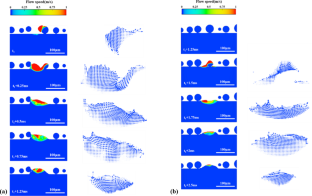
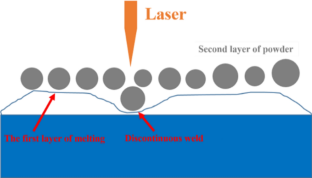

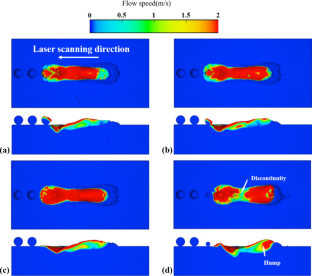
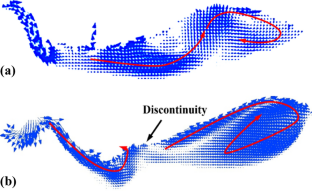
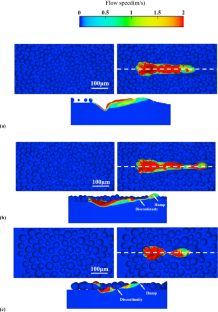
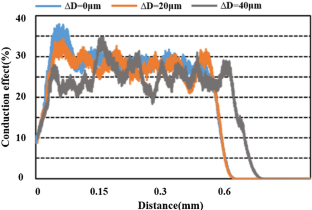
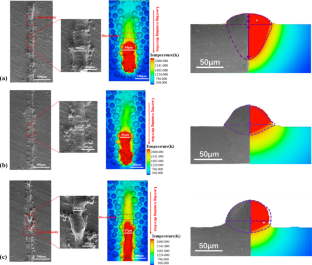
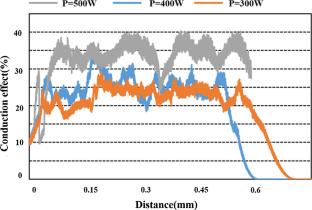
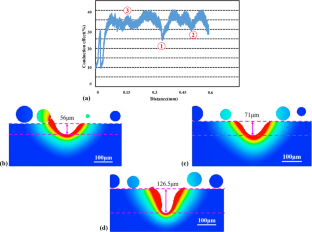
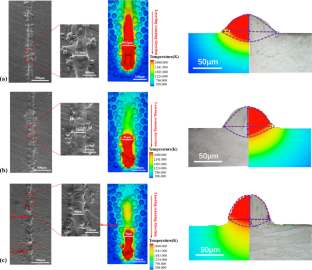
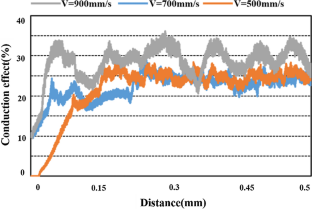
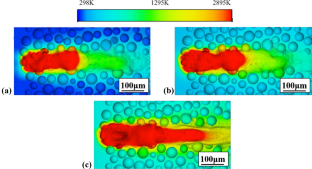


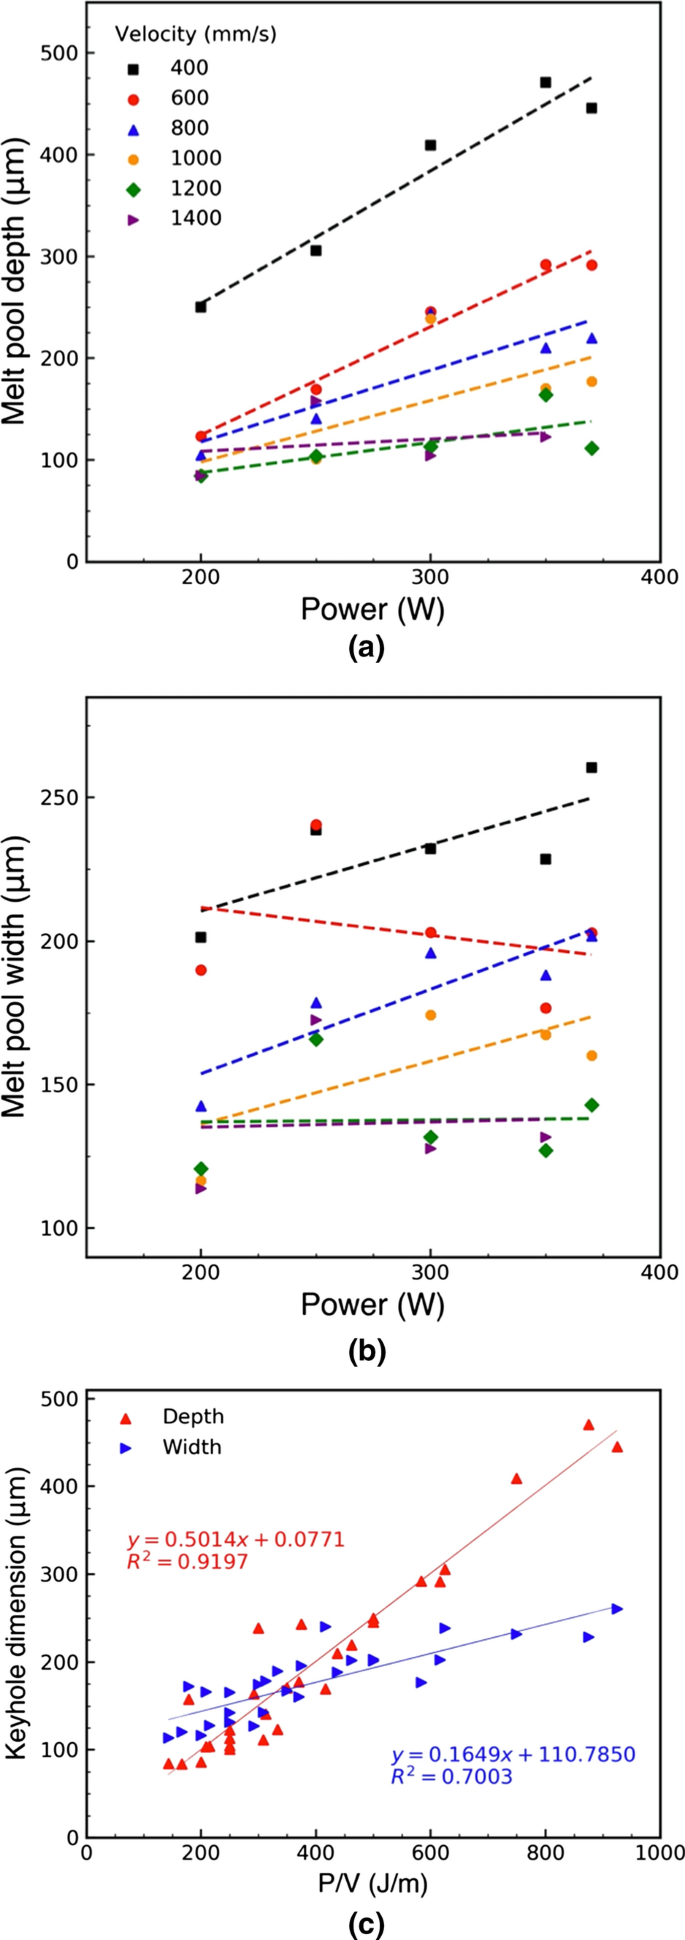
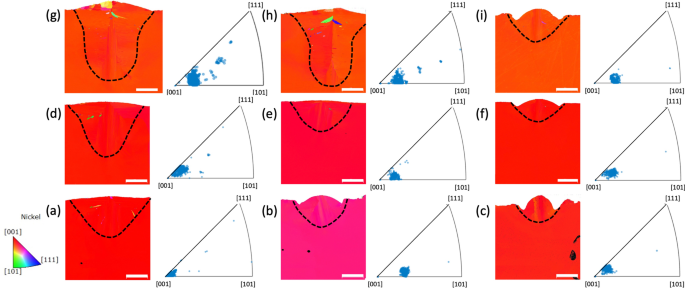
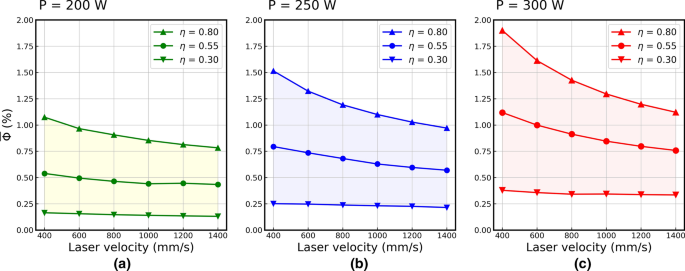
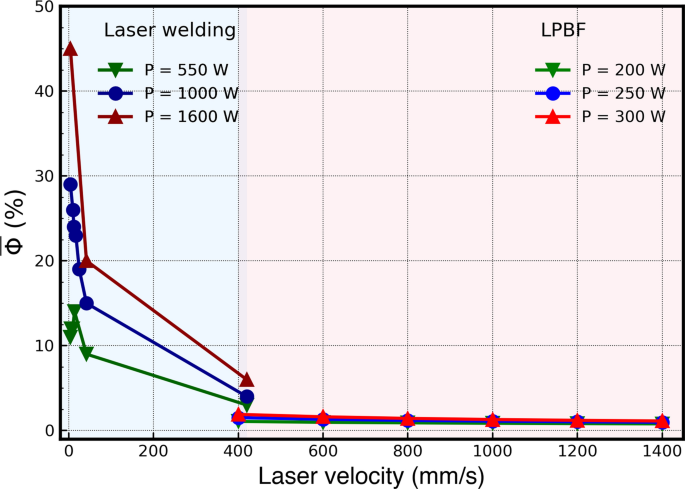
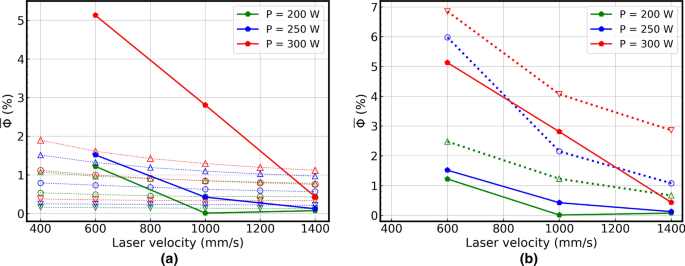
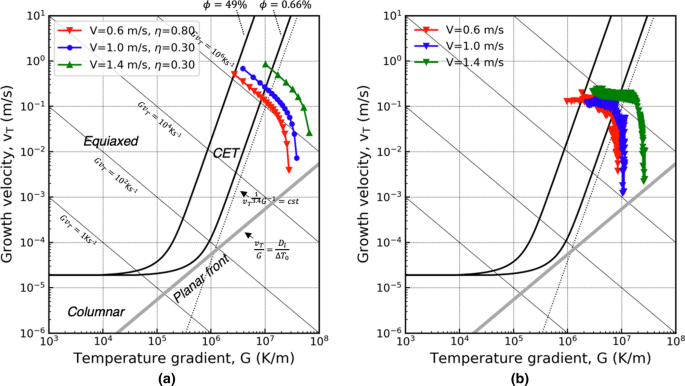
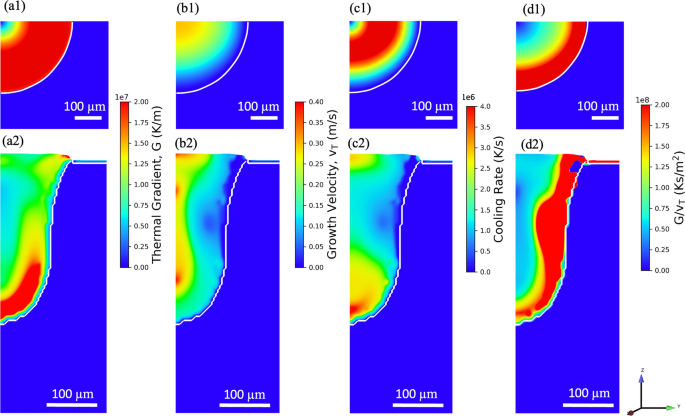
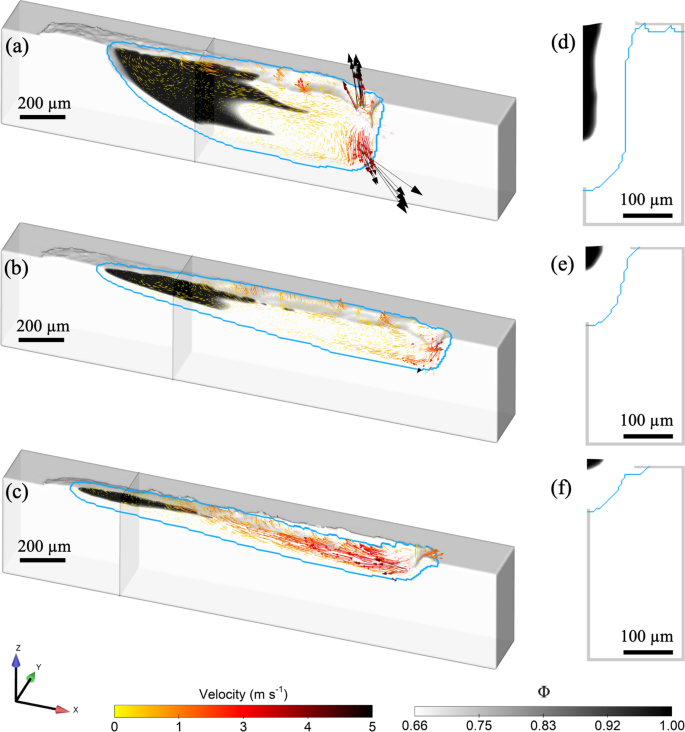


![Fig. 3 2D melt pool contours from the numerical model compared to experiments [16] for (a) VED = 65 J/mm3 at 7 mm from the beginning of the single track (b) VED = 103 J/mm3 at 3 mm from the beginning of the single track (c) VED = 103 J/mm3 at 7 mm from the beginning of the single track. In the 2D contour, the non-melted region is indicated in blue, and the melted region is indicated by red and green when the VED is 65 J/mm3 and 103 J/mm3 respectively.](https://flow3d.co.kr/wp-content/uploads/Fig.-3-2D-melt-pool-contours-from-the-numerical-model-compared-to-experiments.png)


と位置依存性(下)..png)
..png)

とマクロパルスの構造(下)..png)

とオリフィスの大口径-化(下)..png)
.図はマッハ-数のプロットである..png)


![Figure 1.1: Schematic Overview of Metal Laser Powder Bed Fusion Process [2]](https://flow3d.co.kr/wp-content/uploads/Figure-1.1-Schematic-Overview-of-Metal-Laser-Powder-Bed-Fusion-Process-2.png)


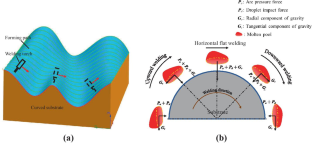


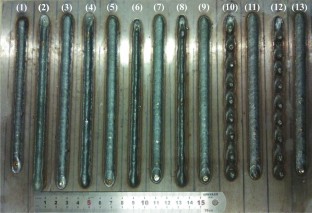

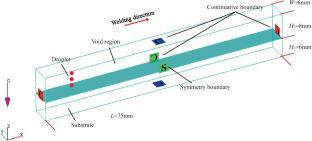
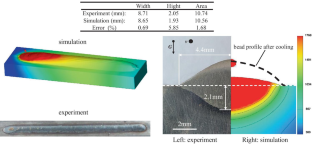
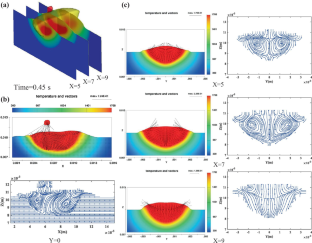
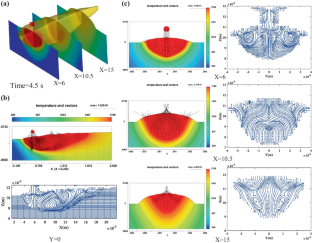
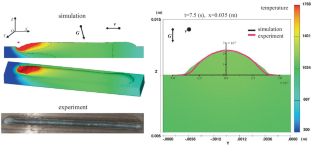
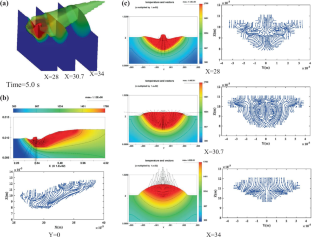
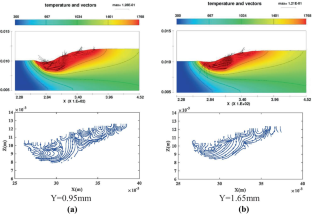
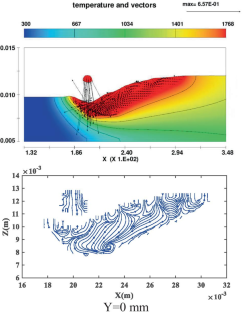
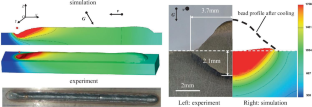
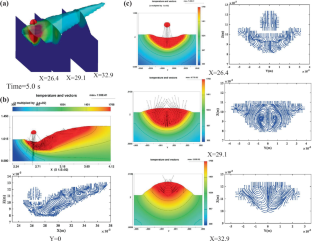
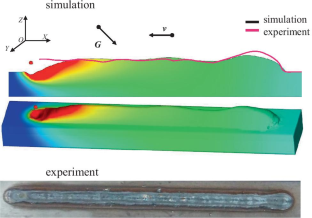
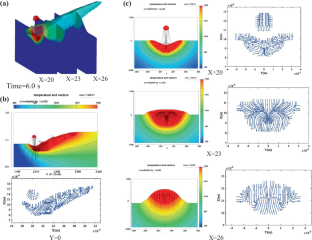
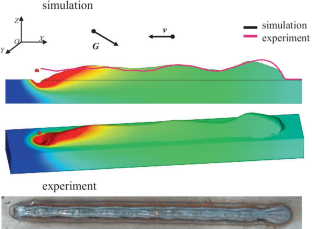
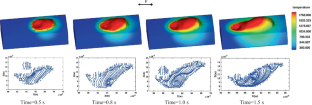
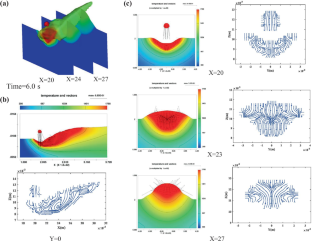
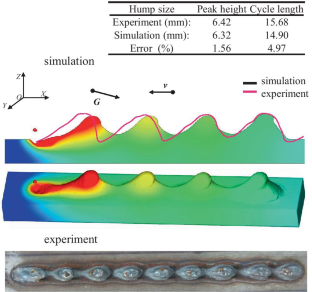
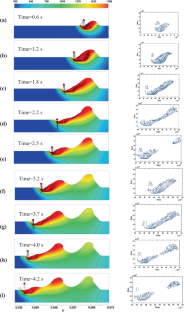
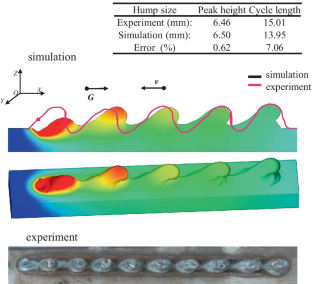
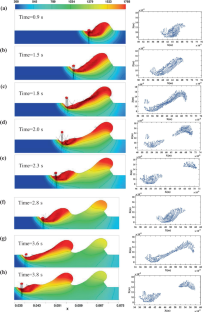

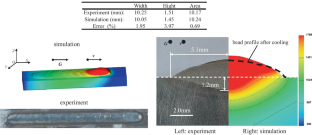
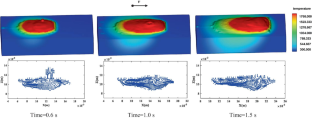
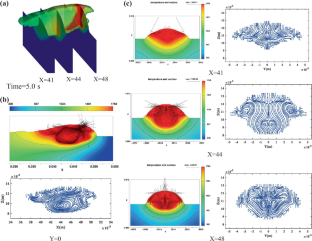
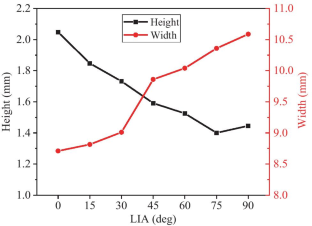
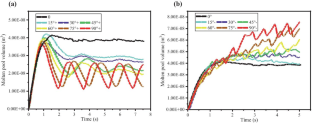
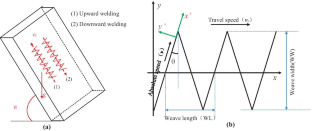
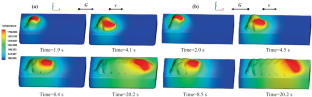
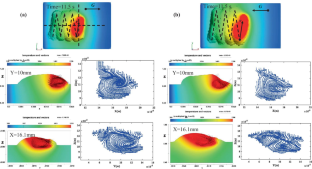
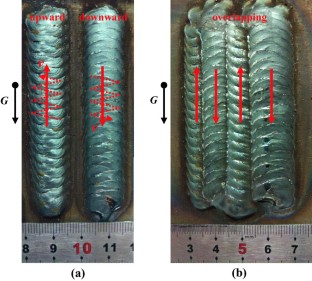
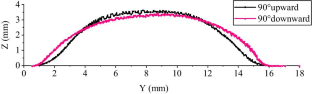


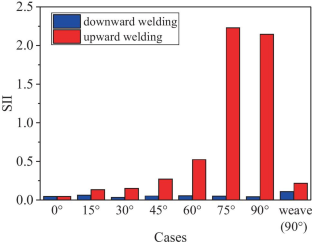


![Figure 11. A comparison among experiments [49], CFD and analytical simulations for deep keyhole top width and bottom width](https://flow3d.co.kr/wp-content/uploads/Figure-11.-A-comparison-among-experiments-49-CFD-and-analytical-simulations-for-deep-keyhole-top-width-and-bottom-width.png)


aspect-ratio-of-crystalline-grains-and(b)fluid-velocity.-.png)
of-melt-region-formed-by-scanning-electron-beam-and-corresponding-snap-shot-of-CtFD-simulation-colored-by-fluid-velocity.png)


