수치 불안정성

Numerical Instability / 수치 불안정성

Many numerical approximations to partial differential equations are unusable because they produce unstable computational results. Computational stability issues have been discussed in two previous articles in the CFD-101 series: Computational Stability and Heuristic Analysis. In this article, a simple mechanical model is described that leads to an understanding of common numerical instabilities associated with approximations of the Navier-Stokes equations. In particular, the simple model applies to instabilities arising from fluid dynamic forces such as viscous stress, surface tension, elasticity and more. The stability conditions obtained with the simple model do not depend on any particular numerical approximations, but instead involve only generic considerations of mass and forces.

편미분 방정식의 많은 수치 근사는 불안정한 계산 결과가 발생하므로 불안정합니다.  계산 안정성의 문제는 “전산 유체 역학 모델의 기초”시리즈의 마지막 2 항, 즉 계산 안정성과 휴리스틱분석 에서 논의되고 있습니다.  이 절에서는 나비에-스토크스 방정식과 관련된 일반적인 수치 불안정성의 이해로 이어질 간단한 기계적 모델에 대해 설명합니다.  이 간단한 모델은 특히 점성 응력, 표면 장력, 탄성 등의 유체 역학적인 힘에서 발생하는 불안정성에 적용됩니다.  간단한 모델에 의해 얻어지는 안정성 조건은 특정 수치 근사에 의존하지 않지만 대신 질량과 힘에 대한 일반적인 고려 사항만을 포함합니다.

The Model System

Figure 1. Model System

Imagine a mass M located between two rigid walls and connected to the walls by springs, as shown in Fig. 1. Assuming that the springs satisfy Hook’s law in which a spring force on the block is proportional to the change in length of the spring, an equation of motion for the block, which moves in only the horizontal direction is,

그림 1과 같이 두 강체 벽 사이에 위치하고 그 벽에 스프링으로 연결된 질량 M을 가정합니다.  블록에 작용하는 스프링 힘이 스프링의 길이의 변화에 비례하는 훅의 법칙을이 스프링이 채운다고 가정했을 경우, 수평 방향으로만 이동하는 블록의 운동 방정식은 다음과 같이됩니다.

(1)     \displaystyle M\frac{\partial U}{\partial t}=-2k\left( X-{{X}^{0}} \right)

Symbol X0 indicates the initial x position of the block and M is the block mass. Initially X=X0 and the block is at rest, U=0. Now imagine a perturbation given to the block by assigning a velocity of U0 at time t=0. After a small time interval δt the block moves to position X1=X0+U0δt and a simple discretization of Eq. 1 gives the velocity at the end of the time interval as,

기호 X0는 블록의 초기 x 위치를 나타내는 기호 M은 블록의 질량을 나타냅니다.  초기 상태에서는 X = X0이며, 블록은 정지하고, U = 0입니다.  여기서, 시간 t=0에서 속도 U=0을 지정하여 블록에 섭동을 준다고 가정합니다.  작은 시간 간격 δt 후 블록은 위치 X 1 = X 0 + U 0 δt로 이동하여 식 1의 간단한 이산화에 의해 시간 간격의 마지막의 속도는 아래 식과 같이 표현됩니다.

(2)     \displaystyle M\left( \frac{{{U}^{1}}-{{U}^{0}}}{\delta t} \right)=-2k\left( {{X}^{1}}-{{X}^{0}} \right)

Replacing X1 by its value X0+U0 δt and rearranging gives an equation for the new velocity U1,

X1을 값 X0 + U0 δt로 치환하여 정리하면 새로운 속도 U1의 식을 얻을 수 있습니다.

(3)     \displaystyle {{U}^{1}}={{U}^{0}}\left( 1-2\frac{k\delta {{t}^{2}}}{M} \right)

This is a recursion in which for each successive time-step the velocity at the end of the time step is equal to the previous value of the velocity times the bracketed quantity in Eq. 3, so that after n time steps,

이것은 재귀 식이고, 연속하는 각 시간 단계에 대해 그 시간 단계의 마지막에 속도가 이전 시간 단계의 속도 값으로 식 3의 괄호 안의 금액을 곱한 값과 같아, n 시간 단계 후에는 아래와 같이됩니다.


(4)     \displaystyle {{U}^{n}}={{U}^{n-1}}\left( 1-2\frac{k\delta {{t}^{2}}}{M} \right)={{U}^{0}}{{\left( 1-2\frac{k\delta {{t}^{2}}}{M} \right)}^{n}}

Note that the superscript n on the bracketed quantity in Eq. 4 is an exponent, not a time level index, although its value in this case is the same as the time level index. From Eq. 4 we see that if the quantity in the bracket has an absolute magnitude larger than 1.0 the velocity Un will increase exponentially with increasing n. Thus, to prevent the exponential growth of the velocity in this model system, the time-step size must be limited to satisfy the following inequality,

식 4의 괄호 안의 금액의 위 첨자가 시간 수준 지표가 아닌 지수인 것에주의하십시오.  그러나 이 경우 지수 값과 시간 수준 지표는 동일합니다.  식 4에서 괄호 안의 금액이 1.0보다 큰 절대 값을 가지는 경우, 속도 Un은 n의 증가와 함께 지수 적으로 증가하는 것을 알 수 있습니다.  따라서 이 모델 시스템에서 속도의 기하 급수적 증가를 막기 위해서는 다음의 부등식을 만족하도록 시간 단계 크기를 제한하는 것이 필요합니다.

(5)     \displaystyle \frac{k\delta {{t}^{2}}}{M}\le 1

When the left hand side of Eq. 5 is greater than one, the velocity Un will oscillate between positive and negative values on consecutive time steps while exponentially increasing in magnitude.

식 5의 왼쪽이 1보다 큰 경우 속도 Un은 크기가 기하 급수적으로 증가하면서, 연속 시간 단계에서 양수와 음수 사이를 진동하게됩니다.

This behavior is characteristic of a classical numerical instability. In this case, Eq. 5 shows that the instability can be prevented by keeping δt small enough to satisfy the inequality. As a general rule when a numerical instability occurs and exhibits the character of increasing plus and minus values on successive time steps it can be cured by reducing the time-step size.

이 동작은 고전적인 수치 불안정성의 특징입니다.  이 예에서는 불평등을 충족 δt를 충분히 작게 유지하여 불안정성을 막는 것이 가능하다고 식 5로 표시되어 있습니다.  일반적으로 수치 불안정성이 발생하여 연속 시간 단계에서 증가하는 긍정적이고 부정적인 값의 특징이 나타난 경우는 시간 단계 크기를 작게함으로써 해결할 수 있습니다.

Exploring this simple mechanical model further we can see from Eq. 4 that the instability results from an overreaction to an initial action. That is, when the time-step size large, Eq. 4 predicts a new velocity in the opposite direction and with a larger magnitude. This excessive velocity then becomes the starting condition for the subsequent time step, leading to an exponential increase in the velocity magnitude.

이 간단한 기계적 모델을 더 고려하면 불안정성이 초기 작용에 대한 과민 반응에 기인하는 것으로 식 4에서 알 수 있습니다.  즉, 시간 단계 크기가 큰 경우, 식 4는 반대 방향의 크기가 커진 새로운 속도가 예상됩니다.  이 과잉 속도가 이번에는 다음 시간 단계의 시작 조건이 속도의 크기의 지수적인 증가로 이어집니다.

The stability condition in Eq. 5 is based on an explicit formulation, meaning that the current response of the mass is expressed in terms of the previous displacement. An implicit formulation,where the current response of the mass is based on the subsequent position of the mass (i.e., using X2 in Eq. 2 instead of X1) would likely be unconditionally stable, but it requires a knowledge of the unknown final position X2. For most equations implicit methods require an iterative solution, and the additional computational effort required for such solutions is the price that must be paid to eliminate the stability condition.

식 5의 안정성 조건은 explicit 배합에 따라 있습니다.  이것은 질량의 현재 응답이 이전의 변위에 의해 표현되는 것을 의미합니다.  질량의 현재 응답이 후속 위치에 따른 implicit 공식화 (즉, 식2의 X1 대신 X2를 사용)는 무조건 안정이라고 생각됩니다 만, 미지의 최종 위치 X 2 이어야 합니다.  대부분의 방정식의 경우, implicit 해법은 반복 분석이 필요하기 때문에 반복 분석에 필요한 추가의 계산량은 안정성 조건을 없애기 위해 지불해야하는 대가입니다.

Application to the Navier-Stokes Equation

To use the above mechanical model of a numerical instability to understand instabilities that may occur in the Navier-Stokes equation imagine two elements of an Eulerian computational grid in which a perturbation is made to a velocity on the boundary separating two elements, as shown in Fig. 2.

위의 기계적 모델의 수치 불안정성을 이용하여 나비에-스토크스 방정식에서 발생할 수 있는 불안정성을 이해하기 위해 그림 2와 같이 두 개의 요소를 나눌 경계의 속도에 섭동이 된 오일러 계산 격자에 의한 2 개의 요소를 가정합니다.
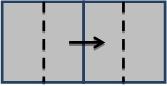
Grid model

Figure 2. Grid Model

For simplicity, think of the elements outlined by solid lines as cubes of equal size, and that the vector represents a velocity in the x direction. The dashed lines in the centers of the elements (i.e., y-z planes) define the extent of the partial volumes of the elements assigned to the u velocity. The total mass of fluid in the partial volumes correlates to the mass M in the mechanical model. When the velocity U moves fluid between elements the elements respond by generating forces that act to counter the velocity, much like the springs in the mechanical model. These forces may arise because of compression or expansion of the fluid, viscous stresses, surface tension (if there is a fluid interface within the fluid mass M) or other forces. By identifying the appropriate stiffness coefficient k in each case we can use Eq. 5 to arrive at a stability criterion for that physical process when using an explicit numerical approximation in a grid like that shown in Fig. 2.

간단히, 실선에 의해 윤곽이 그려져 있는 요소가 동일 크기의 입방체라고하고 벡터 x 방향의 속도를 나타내는 것으로 생각합니다.  두 요소의 중앙 (즉 yx 평면)의 점선에 의해 속도 U에 할당 된 요소의 부분 체적의 범위가 정의됩니다.  부분 체적 내에 유량의 전체 질량은 기계적 모델의 질량 M과 상관 관계가 있습니다.  속도 U는 응답 요소 사이의 유체가 이동 된 경우 기계적 모델 스프링과 마찬가지로 속도에 대항하여 작용하는 힘을 발생하여 요소는 응답합니다.  이러한 힘은 유체 점성 응력, 표면 장력 (유체와 질량 M의 범위 내에 유체 계면가있는 경우) 또는 기타의 힘에 의한 압축 또는 인장으로 인해 발생 될 수 있습니다.  각 예에서 적절한 강성 계수 k를 특정하여 그림 2와 같은 격자에서 양으로 수치 근사를 사용하는 경우, 식 5를 사용하여이 물리적 과정에 대한 안정성 기준에 도달 가능합니다.

Several examples of how this analogy can be applied are given in the following sections. In each case the mass M of the fluid in the partial volumes is given by,

이 유사성을 어떻게 적용 할 수 있는지에 대한 예는 다음 절에서 설명합니다.  각 예에서 부분 부피의 유체의 질량 M은 아래 식에 의해 주어집니다.

(6)     \displaystyle M=\rho \delta x\delta y\delta z,

where ρ is the density of the fluid and elements have dimensions δx, δy and δz.

여기서, ρ는 유체의 밀도이며, 요소의 치수는 δx, δy와 δz입니다.

Compressible Fluids

To find the stiffness coefficient, k, recall that k is a measure of the force generated to resist an applied perturbation. For a compressible fluid this force is related to the change in fluid pressure because of a change in fluid density according to the thermodynamic relation dp=c2dρ, where c is the speed of sound in the fluid. The fluid mass moved across the boundary between the elements is ρUδt*δyδz and the change in density in the element receiving the mass is this mass change divided by the volume of the element, dρ=ρUδt/(δx). The corresponding change in element pressure is then given by

강성 계수 k를 요구하려면, k가 더해진 섭동에 저항하기 위해 만들어지는 힘의 척도임을 기억하십시오.  압축성 유체의 경우,이 힘은 유체 압력의 변화와 관련이 있습니다.  이것은 열역학적 관계 dp = c 2 dρ 의한 유체 밀도의 변화에 의한 것입니다.  여기서 c는 유체의 음속입니다.  요소 사이의 경계를 넘어 이동 한 유체의 질량은 ρUδt * δyδz이며, 질량을받는 요소에서의 밀도 변화는이 질량을 요소의 부피로 나눈 dρ = ρUδt / (δx)입니다.  그 결과, 요소 압력의 대응하는 변화는 아래에 제공됩니다.

(7)     \displaystyle dp={{c}^{2}}d\rho =\frac{\rho {{c}^{2}}U\delta t}{\delta x}.

The force responding to the U velocity perturbation in each element is the product of the pressure change from Eq. 7 and the cross sectional area of the element δyδz. The effective stiffness of an element k, is therefore the force divided by the initial displacement Uδt,

각 요소의 속도 U의 섭동에 응답하는 힘은 식 7에 의한 압력 변화와 요소 단면적 δyδz의 곱입니다.  따라서 요소의 유효 강성 k는 힘을 초기 변위 Uδt로 나눈 것입니다.

(8)     \displaystyle k=\frac{\rho {{c}^{2}}U\delta t\delta y\delta z}{\delta xU\delta t}=\frac{\rho {{c}^{2}}\delta y\delta z}{\delta x}

Substituting this value for k and the definition for M, from Eq. 6, into the stability condition Eq. 5 results in the stability condition for compressible fluids,

이 k의 값과 식 6에 따르면 M의 정의를 안정성 조건 식 5에 대입하여 압축성 유체의 안정성 조건을 얻을 수 있습니다.

(9)    \displaystyle \frac{k\delta {{t}^{2}}}{M}={{\left( \frac{c\delta t}{\delta x} \right)}^{2}}\le 1.

This is the well-known Courant condition than restricts the distance a sound wave travels in one time step to be less than the width of a computational element. An analogy with the simple mechanical model has provided this result without the need to write out an equation for pressure waves in a compressible fluid and then perform a stability analysis on that equation.

이것은 하나의 시간 스텝 중에 음파가 진행하는 거리를 계산 요소의 폭보다 짧게 제한하는 잘 알려진 쿨랑 조건입니다.  간단한 기계적 모델과의 유사성에 따라 압축성 유체 음파 방정식을 기술하고, 그 방정식에 의한 안정성 분석을 수행 할 필요없이이 결과를 얻을 수 있었습니다.

Viscous Stresses / 점성 응력

The viscous forces that are generated in response to a perturbed velocity U in a fluid of viscosity μ consist of shears in the x, y and z directions. For example, the shear stress on the lower surface of the element for the velocity U is μU/δz, assuming that the velocity in neighboring cells is zero. There is a corresponding stress at the upper surface of the element. Each of these stresses act on a surface of area δxδy (in the current example) to produce a viscous force. Similarly, there are stresses in the x and y direction acting on their corresponding areas. In each direction there are force pairs (similar to the two springs) but because of Eq. 5 it is necessary to use the effective k for a single spring. This is half of the total of all the the viscous forces divided by the initial displacement Uδt,

점도 μ의 유체의 섭동 속도 U에 대해 생성되는 점성 힘은 x, y 및 z 방향의 전단력으로 구성됩니다.  예를 들어, 인접 셀의 속도가 0이라고 가정하면 속도 U에 요소의 아랫면에 작용하는 전단 응력은 μU / δz입니다.  요소의 표면에는 압축 응력이 발생합니다.  이러한 응력의 각각은 표면적 δxδy (본 예의 경우)에 작용하고 점성 힘을 발생합니다.  마찬가지로 해당 면적에 작용하는 x 및 y 방향의 응력도 존재합니다.  각 방향에서 (2 개의 봄처럼) 세트 힘이 존재하지만, 식 5를 위해 1 개의 봄의 유효 강성 k를 사용하는 것이 필요합니다.  이것은 모든 점성 힘의 합계를 초기 변위 Uδt로 나눈 것의 절반입니다.

(10)     \displaystyle k=\mu \left( \frac{U\delta y\delta z}{\delta x}+\frac{U\delta x\delta z}{\delta y}+\frac{U\delta x\delta y}{\delta z} \right)\frac{1}{U\delta t}.

Inserting this value for k and using Eq. 6 for M into the stability condition for the mechanical model given in Eq. 5 yields

식 5에 의해 주어진 기계적 모델의 안정 조건에 k의 값을 넣고 M 식 6을 사용하면 아래 식을 얻을 수 있습니다.

(11)     \displaystyle \frac{k\delta {{t}^{2}}}{M}=\frac{\mu }{\rho }\left( \frac{1}{\delta {{x}^{2}}}+\frac{1}{\delta {{y}^{2}}}+\frac{1}{\delta {{z}^{2}}} \right)\delta t\le 1.

Equation 11 is the stability condition for explicit viscous stresses approximated in an Eulerian grid.

식 11은 오일러 격자에 근접한 explicit 점성 응력의 안정성 조건입니다.

Surface Tension
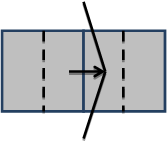
Grid model with deformed interface

Figure 2A. With deformed interface.

Imagine a fluid interface located between the two elements that is deformed by a U velocity perturbation, as shown in Fig. 2A. In this case the reaction is a surface tension force on each of the segments of the surface illustrated in Fig. 2A. For simplicity, assume a two-dimensional surface (e.g., no variation in the z direction) and a constant surface tension coefficient σ.

그림 2A와 같이 속도 섭동 U에 의해 변형된 2 개의 요소 사이에 위치하는 유체 계면을 상정합니다.  이 예에서, 반응은 그림 2A에 표시된 표면의 각 구분에 작용하는 표면 장력에 의한 힘입니다.  간단히 2 차원 표면 (예 : z 방향의 변화없이)과 일정한 표면 장력 계수를 가정합니다.


Surface tension in each segment acts tangentially along the surface so the force responding to the U velocity is the x component of that force, i.e., the surface tension coefficient times the sine of the angle of the surface segment with respect to the vertical. For a small initial displacement, the x-force from each surface segment can be approximated by σUδtδz/δy giving the resulting stiffness coefficient,

 각 구분의 표면 장력은 표면에 따라서 접선 방향으로 작용하기 때문에 속도 U에 대응하는 힘은 표면 장력의 x 성분입니다.  즉, 수직의 표면 구분 각도의 사인을 표면 장력에 곱한 것입니다.  작은 초기 변위의 경우 각 표면 세그먼트에서 x 방향의 힘은 σUδtδz / δy 의해 근사 할 수 있으며, 그 결과로 다음의 강성 계수를 얻을 수 있습니다.

(12)    \displaystyle k=\left( \frac{\sigma U\delta t\delta z}{\delta y} \right)\frac{1}{U\delta t}

Substituting this k and M into Eq. 5 gives the stability condition for surface tension,

이 k와 M을 식 5에 대입하면 표면 장력에 대한 안정성 조건을 얻을 수 있습니다.

(13)     \displaystyle \frac{k\delta {{t}^{2}}}{M}=\frac{\sigma }{\rho }\frac{\delta {{t}^{2}}}{\delta x\delta {{y}^{2}}}\le 1.

This result appears somewhat odd because of the different exponents of the δx and δy factors, but for cubic or square elements this makes no difference. For non-uniform elements, however, we should perform a similar evaluation in the y and z directions and then use the most restrictive of the results. In any case, this is a reasonable and useful result from a very simple model based on action and reaction principles.

이 결과는 δx과 δy 지수가 다르기 때문에 다소 이상하게 보이지만, 입방체 또는 사각형 요소의 경우 그 영향은 없습니다.  하지만 For non-uniform 요소의 경우 y 및 z 방향에서 비슷한 평가를 실시하여 가장 제한적인 결과를 사용할 수 있어야합니다.  어쨌든, 이것은 작용과 반작용의 원리에 근거한 매우 간단한 모델에 의한 합리적이고 유익한 결과입니다.

Bulk Elasticity / 체적 탄성

For a fluid with elastic properties the U velocity perturbation is resisted by an elastic stress in a way that closely resembles a spring. If ε is the bulk modulus of the fluid then the stress associated with extension or compression in an element is εUδt/δx. This stress acts over the surface area δyδz, and the stiffness k is this force divided by the displacement Uδt. Substituting this into Eq. 5 provides the stability condition,

탄성 특성을 가진 유체의 경우 속도 U의 섭동은 스프링과 잘 닮은 형식의 탄성 응력에 의해 제한됩니다.  유체의 체적 탄성률이 ε의 경우 요소의 인장 또는 압축에 관련하는 응력은 εUδt / δx입니다.  이 응력은 표면적 δyδz 작용하고 강성 k는이 힘을 변위 Uδt로 나눈 것입니다.  이것을 식 5에 대입하면 아래의 안정성 조건을 얻을 수 있습니다.

(14)     \displaystyle \frac{k\delta {{t}^{2}}}{M}=\frac{\varepsilon }{\rho }\frac{\delta {{t}^{2}}}{\delta {{x}^{2}}}\le 1.
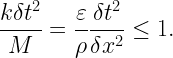
Similar results exist for the y and z directions.

비슷한 결과가 y 및 z 방향으로도 존재합니다.

Concluding Remarks

A simple mechanical model has been used to illustrate a common type of numerical instability, that arises from an action-reaction process. Using this simple model it is possible to quickly derive a variety of stability conditions for fluid dynamic forces modeled by explicit finite difference approximations in an Eulerian grid. The stability conditions are derived by using mass and force concepts in fluids that are analogous to the mass and forces in the model mechanical system. Significantly, the stability conditions arrived at are generic and do not depend on specific finite-difference approximations. Additionally, these derivations provide a simple way to understand the mechanisms driving the unstable behavior.

간단한 기계적 모델을 사용하여 작용과 반응 과정에서 발생하는 일반적인 유형의 수치 불안정성에 대해 설명했습니다.  이 간단한 모델을 사용하여 오일러 격자의 양으로 유한 차분 근사에 의해 모델링 된 유체 역학적인 힘에 대한 다양한 안정성 조건을 신속하게 도출 할 수 있습니다.  이러한 안정성 조건은 기계적 모델 시스템의 질량과 힘 유사한 유체의 질량과 힘의 개념을 이용하여 도출됩니다.  중요한 점은 도달한 안정성 조건이 일반적이며 특정 유한 차분 근사에 의존하지 않는 것입니다.  또한이 도출에 의해 불안정한 거동을 야기 메커니즘을 이해하는 간단한 방법도 제공됩니다.

The approach taken here could be extended to other types of physical forces (e.g., electrical, non-inertial, etc.) and even advective processes could be included by using the analogy that a change in momentum resulting from advection could be thought of as the result of an equivalent force.

여기서 사용한 방법은 다른 유형의 물리적 힘 (예 : 전기적 힘 비 관성력 등)로 확장 할 수 있으며, 이류(advective )에 의해 생기는 운동량의 변화를 등가 힘의 결과로 생각되면 유사성을 이용함으로써 이류 과정조차 포함 할 수 있습니다.

Furthermore, more refined estimates of the stiffness coefficient, for instance, by including more dimensional effects, could be added to enhance the stability conditions. In any case, the object here is to show that numerical instabilities can often be understood from a simple analysis. It is hoped that the insight this provides might guide the development of more robust and accurate numerical approximations.

또한, 예를 들어 더 많은 차원 효과를 포함하여 강성 계수보다 정밀한 추정을 추가하고 안정성 조건을 강화 할 수 있습니다.  어쨌든 여기에서의 목표는 대부분의 경우 수치 불안정성을 간단한 분석에서 이해하고 보여주는 것입니다.  여기에 제공된 통찰력이 더 강력하고 정확한 수치 근사치의 개발로 이어질 것으로 기대됩니다.

난류 모델링

본 자료는 국내 사용자들의 편의를 위해 원문 번역을 해서 제공하기 때문에 일부 오역이 있을 수 있어서 원문과 함께 수록합니다. 자료를 이용하실 때 참고하시기 바랍니다.

Turbulence Modeling

The majority of flows in nature are turbulent. This raises the question, is it necessary to represent turbulence in computational models of flow processes? Unfortunately, there is no simple answer to this question, and the modeler must exercise some engineering judgment. The following remarks cover some things to consider when faced with this question.

난류 모델링

자연에서의 흐름은 대부분은 난류입니다. 이것은 유동의 수치해석 모델에서 난류를 표현할 필요가 있는가? 에 대한 의문이 생깁니다.  불행히도이 질문에 대한 답은 모델링을 할 경우 엔지니어가 공학적인 판단을 내려야합니다.  다음에 이 질문에 직면했을 때 고려해야 할  몇 가지를 설명합니다.

Definitions and Orders of Magnitude

The possibility that turbulence may occur is generally measured by the flow Reynolds number:

난류가 발생할 가능성은 일반적으로 흐름의 레이놀즈 수에 의해 측정됩니다.

where ρ is fluid density and μ is the dynamic viscosity of the fluid. The parameters L and U are a characteristic length and speed for the flow. Obviously, the choice of L and U are somewhat arbitrary, and there may not be single values that characterize all the important features of an entire flow field. The important point to remember is that Re is meant to measure the relative importance of fluid inertia to viscous forces. When viscous forces are negligible the Reynolds number is large.

여기서 ρ는 유체 밀도이고 μ는 유체의 동적 점도입니다. 매개 변수 L과 U는 흐름의 특성 길이와 속도입니다. 분명히 L과 U의 선택은 다소 임의적이며, 전체 유동장의 모든 중요한 특징을 특징 짓는 단일 값이 없을 수도 있습니다. 기억해야 할 중요한 점은 Re가 점성력에 대한 유체 관성의 상대적 중요성을 측정한다는 것입니다. 점성력을 무시할 수있는 경우 레이놀즈 수가 큽니다.

A good choice for L and U is usually one that characterizes the region showing the strongest shear flow, that is, where viscous forces would be expected to have the most influence.

L과 U에 대한 좋은 선택은 일반적으로 가장 강한 전단 흐름을 나타내는 영역, 즉 점성 힘이 가장 큰 영향을 미칠 것으로 예상되는 영역을 특징 짓는 것입니다.

Roughly speaking, a Reynolds number well above 1000 is probably turbulent, while a Reynolds number below 100 is not. The actual value of a critical Reynolds number that separates laminar and turbulent flow can vary widely depending on the nature of the surfaces bounding the flow and the magnitude of perturbations in the flow.

대략적으로 말하면, 1000을 훨씬 넘는 레이놀즈 수는 아마도 난류 일 수 있지만 100 미만의 레이놀즈 수는 그렇지 않습니다. 층류와 난류를 분리하는 임계 레이놀즈 수의 실제 값은 유동을 경계하는 표면의 특성과 유동의 섭동의 크기에 따라 크게 달라질 수 있습니다.

In a fully turbulent flow a range of scales exist for fluctuating velocities that are often characterized as collections of different eddy structures. If L is a characteristic macroscopic length scale and l is the diameter of the smallest turbulent eddies, defined as the scale on which viscous effects are dominant, then the ratio of these scales can be shown to be of order L/l≈Re3/4. This relation follows from the assumption that, in steady-state, the smallest eddies must dissipate turbulent energy by converting it into heat.

완전 난류 흐름에서는 다양한 와류 구조의 집합으로 특징 지어지는 변동 속도에 대해 다양한 스케일이 존재합니다. L이 거시적 길이 특성 척도이고, l을 점성 효과가 우세한 척도로 정의되는 가장 작은 난류 소용돌이의 직경인 경우, 이러한 척도의 비율은L/l≈Re3/4 정도인 것으로 표시 될 수 있습니다.  이 관계는 정상 상태에서 가장 작은 소용돌이가 난류 에너지를 열로 변환하여 발산해야한다는 가정에서 비롯됩니다.

Turbulence Models

From the above relation for the range of scales it is easy to see that even for a modest Reynolds number, say Re=104, the range spans three orders of magnitude, L/l=103. In this case, the number of control volumes needed to resolve all the eddies in a three-dimensional computation would be greater than 109. Numbers of this size are well beyond current computational capabilities. For this reason, considerable effort has been devoted to the construction of approximate models for turbulence.

난류 모델

스케일의 범위에 대한 위의 관계를 보면 적당한 레이놀즈 수 (예 : Re = 10 4 )에서도 범위가 세 자릿수인 L/l=103에 걸쳐 있음을 쉽게 알 수 있습니다. 이 경우 3 차원 계산에서 모든 소용돌이를 해결하는데 필요한 제어 볼륨의 수는 109보다 커집니다.이 크기의 수는 현재 계산 능력을 훨씬 뛰어 넘습니다. 이러한 이유로 난류에 대한 대략적인 모델을 구성하는 데 상당한 노력을 기울였습니다.

We cannot describe turbulence modeling in any detail in this short article. Instead, we will simply make some basic observations about the types of models available. Be forewarned, however, that no models exist for general use. Every model must be employed with discretion and its results cautiously treated.

이 짧은 기사에서는 난류 모델링에 대해 구체적으로 설명 할 수 없습니다.  대신 사용 가능한 모델의 유형에 대한 몇 가지 기본적인 설명만 합니다.  그러므로 일반 모델은 존재하지 않는 것을 미리 양해 바랍니다.  어떤 모델도 신중하게 선택하고 결과를 주의 깊게 처리해야 합니다.

The original turbulence modeler was Osborne Reynolds. Anyone interested in this subject should read his groundbreaking work (Phil. Trans. Royal Soc. London, Series A, Vol.186, p.123, 1895). Reynolds’s insights and approach were both fundamental and practical.

난류를 처음으로 모델링 한 인물은 Osborne Reynolds 입니다.  이 건에 관심이있는 분은 Reynolds 의 획기적인 저서 (Phil. Trans. Royal Soc. London, Series A, Vol.186, p.123,1895)를 참조하십시오.  Reynolds 의 통찰력과 접근 방식은 기본이며 동시에 실용적인 것입니다.

The Pseudo-Fluid Approximation

In a fully turbulent flow it is sometimes possible to define an effective turbulent viscosity, μeff, that roughly approximates the turbulent mixing processes contributing to a diffusion of momentum (and other properties). Thinking of a turbulent flow as a pseudo-fluid having increased viscosity leads to the observation that the effective Reynolds number for a turbulent flow is generally less than 100:

의사 유체 근사

완전 난류 흐름에서는 운동량 (및 기타 특성)의 확산에 기여하는 난류 혼합 공정에 대략적으로 근접하는 효과적인 난류 점도 μ eff를 정의 할 수 있습니다. 난류 흐름을 점도가 증가 된 유사 유체로 생각하면 난류 흐름에 대한 유효 레이놀즈 수가 일반적으로 100 미만이라는 관찰이 가능합니다.

This observation is particularly useful because it suggests a simple way to approximate some turbulent flows. In particular, when the details of the turbulence are not important, but the general mixing behavior associated with the turbulence is, it is often possible to use an effective turbulent (eddy) viscosity in place of the molecular viscosity. The effective viscosity can often be expressed as

이 관찰 결과는 몇 가지 난류를 근사하는 간단한 방법을 제시하고 있기 때문에 특히 유용합니다.  특히 난류 대한 자세한 내용은 중요하지 난류와 관련된 일반적인 혼합 거동이 중요한 경우에는 분자 점성 대신 사용 난류 (소용돌이) 점성을 사용할 수있는 경우가 있습니다.  유효 점성은 다음의 식으로 나타낼 수 있습니다.

where α is a number between 0.02 and 0.04. This expression works well for the turbulence associated with plane and cylindrical jets entering a stagnant fluid. The effective Reynolds number associated with this model is Re=1/α, a number between 25 and 50.

α는 0.02에서 0.04 사이의 숫자입니다.  이 수식은 정체 유체에 들어가는 평면 제트 및 원통형 분류 관련 난류에 대하여 효과가 있습니다.  이 모델에 대한 사용 레이놀즈 수는 Re = 1 / α 25에서 50 사이의 숫자입니다.

While this model is often adequate for predicting the gross features of a turbulent flow, it may not be suitable for predicting local details. For example, it would predict a parabolic flow (i.e., laminar) profile in a pipe instead of the measured logarithmic profile.

이 모델은 종종 난류의 전반적인 특징을 예측하는데는 적합하지만, 로컬 세부 사항을 예측하는 데는 적합하지 않을 수 있습니다.  예를 들어, 측정된 대수 프로필 대신 파이프의 포물선 흐름 (층류 등)의 프로파일을 예측합니다.

Local Viscosity Model

The next level of complexity beyond a constant eddy viscosity is to compute an effective viscosity that is a function of local conditions. This is the basis of Prandtl’s mixing-length hypothesis where it is assumed that the viscosity is proportional to the local rate of shear. The proportionality constant has the dimensions of a length squared. The square root of this constant is referred to as the “mixing length.”

This model offers an improvement over a simple constant viscosity. For example, it predicts the logarithmic velocity profile in a pipe. However, it is not used much because it doesn’t account for important transport effects.

국소 점성 모델

일정한 소용돌이 점성보다 복잡한 것은 국소적 조건의 함수인 유효 점성을 계산하는 것입니다.  이것은 점성이 국소적 전단 속도에 비례한다고 가정된다는 프란틀 혼합 길이 가설(Prandtl’s mixing-length hypothesis )의 기초가됩니다.  비례 상수의 차원은 길이의 제곱입니다.  이 상수의 제곱근은 “혼합 장”이라고합니다.

이 모델은 간단한 일정한 점성 개선을 제공합니다.  예를 들어, 파이프의 대수 속도 프로파일을 예측할 수 있습니다.  그러나 중요한 수송 효과를 지원하지 않기 때문에 그다지 많이 사용되지 않습니다.

Turbulence Transport Models

For practical engineering purposes the most successful computational models have two or more transport equations. A minimum of two equations is desirable because it takes two quantities to characterize the length and time scales of turbulent processes. The use of transport equations to describe these variables allows turbulence creation and destruction processes to have localized rates. For instance, a region of strong shear at the corners of a building may generate strong eddies, while little turbulence is generated in the building’s wake region. The strong mixing observed in the wakes of buildings (or automobiles and airplanes) is caused by the advection of upstream generated eddies into the wake. Without transport mechanisms, turbulence would have to instantly adjust to local conditions, implying unrealistically large creation and destruction rates.

난류 수송 모델

실용 공학의 목적인 가장 뛰어난 수치 모델에는 2 개 이상의 수송 방정식이 있습니다.  난류 과정의 길이와 시간의 스케일을 특징으로는 2 개 분량이 필요하므로 최소한 2 개의 방정식이있는 것이 바람직 할 것입니다.  수송 방정식을 사용하여 이러한 변수를 표현하면 난류의 생성 속도와 파괴율을 국소적으로 할 수 있습니다.  예를 들어, 건물의 모서리의 전단력이 강한 영역에서 강력한 소용돌이가 생성 된 건축물의 후류 영역에서 난류는 거의 생성되지 않습니다.  건축물 (또는 자동차 나 비행기)의 후류에서 관찰되는 강력한 혼합은 상류에서 생성된 소용돌이 후류의 이류에 의해 발생합니다.  수송 메커니즘이 없는 경우, 난류는 국소적 조건에 즉시 적응해야하므로 생성 속도와 파괴율이 비현실적인 크기입니다.

Nearly all transport models invoke one or more gradient assumptions in which a correlation between two fluctuating quantities is approximated by an expression proportional to the gradient of one of the terms. This captures the diffusion-like character of turbulent mixing associated with many small eddy structures, but such approximations can lead to errors when there is significant transport by large eddy structures.

거의 모든 수송 모델에서 하나 이상의 경사 가정을 이루어 두 변동하는 양의 상관 관계가 하나의 항 기울기에 비례하는 식으로 근사됩니다.  이를 통해 다수의 작은 소용돌이 구조와 관련된 난류 혼합 확산적인 특징을 파악할 수 있지만, 큰 소용돌이 구조에 의해 상당한 전송이 존재하는 경우, 이러한 근사 오류가 발생할 수 있습니다.

Large Eddy Simulation

Most models of turbulence are designed to approximate a smoothed out or time-averaged effect of turbulence. An exception is the Large Eddy Simulation model (or Subgrid Scale model). The idea behind this model is that computations should be directly capable of modeling all the fluctuating details of a turbulent flow except for those too small to be resolved by the grid. The unresolved eddies are then treated by approximating their effect using a local eddy viscosity. Generally, this eddy viscosity is made proportional to the local grid size and some measure of the local flow velocity, such as the magnitude of the rate of strain.

Large Eddy 시뮬레이션

난류의 대부분의 모델은 매끄럽게 또는 시간 평균된 난류의 효과를 근사하도록 설계되어 있습니다.  예외는 큰 에디 시뮬레이션 모델 (또는 서브 그리드 스케일 모델)입니다.  이 모델의 배경에는 너무 작은 격자에 의해 해결할 수 없는 것을 제외하고는 난류의 모든 변동 내용은 계산에 의해 직접 모델링 할 수 있어야 한다는 생각이 있습니다.  미해결 소용돌이는 로컬 점성을 사용하여 효과를 근사하여 처리됩니다.  일반적으로이 소용돌이 점성은 국소적인 격자 크기 및 어떤 국소적인 흐름의 속도 측정 (변형 속도의 크기 등)에 비례합니다.

대부분의 난류 모델은 난류의 평활화 또는 시간 평균 효과에 근접하도록 설계되었습니다. 예외는 Large Eddy Simulation 모델 (또는 Subgrid Scale 모델)입니다. 이 모델의 이면에있는 아이디어는 계산이 격자에 의해 해결 되기에는 너무 작은 것을 제외하고, 난류 흐름의 모든 변동 세부 사항을 직접 모델링 할 수 있어야 한다는 것입니다. 해결되지 않은 소용돌이는 로컬 소용돌이 점도를 사용하여 효과를 근사화하여 처리됩니다. 일반적으로, 이 와류 점도는 로컬 격자 크기와 변형률의 크기와 같은 로컬 유속 측정치에 비례하여 만들어집니다.

Such an approach might be expected to give good results if the unresolved scales are small enough, for example, in the viscous sub-range. Unfortunately, this is still an uncomfortably small size. When these models are used with a minimum scale size that is above the viscous sub-range, they are then referred to as Coherent Structure Capturing models.

이러한 접근 방식은 미해결 스케일이 충분히 작은 경우, 예를 들어 점성이 작은 영역에 있는 경우에 좋은 결과를 얻을 수 있을 것으로 기대됩니다.  불행히도 아직은 여전히 불편한 작은 크기 입니다.  이러한 모델을 점성 작은 영역보다 높은 최소 스케일 사이즈로 사용하는 경우는 CSC (Coherent Structure Capturing) 모델이라고합니다.

The advantage of these more realistic models is that they provide information not only about the average effects of turbulence but also about the magnitude of fluctuations. But, this advantage is also a disadvantage, because averages must actually be computed over many fluctuations, and some means must be provided to introduce meaningful fluctuations at the start of a computation and at boundaries where flow enters the computational region.

이보다 현실적인 모델의 장점은 난류의 평균 효과에 대한 정보뿐만 아니라 변동의 크기에 대한 정보도 제공 될 것입니다.  그러나 이와같은 장점은 단점도 있습니다.  평균적으로 실제로 다수의 변동에 대해 계산해야 하며, 계산의 시작 및 흐름이 계산 영역에 들어가는 경계에서 상당한 변화를 도입하기위한 수단을 제공 할 필요가 있기 때문입니다.

Turbulence from an Engineering Perspective

We have seen that it is probably not reasonable to attempt to compute all the details of a turbulent flow. Furthermore, from the perspective of most applications, it’s not likely that we would be interested in the local details of individual fluctuations. The question then is how should we deal with turbulence, when should we employ a turbulence model, and how complex should that model be?

공학적 관점에서의 난류

지금까지 난류의 모든 세부 사항을 계산하려고하는 것은 아마도 합리적이지 않다는 것을 확인했습니다.  또한 많은 적용례의 관점에서 개별 변동의 국소적인 세부 사항이 관심의 대상이 될 수는 없을 것입니다.  거기서 생기는 의문은 난류를 어떻게 처리해야 할지 난류 모델을 언제 선택할지 그 모델이 얼마나 복잡할지에 있다는 것입니다.

Experimental observations suggest that many flows become independent of Reynolds number once a certain minimum value is exceeded. If this were not so, wind tunnels, wave tanks, and other experimental tools would not be as useful as they are. One of the principal effects of a Reynolds number change is to relocate flow separation points. In laboratory experiments this fact sometimes requires the use of trip wires or other devices to induce separation at desired locations. A similar treatment may be used in a numerical simulation.

실험적 관찰에 따르면 특정 최소값이 초과되면 많은 흐름이 레이놀즈 수와 무관하게됩니다. 그렇지 않다면 풍동, 파도 탱크 및 기타 실험 도구는 그다지 유용하지 않을 것입니다. 레이놀즈 수 변경의 주요 효과 중 하나는 흐름 분리 지점을 재배치하는 것입니다. 실험실 실험에서이 사실은 때때로 원하는 위치에서 분리를 유도하기 위해 트립 와이어 또는 기타 장치를 사용해야합니다. 유사한 처리가 수치 시뮬레이션에서 사용될 수 있습니다.

Most often a simulation is done to determine the dominant flow patterns that develop in some specified situation. These patterns consist of the mean flow and the largest eddy structures containing the majority of the kinetic energy of the flow. The details of how this energy is removed from the larger eddies and dissipated into heat by the smallest eddies may not be important. In such cases the dissipation mechanisms inherent in numerical methods may alone be sufficient to produce reasonable results. In other cases it is possible to supply additional dissipation with a simple turbulence model such as a constant eddy viscosity or a mixing length assumption.

대부분의 경우 특정 상황에서 발생하는 지배적 인 흐름 패턴을 결정하기 위해 시뮬레이션이 수행됩니다. 이러한 패턴은 평균 흐름과 흐름의 대부분의 운동 에너지를 포함하는 가장 큰 소용돌이 구조로 구성됩니다. 이 에너지가 더 큰 소용돌이에서 제거되고 가장 작은 소용돌이에 의해 열로 소산되는 방법에 대한 세부 사항은 중요하지 않을 수 있습니다. 그러한 경우 수치 적 방법에 내재 된 소산 메커니즘만으로도 합리적인 결과를 얻을 수 있습니다. 다른 경우에는 일정한 소용돌이 점도 또는 혼합 길이 가정과 같은 간단한 난류 모델을 사용하여 추가 소산을 제공 할 수 있습니다.

Turbulence transport equations require more CPU resources and should only be used when there are strong, localized sources of turbulence and when that turbulence is likely to be advected into other important regions of the flow.  When there is reason to seriously question the results of a computation, it is always desirable to seek experimental confirmation.

An excellent introduction to fluid turbulence can be found in the book Elementary Mechanics of Fluids by Hunter Rouse, Dover Publications, Inc., New York (1978).

난류 전송 방정식은 더 많은 CPU 리소스를 필요로하며 강력하고 국부 화 된 난기류 소스가 있고 그 난류가 흐름의 다른 중요한 영역으로 전파 될 가능성이있는 경우에만 사용해야합니다. 계산 결과에 매우 의문이 생길 경우는 실험에 의해 확인하는 것이 좋습니다.

유체 난류에 대한 훌륭한 소개는 Hunter Rouse, Dover Publications, Inc., New York (1978)의 책 Elementary Mechanics of Fluids에서 찾을 수 있습니다.

General CFD

General CFD

A basic requirement for computational fluid dynamics

전산 유체 역학 (CFD)의 기본 요구 사항은 밀도, 압력 및 속도 등의 유체 특성을 각 요소에 대해 고유하게 할당할 수있는 미소 요소에 공간을 이산화하는 것입니다. 

공간을 분할하는 다양한 방법 중 일반적인 방법의 일부는 격자 시스템에 쉽게 설명되어 있으며, 각각의 방법에 대해 장단점도 기술되어 있습니다. 

사각형 격자 요소는 아마도 수치 근사를 위해 생성하고 사용하는 가장 간단한 격자 요소이지만, 일반적인 사용이 제한되어 너무 대체로 간주합니다. 

사각형 격자는 여러 가지 방법으로 사각형 격자를 쉽게 확장하고 복잡한 격자 생성의 가능성을 제공할 수 있다고 설명하면 위의 생각이 틀렸다는 것을 보여줍니다.

A basic requirement for computational fluid dynamics (CFD) is to have a discretization of space into small elements in which fluid properties such as density, pressure and velocity can be uniquely assigned to each element.  There are a variety of ways to subdivide space and some of the more common ones are briefly described in the article Grid Systems, which offers a few pros and cons for each possibility.  Rectangular grid elements are probably the simplest to generate and use for numerical approximation, but are often seen as too restricted for general use.  The article Rectangular Grids shows the fallacy of this by explaining how rectangular grids can be easily extended in several ways to offer more complex gridding possibilities.

CFD를 실제 문제에 적용하려면, 질량, 운동량 및 에너지 보존에 관한 기본적인 유체 방정식의 단순한 수치 모델 이상의 경우를 고려하는 것이 필요합니다.  이러한 문제의 일부는 아래에 있는 General CFD  절에서 논의되고 있습니다. 

자유 유체 표면 또는 액체 계면을 수치적으로 모델링하는 다양한 방법의 개요가 나와 있습니다.  

그 밖에도 난류 현상을 모델링하는 방식이 논의되고 있으며, 마지막으로 이산 질량 (또는 마커) 입자의 사용에 대한 일반적인 논의도 포함되어 있습니다.

직관적으로 이산 입자는 복잡한 유체 흐름의 변화을 추적하는데 이상적이라고 생각되지만, 마지막 부분에서 설명된 바와 같이 이산 입자와 관련된 많은 제한에 대해 유의해야 합니다.

Application of CFD to real problems often requires more than a straightforward numerical model of the basic fluid equations for conservation of mass, momentum and energy.  Several of these issues are discussed in the remaining articles under the heading of General CFD.  A short summary is given of different ways to numerically model free fluid surfaces or fluid interfaces.  Another of the articles discusses approaches for modeling turbulence phenomena, and finally, there is a general discussion of the use of discrete mass (or marker) particles.  Intuitively, discrete particles would seem to be ideal for tracking the evolution of complex fluid flow, however, as this last article explains, there are a number of limitations associated with discrete particles that should be kept in mind.

본 자료는 국내 사용자들의 편의를 위해 원문 번역을 해서 제공하기 때문에 일부 오역이 있을 수 있어서 원문과 함께 수록합니다. 자료를 이용하실 때 참고하시기 바랍니다.

Free Surface Fluid Flow | 자유 표면 유체 흐름

Free Surface Fluid Flow

유체 흐름 문제는 복잡한 기하학적 구조의 자유 표면과 관련되는 경우가 많으며 대부분 매우 일시적입니다. 수력학의 예로는 배수로, 강, 교각 주변, 홍수 범람, 수문, 잠금 장치 및 다수의 기타 구조물의 흐름이 있습니다. 이러한 유형의 흐름을 계산적으로 모델링 하는 능력은 이러한 계산이 정확하고 합리적인 계산 자원으로 수행될 수 있다면 매력적입니다. 유용하게 사용하려면 시뮬레이션은 물리적 모델을 사용하는 것보다 훨씬 빠르고 저렴해야 합니다.

Fluid flow problems often involve free surfaces in complex geometry and in many cases are highly transient. Examples in hydraulics are flows over spillways, in rivers, around bridge pilings, flood overflows, flows in sluices, locks, and a host of other structures. A capability to computationally model these types of flows is attractive if such computations can be done accurately and with reasonable computational resources. To be useful, simulations should be much faster and less expensive than using physical models.

많은 컴퓨터 프로그램은 유체의 역학을 설명하는 편미분 방정식을 풀 수 있습니다. 시뮬레이션에 자유 표면을 포함 할 수있는 프로그램은 많지 않습니다.  그 이유는 Free Surface 경계 문제로 잘 알려진 수학적인 문제입니다.  자유 경계 문제는 다루기 어려운 표면이 이동함에 따라 계산 영역이 변화하는 한편, 그 표면 이동 자체가 계산에 의해 결정된다는 점에 있습니다.  계산 영역의 변화는 그 크기와 모양의 변화뿐만 아니라, 경우에 따라서는 영역의 결합과 분리(즉, 자유 표면의 발생과 소멸)을 포함합니다.

Many computer programs can solve the partial differential equations describing the dynamics of fluids. Not many programs are capable of including free surfaces in their simulations. The difficulty is a classical mathematical one often referred to as the free-boundary problem. A free boundary poses the difficulty that on the one hand the solution region changes when its surface moves, and on the other hand, the motion of the surface is in turn determined by the solution. Changes in the solution region include not only changes in size and shape, but in some cases, may also include the coalescence and break up of regions (i.e., the loss and gain of free surfaces).

이 책에서는 모든 자유 표면을 고려한 유체흐름 현상을 수치 해석용으로 모델링하는 방법에 대해 설명합니다.  이 기술은 VOF (Volume-of-Fluid) 법에 근거한 것으로, 특히 자유 표면 흐름에 적합한 다양한 기능을 제공합니다.  이 책에서는 VOF 법이 자유 표면과 그 발생과 소멸을 해석하는데 가장 자연스럽고 매우 효율적인 방법을 제시합니다.

In this note a computational modeling technique for fluid flows with arbitrary free surfaces is discussed. The technique is based on the Volume-of-Fluid (VOF) technique. This technique has many unique properties that make it especially applicable to flows having free surfaces. The goal of this discussion is to show why the VOF approach offers a natural way to capture free surfaces and their evolution with great efficiency.

VOF 법의 특징을 잘 보여주기 위해 간단하지만 매우 중요한 유동 현상에 관한 문제를 다룹니다.  여기에서는 계단 낙차형상의 낙하류를 예로 들어 있습니다.  개념적으로 간단한 흐름인 동시에 결과의 타당성을 확인하기위한 좋은 실험 데이터도 제공되어 있습니다 (N. Rajaratnam and MR Chamani “Energy Loss at Drops”J. Hydraulic Res. Vol. 33 p.373,1995 참조).

A good recommendation for the VOF method is to demonstrate its capabilities on a simple hydraulic flow problem, one that is far from trivial. The example selected is of flow over a step. This flow has conceptual simplicity and good experimental data available for validation (see N. Rajaratnam and M.R. Chamani, “Energy Loss at Drops,” J. Hydraulic Res. Vol. 33, p.373, 1995).

Prototype Hydraulic Flow with Free Surfaces

그림 1a는 정상 상태에 도달 한 후 흐름의 문제를 보여줍니다.  계단 낙차형상 상부로부터의 월류(액체 또는 스냅 시트)에는 상하 모두의 자유 표면이 있습니다.  월류의 아래쪽에는 월류와 계단 가공면 사이에 웅덩이가 형성되어 있으며, 하류에서는 액체는 평평한 정상 표면에서 오른쪽으로 흐르고 있습니다.  엄밀히 말하면, 웅덩이 영역의 흐름 상태는 정상입니다.  이것은 충돌하는 액체에 의해 풀에 난류 혼합이 발생하고 있기 때문입니다.  그러나 평균적인 구성이 존재하고 그것은 실험에서도 보고됩니다.

Figure 1a shows the flow problem after it has reached a steady-state condition. The overflow (sheet of liquid or nappe) leaving the top of the step has both an upper and lower free surface. At the bottom of the overflow a pool has formed between the overflow and the face of the step, while downstream, liquid is flowing to the right with a flat, steady surface. Strictly speaking, the flow conditions in the pool region are not steady because turbulent mixing is generated in the pool by the impinging fluid. There is, however, an average configuration and that is what is reported in the experiments.

실용적인 목적 유동 흐름은 항상 2 차원입니다.  즉, 그림 1a에서 수직 방향에서는 큰 변화는 없습니다.  현실에서는 웅덩이 위쪽으로 공간을 만들기 위해서는 대기에 여유공간이 필요하고, 그게 없으면 닫힐 것입니다.

For all practical purposes the flow is two-dimensional, that is, it does not have any significant variation in the direction normal to the illustration in Fig. 1a. In actuality, to have an air space above the pool there must be some opening to the atmosphere otherwise it would close up.

계단 낙차형상 상단의 유속은 중요합니다.  즉, 이것은 표면파와 같거나 그 이상의 속도이기 때문에 하류에서의 교란이 영역을 관통하고 상류 흐름 (계단 낙차형상의 왼쪽)에 영향을 줄 수 없습니다.  따라서 이 영역에서의 흐름은 예외적으로 원활하고 정상입니다.

The flow speed at the top of the step is critical, that is, it has a speed equal to or greater than the speed of surface waves, so that no disturbances from downstream can penetrate through this region to affect flow upstream (to the left of the step), which is why the flow is exceptionally smooth and steady in that region.

이 문제는 수치 시뮬레이션과 비교할 수 있는 기하 형상 기능이 많이 있습니다.  예를 들어, 계단 낙차형상의 전후 흐름의 높이, 월류가 바닥에 충돌 할 때의 각도, 월류 아래에 형성되는 웅덩이의 깊이 등입니다.  또한 실용화를 위한 중요한 비교 항목으로는, 계단 낙차형상을 통해 떨어지는 낙하 류에 의해 손실되는 에너지의 양 (운동 에너지와 위치 에너지의 합)가 있습니다.

There are many geometric features in this problem that can be compared with a numerical simulation; such as flow heights before and after the step, the angle of the overflow stream when it strikes the bottom and the depth of the pool formed under the overflow. Additionally, an important comparison for practical applications is the amount of energy (i.e., kinetic plus potential) lost by the flow in passing over the step.

Simulation of Prototype Problem

그림 1a는 시뮬레이션의 결과입니다.  이 예에서는 실험에 사용된 모든 기하 형상 및 물질의 특성이 시뮬레이션에 사용되었습니다.  실험실 테스트에서 사용한 계단 낙차형상의 높이가 62cm에서 액체는 보통의 물 (밀도 = 1.0gm / cc 어떻게 점성 = 0.01dynes / cm)입니다.  계산 영역에 들어가는 물의 깊이는 15.5cm에서 속도가 임계에 가까운 123.0cm/s 였습니다.  물론, 중력은 수직 방향으로 크기는 g = -980cm / s^2입니다.

Figure 1a is from a simulation. For this example all of the geometric and material properties used in the experiments were used in the simulation. The height of the step used in the laboratory test is 62cm and the fluid is ordinary water (density=1.0 gm/cc and dynamic viscosity=0.01dynes/cm). The depth of water entering the computational region was 15.5cm and was given a near critical velocity of 123.0cm/s. Of course, gravity was in the vertical direction with magnitude g=-980cm/s^2.

Figure 1a. Simulation of flow over a step. Figure 1b. Grid used in simulation.

월류 왼쪽에 있는 웅덩이에 난류가 발생 할 것으로 예상 되었기 때문에, 시뮬레이션에서는 난류 모델 (the Renormalization Group, 즉 RNG 모델)을 사용했습니다.  그 후, 난류 모델을 사용하지 않고 한 시뮬레이션에서도 비슷한 결과를 얻을 수 있었지만, 이것은 그다지 놀라운 일이 아닙니다.  흐름의 중요한 요소의 대부분은 매끄러운 (즉 난류가 아닌) 유입, 유출, 월류 때문입니다.

Because some turbulence was expected to develop in the pool to the left of the overflow, a turbulence model (the Renormalization Group or RNG model) was used in the simulation. Subsequent simulations without a turbulence model produced very similar results, which is not too surprising since most of the important elements of the flow are smooth (i.e., non-turbulent) inflow, overflow and outflow streams.

그림 1b 시뮬레이션 영역은 폭 170cm, 높이 100cm에 가로 80 개, 세로 60 개, 총 4800 개의 셀로 구성되는 같은 크기의 사각형 셀의 격자로 세분화되어 있습니다.  이 격자는 유체 역학의 지배 미분 방정식 (나비에 – 스토크스 방정식)의 유한 차분 근사의 기초로 사용됩니다.  격자 셀의 수와 크기는 흐름 속에서 예측되는 최소의 특성을 파악하는 목적으로 선택되었습니다.  결과를보고 어떤 조정이 필요하다고 생각되는 경우는 숫자를 쉽게 늘리거나 줄일 수 있습니다.  사실, 해상도를 바꾸어 시뮬레이션을 반복하여 계산이 그러한 변화에 영향을 많이 들어 있지 않은지 확인하는 것이 좋습니다.

The simulation region shown in Fig. 1b is 170cm wide and 100cm high and has been subdivided into a grid of equal sized rectangular cells consisting of 80 cells in the horizontal direction and 60 cells in the vertical direction, for a total of 4800 cells. This grid is used as the basis for finite-difference approximations of the governing differential equations of fluid dynamics (the Navier-Stokes equations). The number and size of the grid cells was chosen with the goal of capturing the smallest expected features of the flow. The number can be easily increased or decreased if the results seem to warrant some adjustment. In fact, it is often a good idea to repeat a simulation with a change of resolution to make sure that the solution is not too sensitive to such changes.

왼쪽의 경계는 지정된 속도 경계입니다 (유체의 높이도 지정).  오른쪽의 경계는 유출 경계에서 모든 유량이 경계에 수직 제로 기울기이며, 균일 한 유출이 촉진됩니다.  상하 경계는 단단한 벽으로 세 번째 방향의 경계는 대칭면 (점성 저항 제로의 벽)으로 처리되었습니다.  계단 낙차형상의 표면도 자유-미끄럼(free slip) 경계로 처리되었습니다.

The left boundary was a specified velocity boundary (also with a specified fluid height). The right boundary was an outflow boundary where all flow quantities have a zero gradient normal to the boundary to encourage a uniform outflow. The top and bottom boundaries are rigid walls, while in the third direction the boundaries were treated as planes of symmetry (i.e., walls with zero viscous drag). The surface of the step was also treated as a free-slip boundary.

초기 조건은 예측되는 흐름의 배열을 대략적으로 근사하도록 설정할 수 있었지만, 흐름의 구성은 계산하고 싶은 것 중 하나이기 때문에 유체가 어떻게 분포되는지를 모르는 경우에는 간단한 방법이 필요합니다.  이 예제에서는 비정상 흐름 시뮬레이터를 사용했기 때문에 그림 1a의 계단 낙차형상에 유체의 블록만 있고 왼쪽 경계의 같은 수평 속도와 높이가 할당된 간단한 초기 조건을 정의할 수 있습니다.  시뮬레이션은 이후 정상 흐름으로 발전하고 있지만, 이것은 약 8.0 초 후에 발생합니다.  시뮬레이션은 정상 상태에 도달 한 것을 보장하기 위해, 10.0 초의 시간까지 실행되었습니다.  그림 2는 중간 시간을 두 보여줍니다.  도 2b는 0.2 초, 그림 2c는 0.5 초 시점에서 그림 2d는 마지막 10.0 초 시점을 보여줍니다.

Initial conditions could have been set to roughly approximate the expected flow arrangement, but since the flow configuration is one of the things that one would like to compute, especially for situations where one doesn’t know what the distribution of fluid is likely to be, a simpler approach is needed. Because a transient flow simulator was used for this example a simple initial condition could be defined that consisted of just a block of fluid on top of the step, Fig. 1a with the same horizontal velocity and height assigned to the left boundary. The simulation then followed the development of the steady flow, which occurs after about 8.0s. The simulation was run out to a time of 10.0s to assure that steady conditions had been reached. Figure 2 shows two intermediate times; 2.b at 0.2s and 2.c at 0.5s plus the final time in 2.d at 10.0s.

Figures 2a-2d. Simulation times of 0.0, 0.2, 0.5 and 10.0s.

처음에는 단일 결합하고 있는 자유 표면이었던 것이 액체가 바닥에 충돌한 후 2 개의 독립적인 자유 표면 (상하 스냅 표면)으로 변화하는 것에 주목하십시오.  아래 경계의 충격점의 좌우로 흐름이 분리되도 문제는 없습니다.  이에 대해서는 다음 섹션에서 자세히 설명합니다.

It should be noted that what starts as a single, connected free surface changes to two independent free surfaces (upper and lower nappe surfaces) after the fluid strikes the bottom. No difficulties are experienced with this separation of the flow into portions flowing to the left and right of the impact point on the bottom boundary. This will be discussed at further length in the next section.

실험과 시뮬레이션의 비교는 다음 표와 같으며 매우 잘 일치하고 있습니다.

Comparisons between experiment and simulation are given in the following table and are in excellent agreement.

Comparison TableExperimental ResultsSimulation Results
Outflow Height/Step Height0.0940.094
Pool Height/Step Height0.410.41
Angle of Nappe at Bottom57°59°
Energy Loss/Initial Energy0.290.296

이러한 결과를 고려하면이 같은 정밀도를 달성하려면 상당한 계산시간이 필요할 것으로 생각될지도 모릅니다.  그러나 실제로는 Pentium 4, 3.20GHz의 데스크톱 컴퓨터의 총 CPU 시간은 단 88 초였습니다. 계산시간이 너무 짧은 것은 설명이 필요하며, 이것은 다음 섹션의 목적입니다.

In view of these results it might be expected that a considerable amount of computational time would be required to achieve such accuracy. In fact, the total cpu time on a desktop Pentium 4, 3.20GHz computer was only 88s. Such a short computational time requires explanation and that is the purpose of the following sections.

Figures 2a-2d. Simulation times of 0.0, 0.2, 0.5 and 10.0s.

Why the VOF Technique Works Well / VOF 법이 적합한 이유

VOF 법의 구조와 그것이 매우 효율적인 방법인 이유를 이해하기 위해 다양한 계산법 중에서도 특히 VOF 법에 대한 몇 가지 기본 개념을 나타냅니다.

There are a few general concepts about computational methods and the VOF technique in particular that can be used to gain an understanding of how and why VOF works so efficiently.

Basic Theory

모든 수치해석 방법에서 흐름의 문제를 단순하게 산술 계산하도록 유한의 수치 세트로 단순화해야합니다.  연속 유체를 이산화된 수치 세트에 근사하기 위해서 일반적으로 사용되는 것이 유체가 차지하는 공간을 격자로 분할하는 방법입니다.  이 격자는 일반적으로 다수의 작은 직사각형의 블록(요소)로 구성됩니다.  이러한 각 요소에 대해 평균화 처리를 실시함으로써 그 요소의 유체의 압력, 밀도, 속도 및 온도의 대표 값을 얻을 수 있습니다.

All numerical methods must use some simplification to reduce a fluid flow problem to a finite set of numerical values that can then be manipulated using elementary arithmetical operations. A typical procedure for approximating a continuous fluid by a discrete set of numerical values is to subdivide the space occupied by the fluid into a grid consisting of a set of small, often rectangular “bricks.” Within each element an averaging process is applied to obtain representative element values for the fluid’s pressure, density, velocity and temperature.

간단한 수식을 사용해, 어느 시간에 걸친 각 요소 값과 인접한 요소의 상호 작용을 근사할 수 있습니다.  예를 들어, 요소의 밀도는 그 요소와 인접 요소 사이에서 (질량 보존에 의한) 질량 유량이 교환된 경우에만 변경됩니다.  요소 사이에서 질량이 교환되는 물질의 속도는 운동량 보존 법칙에 의해 계산되며 일반적으로 나비에-스토크스 방정식으로 표현됩니다.  나비에-스토크스 방정식은 인접한 요소 사이에 작용하는 압력과 점성 응력을 이용하여 요소에서 변화하는 유체 속도를 근사합니다.

Simple equations can be devised to approximate how each element’s values interact with neighboring elements over time. For instance, the density of an element can only change when there is a net flow of mass exchanged between an element and its neighbors (i.e., conservation of mass). The material velocity that carries mass between elements is computed from the conservation of momentum principal, usually expressed in the form of the Navier-Stokes equations, which uses the pressures and viscous stresses acting between neighboring elements to approximate the changing fluid velocities in the elements.

이러한 요소와 인접 요소 사이의 상호 작용에 따른 아이디어는 편미분 방정식 근방의 양의 변화에 의해 생기는 작은 변화의 효과를 평가하는 것과 본질적으로 동일합니다.  공학계의 교과서에서 파생된 작은 컨트롤 볼륨을 사용하여 그 크기를 무한대까지 작게 한 근사치의 극한으로 편미분 방정식이 유도됩니다.  수치 시뮬레이션에서도 같은 방식을 취하고 있지만, 요소 수가 너무 많으면 추적이 어렵게  되어 컨트롤 볼륨의 크기를 최대한 작게 만들 수 없습니다.  실제 시뮬레이션 현상을 해결하는데 충분하고 계산 시간을 최소한으로 억제 할 수 있는 요소수를 설정하는 것이 목표입니다.

This idea of an element interacting with its neighbors is essentially what is meant by a partial differential equation; that is, evaluating the effects of small changes caused by the variation in quantities nearby. Partial differential equations are typically derived in engineering text books as the limit of approximations made with small control volumes whose sizes are then reduced to infinitesimal values. In a numerical simulation the same thing is done except that the control volume sizes cannot be taken to the limit because that would require too many elements to keep track of. In practice, the goal is to use enough elements to resolve the phenomena of interest, and no more, so that computing times are kept to a minimum.

요소에 사용되는 연산은 기본적으로 더하기, 빼기, 곱하기 및 나누기만 포함된 간단한 것입니다.  예를 들어, 요소의 질량의 변화는 일정한 시간 간격에 걸쳐 요소의 측면에서 유입 및 유출된 질량의 가산 및 감산에서 구할 수 있습니다. 그러나 시뮬레이션에서는 이러한 연산을 수천, 때로는 수백만 요소에 대해 매우 짧은 시간 간격에 대해 반복 계산해야합니다.  따라서 이러한 반복 계산의 고속 처리는 컴퓨터가 적합합니다.

Arithmetical operations associated with an element generally involve only simple addition, subtraction, multiplication and division. For instance, the change of mass in an element involves the addition and subtraction of mass entering and leaving through the faces of the element over a fixed interval of time. A simulation requires that these operations be done for thousands or even millions of elements as well as repeated for many small time intervals. Computers are ideal for performing these types of repetitive operations very rapidly.

자유 표면을 수반하는 유체 운동의 시뮬레이션에서는 형상이 변화하는 계산 영역을 다루어야합니다.  이 복잡성에 대응할 수있는 분석 방법이 아래에서 설명하는 VOF 법입니다.

Simulating fluid motion with free surfaces introduces the complexity of having to deal with solution regions whose shapes are changing. A convenient way to deal with this is to use the Volume of Fluid (VOF) technique described next.

The VOF Concept

VOF 법은 각 격자 셀의 체적 중 액체가 차지하는 비율, 즉 체적 점유율을 기록한다는 생각에 근거합니다.  일반적으로 부피 점유율은  F로 표시됩니다.  F는 부피 점유율이기 때문에 값이 취할 수있는 범위는 0.0 ~ 1.0입니다.

The VOF technique is based on the idea of recording in each grid cell the fractional portion of the cell volume that is occupied by liquid. Typically the fractional volume is represented by the quantity F. Because it is a fractional volume, F must have a value between 0.0 and 1.0.

액체 내부의 영역에서는 F 값은 1.0이 액체의 외부, 즉 (공기 등) 기체 영역에서 F 값은 0입니다.  F 값이 0.0과 1.0 사이에서 변화하는 장소가 자유 표면이 존재하는 위치입니다.  즉 0.0보다 크고 1.0보다 작은 F 값을 가지는 요소는 반드시 표면을 가지고 있습니다.

In interior regions of liquid the value of F would be 1.0, while outside of the liquid, in regions of gas (air for example), the value of F is zero. The location of a free surface is where F changes from 0.0 to 1.0. Thus, any element having an F value lying between 0.0 and 1.0 must contain a surface.

여기서 유의해야 할 것은 VOF 법에서 자유 표면을 직접적으로 정의하는 것이 아니라 벌크 유체의 위치를 정의한다는 점입니다.  이렇게하면 계산상의 어려움을 초래하지 않고 유체 영역을 결합 또는 분할 할 수 있습니다.  자유 표면은 단순히 유체의 체적 점유율이 1.0과 0.0 사이에서 변화하는 장소로 정의됩니다.  이것은 자유 표면을 수반하는 거의 모든 문제에 적용 할 수 VOF 법의 뛰어난 특징이기도합니다.

It is important to emphasize that the VOF technique does not directly define a free surface, but rather defines the location of bulk fluid. It is for this reason that fluid regions can coalesce or break up without causing computational difficulties. Free surfaces are simply a consequence of where the fluid volume fraction passes from 1.0 to 0.0. This is a very desirable feature that makes the VOF technique applicable to just about any kind of free surface problem.

또한 격자의 각 요소에 단일 수치 (F)를 할당하여 유체의 위치를 기록 할 수 있는 점도 VOF 법의 중요한 특징입니다.  이것은 평균값을 기준으로 압력과 속도 등 다른 모든 유체 물성의 기록과 완전히 일치합니다.

Another important feature of the VOF technique is that it records the location of fluid by assigning a single numerical value (F) to each grid element. This is completely consistent with the recording of all other fluid properties in an element such as pressure and velocity components by their average values.

Some Details of the VOF Technique

Figure 3. Surface in 1D column of elements.

정확도를 위해 요소 내에 자유 표면을 배치하는 방법을 갖는 것이 바람직합니다. 인접 요소의 F 값을 고려하면 이를 쉽게 할 수 있습니다.  예를 들어, 열의 일부에 액체가 충전되어있는 1 차원 요소를 상상하십시오 (그림 3).  액체의 표면은 열 중앙 영역의 요소에 있습니다.  이것을 표면 요소라고합니다.  여기에서는 표면 요소를 제외하고 F 값은 0.0 또는 1.0이어야한다고 가정하고 있기 때문에 이를 사용하여 표면의 정확한 위치를 파악할 수 있습니다.  우선, 표면이 표면 또는 바닥을 확인하는 테스트를 실시합니다.  표면요소에 대해 액체가 없을 경우에는 표면으로 간주합니다.  위의 요소에 액체가 들어있는 경우는 물론, 그 표면은 바닥입니다.  윗면에 관해서는 정확한 위치는 표면 요소의 아래쪽에서 위쪽으로 요소의 세로 크기를 F 배 한 거리에있는로 계산합니다.  바닥도 마찬가지로 표면 요소의 상단에서 아래로, 요소의 세로 크기를 F 배 한 거리에 있습니다.  이 방법에 의한 요소의 표면 위치의 특정은 요소 내의 액체의 부피 점유율로 F를 정의한 후에 합니다.

For accuracy purposes it is desirable to have a way to locate a free surface within an element. Considering the F values in neighboring elements can easily do this. For example, imagine a one-dimensional column of elements in which a portion of the column is filled with liquid, Fig. 3. The liquid surface is in an element in the central region of the column, which will be referred to as the surface element. Because we assume the values of F must be either 0.0 or 1.0, except in the surface element, we can use this to locate the exact position of the surface. First a test is made to see if the surface is a top or bottom surface. If the element above the surface element is empty of liquid, the surface must be a top surface. It the element above is full of liquid then, of course, the surface is a bottom surface. For a top surface we compute its exact location as lying above the bottom edge of the surface element by a distance equal to F times the vertical size of the element. A bottom surface is similarly located a distance equal to F times the vertical size of the element below the top edge of the surface element. Locating the surface within an element in this way follows from the definition of F as a fractional volume of liquid in the element.

1 차원 열의 표면 위치 계산은 간단하고 정확하며 계산이 거의 필요없습니다. 그러나 2 차원 및 3 차원의 경우 하나의 표면 셀에 연속적인 표면 방향이 존재할 가능성이 있기 때문에 위치 계산은 조금 복잡해집니다.  그럼에도 불구하고 이를 취급하는 것은 어렵지 않습니다.  그림 4의 이차원의 예는 표면의 위치를 계산할 뿐만 아니라 경사와 곡률도 이해할 수 있는 쉬운 방법을 보여줍니다.

Calculating surface locations in one-dimensional columns is simple, accurate and requires very little arithmetic. In two and three dimensional situations, however, computing a location is a little more complicated because there is a continuous range of surface orientations possible within a surface cell. Nevertheless, dealing with this is not difficult. A two-dimensional example, Fig. 4, will illustrate a simple way to not only compute the location of the surface, but also to get a good idea of its slope and curvature.

Figure 4. Surface in 2D grid of elements.

1 차원의 경우처럼 먼저 인근 요소를 테스트하여 표면의 대략적인 방향을 찾아야합니다.  그림 4는 바깥 쪽의 법선이 상승 방향에 가장 가깝게 됩니다.  이것은 그 방향 밖의 값의 차이가 다른 방향보다 크기 때문입니다.  그럼 거의 수직으로 있는 요소 열에서 표면의 국소적인 높이가 계산됩니다.  그림 4의 2 차원의 경우에는 이러한 높이가 화살표로 표시되어 있습니다.  마지막으로, 표면 요소를 포함하는 컬럼의 높이에 따라 그 요소의 표면의 위치를 확인합니다.  다른 2 개의 높이를 사용하면 국소적인 표면 경사와 표면 곡률을 계산할 수 있습니다.

As in the one-dimensional case, it is first necessary to find the approximate orientation of the surface by testing the neighboring elements. In Fig. 4 the outward normal would be closest to the upward direction because the difference in neighboring values in that direction is larger than in any other direction. Next, local heights of the surface are computed in element columns that lie in the approximate normal direction. For the two-dimensional case in Fig. 4 these heights are indicated by arrows. Finally, the height in the column containing the surface element gives the location of the surface in that element, while the other two heights can be used to compute the local surface slope and surface curvature.

3 차원에서도 동일한 절차를 사용하지만, 표면 요소의 주위에 있는 9개의 열에 대해 열 높이를 요구해야합니다.  필요한 계산은 조금 더 걸리지만, 주된 내용은 열의 간단한 덧셈과 경사와 곡률을 추구하는 열의 높이의 합과 차이가 있습니다.  이 토론을 토대로, 이제 자유 표면을 정의하는 데 필요한 모든 정보를 빠르고 쉽게 평가하기 위해 부분 유체 체적을 사용하는 방법을 알아야합니다.

In three-dimensions the same procedure is used although column heights must be evaluated for nine columns around the surface element. Although a little more computation is needed, it consists primarily of simple summations in the columns and then sums and differences of column heights for evaluating the slope and curvature. Based on this discussion, the reader should now see how the fractional fluid volume can be used to quickly and easily evaluate all the information needed to define free surfaces.

다루어야 할 문제가 앞으로 2 개 남아 있습니다.  하나는 그림 1 및 2와 같은 시뮬레이션은 유체가 존재하는 영역에는 유체 역학만으로 해결합니다.  이것은 VOF 법의 계산 효율이 높은 또 하나의 이유입니다.  계단 형상의 낙하류의 문제로 유체가 차지하는 영역은 계산 격자의 오픈 공간의 절반 이하입니다.  액체를 둘러싼 기체의 흐름을 계산할 필요가 있다면 필요한 계산 시간이 크게 늘어납니다.  그러나 액체만으로 계산을 할 경우 자유 표면 경계 조건을 지정해야합니다.  이 조건은 접선 응력의 소실과 기체의 압력에 동일한 표준 압력을 표면에 추가하는 것입니다.

There are two remaining issues to deal with. One issue is that a simulation like that in Figs. 1 and 2 is only solving for the fluid dynamics in regions where there is fluid. This is another reason for the computational efficiency of the VOF method. The region occupied by fluid in the flow over a step problem is much less than half of the open region in the computational grid. If it were necessary to also solve for the flow of gas surrounding the liquid, then considerably more computational time would be required. In order to perform solutions only in the liquid, however, it is necessary to specify boundary conditions at free surfaces. These conditions are the vanishing of the tangential stress and application of a normal pressure at the surface that equals the pressure of the gas.

두 번째 문제는 자유 표면이 유체와 함께 움직일 때의 움직임과 변형을 유체 점유율 변수 F를 구함으로써 계산해야 한다는 것입니다.  변수 F는 불연속 (주로 0.0 또는 1.0)이기 때문에 계산 격자를 이동할 때 이 불연속성이 유지되도록주의해야합니다.  VOF 법은이 목적으로 특수 이류(advection) 알고리즘이 사용되고 있습니다.

A second issue is that movement and deformation of a free surface must be computed by solving for the fraction of fluid variable, F, as it moves with the fluid. Because the variable F is discontinuous (i.e., primarily 0.0 or 1.0) some care must be taken to maintain this discontinuity as it moves through a computational grid. In the VOF method, special advection algorithms are used for this purpose.

Illustration of Free-Surface Tracking by VOF Technique

그림 6a는 이것의 적합 여부를 보여줍니다.  유체의 체적 점유율은 격자 요소마다 균일하게 분류되고 그 요소의 값을 나타냅니다.  자유 표면은 거의 모든 곳에서 선명하게 정의되어 있습니다.  스냅의 가장 낮은 가장 좁은 부분에만 선명한 유체 분포의 손실을 확인할 수 있습니다 (그림 5b).  이것은 예상대로입니다.  이 영역에서는 스냅의 두께는 3 가지 요소보다 작고, 따라서 부분 충전된 표면 요소에 연결된 작은 F 값이 어떤 중심 요소 (값 1.0)에 혼입하기 때문입니다.  계산 목적으로 이 것은 별로 문제가 되지 않습니다.  이 시뮬레이션 방법은 액체 내부의 요소는 순수한 액체 성분과 같은 방식으로 처리되기 때문입니다.

Figure 6a is an illustration of how well this works; the fluid volume fraction is colored uniformly in each grid element to represent its value in that element. The free surface is sharply defined nearly everywhere. Only in the lowest and narrowest part of the nappe is there any noticeable loss of a sharp fluid fraction distribution, Fig. 5b. This was expected because in this region the nappe is less than three elements in thickness and this allows some of the smaller F values associated with partially filled surface elements to mix in with the central element, which should have a value of 1.0. For computational purposes this doesn’t really matter because the simulation method treats elements interior to the liquid as though they are pure liquid elements.

그림 5b에 나타내는 영역에서는 실제 실험에서 난류 및 공기 혼입이 관찰된 것도 지적해 두지 않으면 안됩니다.  따라서 유체 점유율의 값을 1보다 조금 작게 보이는 것이 다소 현실적입니다.  이것은 전혀 의외라는 것은 없습니다.  난류와 공기 유입을 담당하는 풀의 액체 제트의 교점은 난류와 공기 유입의 원인이 되지만, 유체 점유율 값(fluid fraction values )은 액체 내부에 “유입” 원인이 되기 때문에 실수가 아닙니다.

It should also be pointed out that in the region shown in Fig. 5b turbulence and air entrainment are observed in actual experiments. Thus, the appearance of fluid fraction values a little less than unity is somewhat realistic. This is not entirely accidental because the intersection of jet of liquid with a pool, which is responsible for turbulence and air entrainment, is also responsible for the “entrainment” of fluid fraction values into the interior of the liquid.

Figure 5a (left): Fluid fraction values in elements, showing sharpness of surface definition. Figure 5b (right): Close up of fluid fraction values where the overflow hits bottom.

Summary

처음에는 컴퓨터가 단순히 반복적인 산술 연산을 수행하고, 복잡하고 시간에 의존적인 유체 역학 문제에 대해, 현실적인 시뮬레이션을 할 수 있다는 것이 다소 마술처럼 보일 수 있습니다. 이 논의의 목적은 비교적 기본적인 절차로 이를 수행하는 접근법을 설명하는 것입니다.

간단하지만 사소한 유압 흐름 예제를 사용하여 계산된 시뮬레이션이 물리적인 측정 결과와 매우 일치하는 세부 결과를 생성 할 수 있음이 입증되었습니다. VOF (Volume of Fluid) 기술을 기반으로 한 시뮬레이션은 정확하고, 매우 효율적인 것이 추가로 입증되었습니다.

분명하게, 수력 발전소에서 사용되는 것과 같은 복잡한 유압 구조와 관련된 실제 예는 유용한 결과를 얻기 위해서는 이 예에서 사용되는 몇 초 이상의 많은 계산 시간을 소비해야합니다. 그럼에도 불구하고 이러한 결과는 합리적인 시간 (사람과 컴퓨터 모두)에서 수행 될 수 있으며, 실제 실험에서는 거의 불가능한 세부 사항들을 포함합니다. 또한, 지오메트리, 유동 조건 또는 유체 특성의 거의 모든 종류의 변화의 영향을 쉽게 테스트 할 수있는 능력은 시뮬레이션을 사용하는 또 다른 강력한 이유입니다. 기술의 발전에 따라 hydraulic flow 시뮬레이션을 위한 현재 소프트웨어 및 하드웨어는 기존의 물리적 모델링에 비해 상당한 비용 이점을 제공합니다.

At first it may seem somewhat magical that a computer can simply perform repeated arithmetic operations on arrays of numbers and produce a realistic simulation of a complex, time-dependent, fluid dynamics problem. It was the purpose of this discussion to explain an approach that does this with relatively elementary procedures.

Using a simple, but non-trivial, hydraulic flow example it has been demonstrated that computational simulations can produce detailed results in excellent agreement with physical measurements. It has been further demonstrated that the simulation, which was based on the Volume of Fluid (VOF) technique, uses simple approximation methods that are both accurate and efficient.

Clearly, real world examples involving complex hydraulic structures such as those used in hydroelectric power stations, must consume more than the few seconds of computational time used in our example to obtain useful results. Nevertheless, those results can be generated in reasonable times (both man and computer) and contain a richness of detail rarely possible in physical experiments. For examples visit our water and environmental application pages. In addition, the ability to easily test the influence of just about any kind of change in geometry, flow condition or fluid property is another powerful reason to employ simulations. Current software and hardware for hydraulic flow simulations offer a significant cost advantage over traditional physical modeling.

Postscript

The first detailed description of the VOF method was in 1981 by C.W. Hirt and B.D. Nichols, J. Comp. Phys., 39, p.201. All simulations appearing in this article were performed with the commercial software package FLOW-3D developed by Flow Science, Inc. This program uses an enhanced variant of the VOF concept called TruVOF.

본 자료는 국내 사용자들의 편의를 위해 원문 번역을 해서 제공하기 때문에 일부 오역이 있을 수 있어서 원문과 함께 수록합니다. 자료를 이용하실 때 참고하시기 바랍니다.

Pressure-driven Inkjets

Pressure-driven Inkjets

디지털 잉크젯 인쇄를 생성하는 인기있는 방법은 잉크젯 노즐 장치의 베이스에 프로그램 된 압력을 사용하는 것입니다. 구동 압력 때문에, 잉크 및 기타 변수의 노즐 표면 장력 및 점도의 형상 처럼 거의 무제한의 조합으로, 이들 파라미터들의 다양한 조합 하에서 액적 토출을 시뮬레이션 할 수 있어 매우 유용합니다. FLOW-3D는 잉크젯의 형성을 지배하는 거의 모든 실제 프로세스를 모델링할 수 있기 때문에 목적에 맞게 사용될 수 있다. 아래는 상류 압력 기록이 지정되어 간단한 가압 구동 노즐에서 방울 형성 나타남을 보여줍니다.

This animation shows the formation of ink drops from a pressure-driven inkjet nozzle. Courtesy of Xerox.

Contact Line Insights

Contact Line Insights

FLOW-3D의 수치 모델링 기능은 코팅 성능 향상에 관심이 있는 엔지니어에게 이상적입니다. 계산 시뮬레이션은 코팅 흐름에 영향을 미치는 다양한 물리적 공정의 상대적 중요성과 효과를 연구하는 훌륭한 방법입니다. 물리적 테스트에서 프로세스를 분리하거나 해당 프로세스의 규모를 임의로 조정하는 것이 항상 가능한 것은 아닙니다. 이 섹션에서는 리 블릿 형성(rivulet formation), 핑거링(fingering), 증발, 거친 표면 위의 접촉선 이동 및 유체 흡수와 관련하여 FLOW-3D의 정적 및 동적 접촉각 처리에 대해 설명합니다.

Static and Dynamic Contact Angles

FLOW-3D는 입력으로 설정된 정적 접촉각의 함수로 동적 접촉각과 자유 표면 인터페이스에서 작용하는 관련 힘을 정확하게 계산하여 유체의 소수성을 캡처 할 수 있습니다. 아래 시뮬레이션은 물방울이 경사면 아래로 이동함에 따라 정적 접촉각이 동적 접촉각에 미치는 영향을 보여줍니다.

L.M. Hocking 박사는 그의 저서 [“A moving fluid interface on a rough surface,” J. Fluid Mech., 76, 801, (1976)]에서 표면에 미세한 요철이 흐름 구조를 유도하기 때문에 Contact line이 고체 표면을 통해 이동할 수 있으며 이는 거시적 관점에서 “velocity slip”로 해석 될 수 있다고 했습니다.

이 가설에 대한 전산 해석은 FLOW-3D를 이용하여 쉽게 수행됩니다. 선택된 테스트는 가로, 규칙적으로 이격 된 직사각형 슬롯 패턴 이차원 고체 표면 구성됩니다. 슬롯은 2mm 깊이 10mm 폭, 그리고 그들 사이 폭 10mm 고체 조각을 갖고 이격 됩니다. 이 크기는 전형적으로 상대적으로 부드러운 표면에 긁힌 모양입니다. 액체와 고체 사이의 정적인 접촉각이 60 °가 되도록 선택 하였습니다. 작동 유체는 물로 선정되었고 시험은 채널을 통해 속도30cm / s의 평균 물높이 15mm의 채널의 바닥에 있는 거친 표면을 두고 구동 이루어져 있습니다. 채널의 상단은 free-slip boundary로 정해집니다.

Hocking의 주장대로 micro-scale 교란이 Large scale 관점에서 보았을 때 계산된 속도장으로 보면 velocity slip의 한 종류로서 해석 될 수 있습니다. 아래는 계산된 수평 속도 분포를 나타내고 있습니다. 이것은 표면 바로 위에 제어 볼륨 층의 계산 된 수평 속도 분포를 제공하는 X-Y 플롯에 그래픽으로 보여 주고 있습니다. 격자 미세화에 의해 표면의 고체 부분의 윗쪽 속도가 영이 되는 경향이 있지만, 슬롯들 위에 있는 속도는 영이 안되게 유지됩니다. 많은 요철 위의 이러한 속도의 평균은 효과적인 슬립으로 해석 될 수 있는 non-zero 수평 이송 속도를 일으킵니다.

Evaporative Effects

분산된 고체 물질을 포함하는 액체 방울이 고체 표면에서 건조되면 고체 물질이 침전물로 남습니다. 이 퇴적물의 패턴은 많은 인쇄, 청소 및 코팅 공정에 중요한 의미를 갖습니다. 한 가지 유형의 침전물의 전형적인 예는 왼쪽 이미지와 같이 유출 된 커피 조각의 둘레를 따라 링 얼룩이 형성되는 “커피 링”문제입니다. 이러한 유형의 링 침전물은 액체의 증발로 인한 표면 장력 구동 흐름의 결과로 발생하며, 특히 방울 주변에서 발생합니다 [1].

Drying

건조는 코팅 공정의 중요한 부분입니다. 잘 도포된 코팅은 건조 결함으로 인해 완전히 손상될 수 있습니다. 건조 중에 온도 및 용질 구배는 밀도 및 표면 장력 구배로 인해 코팅 내 흐름을 유도 할 수 있으며, 이로 인해 잠재적으로 코팅 품질이 손상 될 수 있습니다. FLOW-3D의 증발 잔류물 모델을 통해 사용자는 건조로 인한 흐름을 시뮬레이션하고 값 비싼 물리적 실험에 소요되는 시간을 줄일 수 있습니다.

FLOW-3D’s evaporation residue model simulates a 3D view of residue formed from toluene after drying (magnified 30x)

Modeling Ring Formation

FLOW-3D는 증발이 가장 큰 접촉 라인에서의 증착으로 인해 에지 고정이 발생 함을 보여줍니다.

링 형성 모델링
증발에 의해 접촉 라인에서 생성 된 흐름 시뮬레이션
증발은 증발로 인한 열 손실로 인해 액체를 냉각시킵니다 (색상은 온도를 나타냄). 동시에 고체 표면은 전도에 의해 액체를 가열합니다. 증발은 접촉 라인 근처에서 가장 크므로 액체가 접촉 라인을 향해 흐르게하여 정적 상태를 다시 설정합니다. 최종 결과는 액체가 완전히 증발하는 액체 가장자리에 부유 고체가 증착됩니다.

FLOW-3D의 접촉 선 고정 모델에 대해 자세히 알아보십시오.

Simulation of flow generated at a contact line by evaporation

Absorption

Absorption

paper substrate에 대한 물방울의 충격 및 흡수는 전산 유체 역학 소프트웨어로 연구 할 수 있습니다. 여기에서 FLOW-3D는 표면 장력, 접촉각 및 점도와 관련하여 유체 전면의 전파를 살펴보면서 섬유층에 액적 충돌을 시뮬레이션하는 데 사용됩니다.

아래의 FLOW-3D 시뮬레이션에서 물방울 직경이 40 마이크론이며 초기 하향 속도는 300cm / s입니다. 기판은 종이이며 두께는 20 미크론이며 주어진 다공성은 30 %입니다.

Slot Coating

Slot Die Coating

FLOW-3D는 슬롯 다이 코팅의 산업 연구 및 설계에 사용됩니다. 슬롯 다이 코팅에서 유체는 슬롯에서 슬롯에 매우 가까운 곳에 위치한 빠르게 움직이는 기판 위로 강제 배출됩니다. 때로는 여러 슬롯을 사용하여 여러 재료의 레이어드 코팅을 만들기도 합니다. 많은 산업에서 슬롯 다이 코팅 기계는 상대적으로 단순하기 때문에 슬롯 다이코팅이 사용됩니다. 슬롯 다이 코팅의 또 다른 이점은 나노미터 단위로 측정한 코팅 두께에서도 높은 코팅 균일성 비율입니다.

아래 예에서, 한 슬롯은 120미크론 두께의 뉴턴이 아닌 재료를 오른쪽에서 왼쪽으로 움직이는 기질에 적용하고 있습니다.

FLOW-3D에서 유체-솔리드 접촉 선과 접촉각은 흐름의 전체 역학의 일부로 자동으로 계산됩니다. 이것은 슬롯과 웹(Web) 사이의 영역에서 세 개의 개별 접촉 선이 발생하는이 예에서 잘 설명됩니다.

Case Study

Roche Diagnostics GmbH가 2014년 FLOW-3D 유럽 사용자 컨퍼런스에서 발표한 산업 사례 연구의 이 이미지는 진공 보조 장치가 없는 슬롯 다이 코팅의 3D 모델을 보여줍니다. 왼쪽 상단에 그려진 실험과 FLOW-3D로 수행된 시뮬레이션 사이에는 훌륭하게 일치하고 있습니다.

Simulation of a slot die coating without vacuum assist, courtesy Roche Diagnostics GmbH

Slot Die Design

아래에 표시된 3M의 FLOW-3D 시뮬레이션은 슬롯 다이의 내부 캐비티 내부의 유체 체류 시간을 보여줍니다. 슬롯 다이 설계는 코팅 프로세스의 성공에 매우 중요하며 코팅 액의 유변학(rheology)에 따라 다릅니다.

Simulation courtesy of 3M

Two-Layer Slot Coating

왼쪽의 시계열 이미지에서 보면 웹(web)이 이동되고, 슬롯 코팅 다이는 두 개의 슬롯에서 서로 다른 물성의 두 유체가 나오고 있습니다. two-layer slot die를 사용하는 이점은 코팅기의 die station의 수를 감소시킬 수 있는 것입니다. 그러나, 단일 층의 경우에는 존재하지 않는 이층 슬롯 코팅에 존재하는 많은 문제점들이 나타납니다. 두 개의 유체 층 사이의 계면(interface), 보통은 혼합될 수 있는 물성을 가진 Interlayer 는 die surfae에 안정적으로 잘 고정되어야 합니다. 그리고 Interlayer 부근이 순환은 두 유체의 혼합을 막기 위해 최소화 되어야만 합니다. 일반적으로 이것들은 각각의 유체의 밀도, 점도 및 유량이 배출율을 조작함으로써 제어될 수 있습니다.

Start-Up of Slot Coating

슬롯 코터를 이용하여 연속 코팅 공정을 시작하면 시작부터 폐기해야 불완전한 재료의 양을 감소시키기 위해, 가능한 한 빨리 균일한 wettig을 수립하는 것이 바람직합니다. Wet start 기술은 잉크가 웹에 가까워지기 전에 슬롯에서 잘 빠져 나오는 것 보장하는 중요한 기술중의 하나입니다. 이 예에서, web은 액체의 상류 및 하류 모두 압착 슬롯을 향해 이동된다.

슬롯 장치의 경사진 앞쪽면에 유체를 위로 밀어올리는 약간 늦은 적당한 접근 속도는 슬롯장치의 더 나은 성능을 제공합니다.


Roll Coating

Roll Coating

롤 코팅 공정은 직물, 접착제 및 실란트를 다루는 산업을 포함한 다양한 산업에서 일반적으로 많이 사용하는 공정입니다. FLOW-3D는 공정 엔지니어와 과학자에게 다양한 재료 특성과 코팅 방식을 평가하여 결함의 원인을 식별하고 롤 코팅 공정 매개 변수를 최적화 할 수있는 기능을 제공합니다.

1-D Gradient generator with de-coupled convection and diffusion

이러한 예에서 속도 유선은 롤 코팅 공정에서 흔히 볼 수있는 전방 (상단), 후방 (중간) 및 고갈 (하단) 작동 방식에 대해 플롯됩니다. FLOW-3D는 연구자들에게 롤 속도 및 재료 특성과 같은 요소와 동적 접촉 라인의 안정성에 미치는 영향뿐만 아니라 공기 혼입, 리브 및 비 균일 에지 프로파일과 같은 결함에 대한 기여도를 분석 할 수있는 기능을 제공합니다.

인쇄 공정 중 산업에서는 종종 인쇄면에 잉크를 전달하고 적용하는 롤 코팅(roll coating) 이라고 불리는 기술을 사용합니다. 이 공정에서 통상적으로 잉크 유액은 두 개의 회전하는 실린더 사이의 좁은 갭(gap)으로 흘러 들어갑니다.

FLOW-3D를 사용하는 이 1D microfluidic palette 시뮬레이션에서 주 중앙 마이크로 채널에서 대류 Cells의 clean decoupling을 플롯된 유선을 통해 확인할 수 있습니다. 이 흐름은 모두 대류 장치에만 제한되며 단일 장치조차도 마이크로 채널로 누출되지 않아 대류 및 확산의 탁월한 분리를 나타냅니다. 소스 농도의 변화는 플롯에서 볼 수 있으며 애니메이션이 끝날 때까지 시각적으로 일정해집니다.

Ribbing Instabilities

아래에 표시된 전 방향 롤 코팅 시뮬레이션에서 FLOW-3D는 Lee, et al [1]에 설명 된대로 증가 된 롤 속도와 관련된 리브 불안정성의 시작을 정확하게 포착합니다. 이 모델은 단일 유체 VOF, 표면 장력 및 점도를 구현하여 생산에서 볼 수있는 이러한 불안정성의 복잡한 특성을 포착합니다.

Cascade Defects

아래 시뮬레이션에서 FLOW-3D는 포워드 롤 코팅 공정에서 cascade defect을 포착합니다. 상단 웹 롤러의 증가된 롤 속도로 인해, 동적 접촉 라인이 불안정해져 공기가 코팅액에 유입 될 수 있습니다.

Reference

[1] Lee, J. H., Han, S. K., Lee, J. S., Jung, H. W., & Hyun, J. C. (2010). Ribbing instability in rigid and deformable forward roll coating flows. Korea Australia Rheology Journal, 22(1), 75-80.

코팅분야

Coating

FLOW-3D는 산업계 및 학계의 코팅 연구원들이 기계 설계 연구, Display 공정개발 및 최적화를 위해 사용했습니다. 미크론 규모의 코팅 물리학을 이해하는 것은 코팅 유체 유변학의 복잡한 특성과 기판 및 Die와의 상호 작용으로 인해 어려울 수 있습니다.

FLOW-3D 는 비용이 많이 드는 실제 실험에 의존하지 않고, 코팅 프로세스를 분석할 수 있는 편리한 방법을 제공합니다. FLOW-3D는 표면 장력, Wall 접착, 용액 운반, 밀도 기반 흐름 및 상 변화의 영향을 이해하기위한 고밀도 모델링을 제공합니다.

Forward roll coating 공정에 대한 FLOW-3D의 시뮬레이션은 high capillary number수로 인한ribbing 결함을 포착합니다. 이 모델은 backing rollers가 400 micron nip을 통해 유체를 끌어 당길 때 표면 장력과 점도의 효과를 통합합니다. 시뮬레이션은 Lee, et al [1]의 연구를 기반으로합니다.

ribbing 시작에 대한 정확한 예측을 통해 엔지니어는 결함을 방지하기 위한 공정 매개 변수를 식별하고 수정할 수 있습니다.

Reference

[1] Lee, J. H., Han, S. K., Lee, J. S., Jung, H. W., & Hyun, J. C. (2010). Ribbing instability in rigid and deformable forward roll coating flows. Korea Australia Rheology Journal, 22(1), 75-80.

Bibliography

Models

  • Air Entrainment
  • Porous Media
  • Surface Tension
  • More Modeling Capabilities

Conference Proceedings


관련 기술자료

Schematic view of the experimental set-up

Short-time numerical simulation of ultrasonically assisted electrochemical removal of strontium from water

September 2023 DOI:10.30955/gnc2023.00436 Conference: 18th International Conference on Environmental Science and Technology CEST2023, 30 August to 2 September 2023, Athens, ...
stencil

Experimental and numerical investigation of the squeegee process during stencil printing of thick adhesive sealings

두꺼운 접착제 실링의 스텐실 인쇄 중 스퀴지 프로세스에 대한 실험적 및 수치적 조사 Fabiano I. Indicatti, Bo Cheng, Michael Rädler, ...
The Fastest Laptops for 2024

FLOW-3D 수치해석용 노트북 선택 가이드

2024년 가장 빠른 노트북 PCMag이 테스트하는 방법 소개 : 기사 원본 출처: https://www.pcmag.com/picks/the-fastest-laptops CFD를 수행하기 위한 노트북 선정 기준은 별도로 ...
Overflow water film

Numerical Simulation Study on Characteristics of Airtight Water Film with Flow Deflectors

유동 편향기가 있는 밀폐수막의 특성에 관한 수치해석 연구 Zhang Weikang, Gong Hongwei Abstract In practical use, there is shrinkage in ...
Coating_image

Template-Free Scalable Fabrication of Linearly Periodic Microstructures by Controlling Ribbing Defects Phenomenon in Forward Roll Coating for Multifunctional Applications

다기능 응용을 위한 Forward Roll Coating 공정의 리브 경함 형상 제어를 통한 선형 주기적 미세구조물의 템플릿 프리 제작 Md Didarul ...
Ultrafast laser ablation of tungsten carbide: Quantification of threshold range and interpretation of feature transition

Ultrafast laser ablation of tungsten carbide: Quantification of threshold range and interpretation of feature transition

텅스텐 카바이드의 초고속 레이저 제거: 임계값 범위의 정량화 및 특징 전환 해석 Xiong Zhang, Chunjin Wang, Benny C. F. Cheung, Gaoyang Mi, Chunming WangFirst ...
Coupled CFD-DEM simulation of interfacial fluid–particle interaction during binder jet 3D printing

Coupled CFD-DEM simulation of interfacial fluid–particle interaction during binder jet 3D printing

바인더 제트 3D 프린팅 중 계면 유체-입자 상호 작용에 대한 CFD-DEM 결합 시뮬레이션 Joshua J. Wagner, C. Fred Higgs III https://doi.org/10.1016/j.cma.2024.116747 Abstract The coupled ...
Fig. 8. Pressure distribution during the infiltration of preform with the 50 ¯m particles and 20 % starches: (a) 25 % filled, (b) 57 % filled, and (c) 99 % filled.

Experimental study and numerical simulation of infiltration of AlSi12 alloys into Si porous preforms with micro-computed tomography inspection characteristics

마이크로 컴퓨터 단층 촬영 검사 특성을 가진 Si 다공성 프리폼에 AlSi12 합금의 침투에 대한 실험적 연구 및 수치 시뮬레이션 Ruizhe ...
Liquid-solid co-printing of multi-material 3D fluidic devices via material jetting

재료 분사를 통한 다중 재료 3D 유체 장치의 액체-고체 공동 인쇄

Liquid-solid co-printing of multi-material 3D fluidic devices via material jetting BrandonHayes,Travis Hainsworth, Robert MacCurdyUniversity of Colorado Boulder, Department of Mechanical ...
Fig. 2: Scheme of the LED photo-crosslinking and 3D-printing section of the microfluidic/3D-printing device. The droplet train is transferred from the chip microchannel into a microtubing in a straight section with nearly identical inner channel and inner microtubing diameter. Further downstream, the microtubing passes an LED-section for fast photo cross-linking to generate the microgels. This section is contained in an aluminum encasing to avoid premature crosslinking of polymer precursor in upstream channel sections by stray light. Subsequently, the microtubing is integrated into a 3D-printhead, where the microgels are jammed into a filament that is directly 3D-printed into the scaffold.

On-Chip Fabrication and In-Flow 3D-Printing of Cell-Laden Microgel Constructs: From Chip to Scaffold Materials in One Integral Process

세포가 함유된 마이크로겔의 온칩 제작 및 인-플로우 3D 프린팅구성:하나의 통합 프로세스에서 칩에서 스캐폴드 재료까지 Vollmer, Gültekin Tamgüney, Aldo BoccaciniSubmitted date: ...