Coastal applications using FLOW-3D/연안(해변) FLOW-3D해석사례

배수(Backwaters)이론

  • Air entrainment(공기 혼입 모델)
  • Turbulence(난류 모델)
  • Waves(파동 모델)
  • Sediment scour and deposition(세굴 모델)

하구 매커니즘(Estuarine mechanisms)

  • Air entrainment(공기 혼입 모델)
  • Turbulence(난류 모델)
  • Density Evaluation(밀도 유동 모델)
  • Wind

Wave generation

  • Solitary Wave
  • Linear Wave
  • JONSWAP
  • Pierson-Moskowitz
  • Stokes Wave

Wave 생성하는 모델은 크게 위의 5가지 모델이 있습니다. 아래는 위의 5가지 모델에 대한 해석 사례를 보여줍니다. 이를 참고하시면 해석에 도움이 됩니다.

부두에서 파도 부하 추정, 물리적 모델링 및 수치테스트, 새로운 Wave에 대한 고유 2차원 비선형 접근방식 등의 FLOW-3D결과는 실제 실험 데이터와 잘 일치함을 보여줍니다.

  • Eillott, T., and Fullarton, M., “Cyclone wave loads on wharf structure using the new wave approach”, FLOW-3D Americas User conference, 2014

세굴 모델(Sediment scour and deposition)

  • Critical Shields number definition(임계 Shields 수) : 0.05
  • Bed Load Transport Rate equation : Meyer-Peter & Muller equation
  • Richardson-Zaki coefficient multipller : 1
  • 다음과 같이 Wave와 세굴(Sediment)를 같이 고려해서 해석하는 것을 추천합니다.
    – 퇴적물 탱크의 파동(Solitary wave)
    – 무연탄 및 모래
    – 움직이는 물체 모델을 사용하여 생성된 파도

해석 결과

Wave Forces on Coastal Bridges

Wave Forces on Coastal Bridges

This article was contributed by Jun Jin, Assistant Professor in the Maritime Systems Engineering Department at Texas A&M University at Galveston.


최근 몇 년 동안 허리케인은 멕시코만 연안의 4개 주에서 여러 해안 고속도로 교량에 구조적 피해를 입혔습니다. 허리케인 피해를 방지하기 위해 연안 교량에 가해지는 파도 하중의 크기는 합리적인 정확성을 가지고 결정되어야 합니다. 일반적으로 구조에 대한 파도 하중의 계산은 구조 상호작용의 여러 특성으로 인해 복잡해집니다. 이 본문은 이러한 복잡한 문제들 중 해결할 수 있는 몇 가지를 보여줍니다.

Validation of Stokes Nonlinear Wave Solution in FLOW-3D

FLOW-3D는 해안 교량의 파도 하중을 계산하고 구조물 고도 및 녹색갑판 위의 물 하중에 대한 영향을 조사하기 위해 사용되었습니다.  FLOW-3D에서 StokesWave의 정확도를 평가하기 위해 계산 도메인의 세개 지점을 선택했습니다(그림 1). 시뮬레이션을 하는 동안, 각 입자 소스는 초당 10개의 입자를 방출했습니다. 입자 궤적은 그림 1에 표시되어 있습니다. 한 지점의 입자 속도를 이론적 결과와 비교했습니다(그림 2a 및 2b). FLOW-3D에 의해 계산된 입자의 역학은 Stokes비선형 파동이론과 잘 일치한다고 결론내렸습니다.

Figure 1. Particle trajectories and pressure variation during a wave simulation

Figure 2a. Comparison of computed particle velocities of a point with theoretical results

Figure 2b. Comparison of computed particle velocities of a point with theoretical results


Wave Loads vs. Superstructure Elevations

다리 갑판을 다른 높이로 설정하고 2m파형 높이와 6초 주기의 파형으로 시뮬레이션을 수행했습니다. 그림 3은 파형력이 최대치에 있을 때의 파동 단면과 압력 등고선을 보여 줍니다.

Figure 3. Wave profile and pressure contours at different moments (Pressure unit: Pa).

Flow Field under Bridge Deck

시뮬레이션은 다른 파도 높이로 실행되었습니다. 그림 4에서 볼 수 있듯이 교량 바닥판 밑의 유동장은 복잡합니다. 대들보와 상부 구조물에 의해 형성된 개방된 공간내에서, 물의 흐름은 경계를 따라 원형패턴으로 있었습니다. 또한 유동의 복잡성은 웨이브 높이가 증가함에 따라 증가하는 것으로 관찰되었다.

Observations

시뮬레이션 결과에서 다음과 같은 결론을 도출할 수 있습니다.

  1. 상부 구조물의 높이가 증가함에 따라 교량 상부 구조물의 수직 방향 파동력이 감소하는 반면, 수평 방향 파형력은 교량의 상부 구조물의 상부 표면이 웨이브 높이의 아래에 있을 때 큰 영향을 미치지 않습니다.
  2. 교량 상층부의 물 하중은 파고와 함께 증가합니다. 파손이 거의 발생하는 경우 최대 물 하중이 최대 수직 파력의 50 %를 초과했습니다. 그러나 그린 워터 하중과 상향 파력 사이의 위상차로 인해 수직 파력의 최대 값은 물의 부하에 의해 현저히 감소하지는 않았습니다.
  3. 교량 상부 구조물 주위의 유동장은 평행한 대들보에 의해 차단됩니다. 그러므로 웨이브 힘에 대한 순전히 기반한 방법은 웨이브 힘을 계산하는데 사용할 수 없습니다.

Figure 4. Vectors of water particle velocity at the moment of maximum wave force (Velocity unit: m/s)

Learn more about the power and versatility of modeling coastal and maritime applications with FLOW-3D>


Landslide-Induced Wave Hazard

Landslide-Induced Wave Hazard 

Figure 1. The outskirts of Chungtangh village

인도 Sikkim에 위치한 The Teesta III Hydropower Project는 가파르고 좁은 히말라야 계곡에 위치한 60m의 Concrete Face Rockfill Dam (CFRD)이 포함되어 있습니다. 이 계곡은 지진 활동이 활발하며 가파른 경사면은 산사태를 발생시킬 수 있습니다. 댐 상류 저수지의 산사태로 CFRD를 범람할 수 있다는 우려가 있었습니다. 몇 초 이상 과도하게 지속되면 오버플로우로 인해 CFRD가 잘못될 수 있습니다. 비록 댐이 무너지지 않았지만, 여전히 Chungtangh에 있는 상류쪽 작은 마을은 홍수가 날 것이라는 우려가 있었습니다.

Teesta강 계곡의 가장 가파른 경사면은 댐의 바로 상류에 위치해 있는데, 댐의 산사태가 가장 일어날 가능성이 높은 지역입니다. 이 분석의 목적은 저수지에 대한 산사태를 시뮬레이션하고 그 결과로 발생하는 파도가 댐에 넘치는지 여부를 결정하는 것이었습니다.

Moving Objects Model Used to Simulate Landslide                                      

Tecsult는 저수지의 침전물과 퇴적물을 모델링하는데 성공적이었기 때문에 FLOW-3D를 선택하여 이를 시뮬레이션하였습니다. 저수지의 시뮬레이션은 시작점으로 사용되었습니다. FLOW-3D의 Moving Objects모델은 산사태를 시뮬레이션하는데 사용되었으며 VOF모델은 웨이브 생성을 시뮬레이션하는 데 사용되었습니다.

저수지의 산사태를 추정하기 위해서는 여러가지 방법이 고려되었습니다. 경험적 방법은 흔히 산사태가 발생한 파도를 평가하는데 사용되지만, 이러한 방법은 여러가지 면에서 부족합니다. 이러한 방법은 근접 필드 또는 스플래시 영역에 대한 정보를 제공하지 않습니다. 댐은 슬라이드 면과 매우 가깝기 때문에 스플래시 영역을 아는 것이 중요했습니다. CFRD는 몇 초 이상 overflow를 견딜 수 없었습니다. FLOW-3D는 미끄러운 지형 질량과 물 사이의 완전 결합된 상호 작용을 계산하여 시나리오를 3 차원에서 시뮬레이션하는 방법을 제공합니다.

이 문제를 시뮬레이션하기 위해 간단하고 작은 크기의 자유 낙하 블록으로 구성된 실험과 비교하였습니다. 이 경우는 아래 동영상에 나와 있습니다. 그 결과로 생긴 파도 높이는 그 실험과 잘 맞았습니다.

이 모델의 STL파일은 FLOW-3D로 직접 가져옵니다. 예상 산사태 지역의 크기는 지질 정보와 주변 산사태 관측치를 바탕으로 결정되었습니다. 30,000m³, 100m높이의 산사태가 310만 셀의 메쉬로 시뮬레이션 되었습니다. 높이가 1m인 측면 3m의 균일한 셀을 사용했습니다. 최대 슬라이딩 속도는 진입 지점에서 23m/s에 도달했습니다. 파도는 높이 8m, 속도 10m/s로 댐에 도달하여 몇 초 동안 범람했습니다. 그 결과로 상류 마을에서는 홍수가 나타나지 않았습니다.

Figure 3. Prediction of wave height in the splash zone and near field in a small reservoir, with refraction.

Figure 4. Wave heights plotted against each other

Figure 5. Downstream view of TEEST III dam and water intake CATIA model

Conclusions

이 작업의 주된 관심사는 댐의 범람으로 인해 댐과 Chungtangh 마을이 파괴될 수 있었다는 것입니다. 그러나 시뮬레이션에 따르면 댐은 잠시 동안만 범람했고 파도는 마을에 닿지 않았습니다. Chungtangh마을은 강 위에 충분히 높기 때문에, 그것을 범람시키기 위해서는 상당한 파도의 높이가 필요할 것입니다.


Aerial Landslide Generated Wave Simulations

Aerial Landslide Generated Wave Simulations

Aerial Landslide Generated Wave(ALGW)는 수역에 영향을 미치는 빠른 슬라이드의 결과이다. 이것은 암석에 의해 생성된 작은 파도 이거나, 3000만 입방 미터의 암석으로 인한 500m를 초과하는 파도 일 수도 있다.
공학적 관점에서 보면 ALGW는 근접한 해안을 따라 인간이 거주하는 인구/자산이 있는 수역에서 발생할 때 큰 관심을 가진다. 여기서 파동이 발생하면 해안선이 파손되고 홍수가 날수 있으며, 댐붕괴로 인한 사망까지 일으킬 수 있다(Müller-Salzburg, 1987). 결과적으로, ALGW에 의해 야기되는 최대 파도 상승을 예측하는 것은 경제적, 환경적, 안전상의 이유로 매우 중요합니다.
안타깝게도 분석적인 솔루션이 없는 매우 복잡한 문제로, 유체 역학적인 측면에서뿐만 아니라 지질학적인 관점(즉, 크기/기하학적인 슬라이드의 밀도 프로파일)에서도 마찬가지입니다. 이와 같이, 대부분의 현장 별 ALGW 최대 파형 예측은 확장된 물리적 모델을 사용하여 평가되었다. 일부는 전산유체역학(CFD) 소프트웨어를 기반으로 할 수도 있지만 비용이 많이 들며, 특히 풀 스케일 3차원 문제의 경우 정확성에 대한 논쟁의 대상이 되고 있습니다.
그러나 컴퓨터 하드웨어와 CFD소프트웨어가 계속 발전함에 따라 이제 CFD를 사용하여 ALGW를 실제로 시뮬레이션할 수 있게 되었습니다. 이와 같이 본 연구는 고 충실도의 물리적 모델 데이터를 FLOW-3D와 비교하여 ALGW를 CFD시뮬레이션을 검증하기 위한 지속적인 노력으로 진척시키는 것을 목표로 한다.
다음 절에서는 실제 및 수치 모델 설정에 대한 개요를 제공한다. 뿐만 아니라, 생성된 데이터와 간단한 비교를 제공한다.

Experimental Setup
물리적 실험은 Northwest Hydraulic Consultants 노스 밴쿠버, 캐나다 실험실에서 만들어졌고 실험을 거쳤다. 그것은 30° 경사의 서쪽 벽을 가진 0.5미터 폭의 수로, 45°의 경사진 동쪽 벽, 그리고 두개의 북쪽과 남쪽 측면에 수직 벽, 그리고 1.025m의 수평 단면을 가진 0.610m 너비의 수로로 구성되었다. ALGW를 생성하고 평가하기 위해, 45° 경사 노즈를 가진 0.177×0.305×0.305m의 아크릴 박스를 사용한 6초 시험을 사용했다.
이 슬라이드를 놓았을 때, 슬라이드는 (중력에 의해) 0.607m 심층수에 충돌하기 전에 서쪽 경사면에서 0.768m 아래로 이동했다. 그 후, 물을 통해 또 다른 1.05m를 이동하여 정지 블록을 치기 시작했다. 슬라이드 가속 및 변위뿐만 아니라 파고 높이는 6 초 실험 전체에 대해 100Hz의 주파수에서 기록되었다. 이 데이터를 수집하는 데 사용 된 도구는 다음과 같다.

  • 컴퓨터화된 데이터 수집 시스템
  • 슬라이드의 시간에 따라 이동 한 거리를 측정하는 문자열 가변 저항기
  • 슬라이드 가속도를 측정하는 1 차원 가속도계
  • 물의 주요 본체 내에 배치 된 3 개의 1 차원 커패시턴스 웨이브 – 프로브
  • 웨이브 런업을 캡처하기 위해 동쪽 경사면을 따라 사용되는 저항 사다리꼴 웨이브 프로브
  • 타이밍 스위치 캡처 슬라이드 릴리스 시간 사용
  • 흑백 비디오 카메라

테스트가 반복 가능하고 오작동이 발생하지 않았는지 확인하기 위해 테스트를 5 번 반복하고 각 장비에 대해 평균을 구했다.

Numerical Model Setup
물리적 실험의 전산화 된 3 차원 모델을 제작한 STL 파일을 FLOW-3D로 가져왔다. 일단 FLOW-3D에 들어간 3D 모델은 약 1,370 만개의 0.0075m 크기의 정사각형 셀로 이산화되었고, 벽을 둘러싸고있는 6 개의면 각각에 ‘wall’경계가 사용되었다.
슬라이드를 일반적인 이동 물체로 설정하고, 물리 모델로부터 수집 된 데이터(즉, 가속 및 변위 데이터의 후 처리)에 기초하여 속도가 주어졌다. 동서면 경사면의 표면 거칠기는 0.00025m으로 설정되었다. 모델링 된 유체는 293k의 물이었고, 동적 RNG 난류 모델이 기본 설정과 함께 사용되었다(implicit pressure solve; and, explicit viscous stress, free surface pressure, advection, moving object/fluid coupling solvers).
물리적 모델과 마찬가지로 FLOW-3D는 6 초의 시간을 시뮬레이트하지만 실제 모델과 같이 매 0.01 초가 아닌 0.02 초마다 데이터를 저장하였다(데이터 관리 관점에서 선택하였음).

Result

FLOW-3D 실험의 결과는 그림에 나와 있다. 4개의 웨이브 각각에 대해 실험 시간 동안 파고를 보여준다. 이와 같이, 제시된 파도 높이는 단순히 flume을 통해 전파되는 파도의 구현(즉, 2 차원의 경우에서 볼 수있는 것)이 아니라 오히려 여러 파도의 상호 작용으로 인한 파도 높이를 초래한다.

  • 슬라이드 충격시 발생하는 충격파(1차 신호)
  • 슬라이드 뒤의 충격파 충돌(2차 신호)
  • 북쪽, 동쪽, 서쪽 및 남쪽 벽에서의 웨이브 반사(3차 신호)

또한 길이 방향의 FLOW-3D 데이터(중심선에서)를 실제 모델 비디오 위에 겹쳐서 자유 표면의 FLOW-3D 글로벌 예측을 평가했다. 이것은 아래의 동영상에서 볼 수 있다.
그림과 위의 비디오를 보면 FLOW-3D 데이터가 웨이브 프로브 1, 2 및 3의 경우 물리적 데이터를 매우 잘 일치한다는 것을 알 수 있다. 하지만 웨이브 프로브 4에 대해서는 정확도가 떨어진다.
FLOW-3D 시간 데이터와 관련된 오류는 각 웨이브 프로브에 대한 RMSE (root-mean-square-error)를 취하여 평가된다.

Discussion
이 조사에서 실제 모델의 고 충실도 데이터는 ALGW로 최대 파도 상승에 대한 FLOW-3D 예측과 비교되었다. RNG 모형의 기본 설정을 사용하여 FLOW-3D는 주요 수역 내에서 파고를 정확하게 재현 할 수 있었다. 그러나 최대 파동은 약 43%가 넘었다.
최대 웨이브 런업을 줄이기 위해 몇 가지 대안인 FLOW-3D 물리 설정이 사용되었다. 그러나 43 % 이하로 떨어지는 것은 불가능했다. 이러한 대체 시뮬레이션에 대한 주목할만한 관찰은 다음과 같다.

  • first-order momentum advection scheme의 0.01m 메쉬는 최대 파동 상승 오차가 96% 인 반면 동일하게 0.0075m 메쉬의 오차는 130%였다. 그러나 second-order로 변경하면 0.01 m 및 0.0075 m 메시의 경우 각각 55% 및 43%의 오차가 발생한다. 또한 메쉬 셀 크기를 0.005m으로 줄이면 80%의 오차가 발생한다.
  • 이 테스트 케이스에서 가장 중요한 매개 변수는 momentum advection scheme이다. 평균적으로 second-order를 사용하면 first-order대비 오차가 약 50% 감소한다.
  • FLOW-3D의 MP 버전을 사용하여 0.005m의 메쉬 셀 크기를 사용해야 한다. 해석 시 CPU 시간은 33 시간이었다. 비교를 위해 FLOW-3D의 SMP 버전은 0.0075m의 메쉬 셀 크기로 시뮬레이션을 실행하는 데 26시간이 필요했지만 MP 버전은 4.5시간 밖에 걸리지 않았다.

[1] 3.5GHz 8 코어 AMD FX-8320 프로세서에서 약 6초의 시뮬레이션 시간이 대략 26시간 소요되었다.

References
Fritz, H. M., Hager, W. H., & Minor, H.-E. (2004). Near Field Characteristics of Landslide Generated Impulse Waves. Journal of Waterway, Port, Coastal & Ocean Engineering, 130(6), 287–302. doi:10.1061/(ASCE)0733-950X(2004)130:6(287)
Miller, D. J. (1960). Giant Waves in Lituya Bay Alaska (Geological Survey Professional Paper No. 354-C). Washington, D.C.: United States Government Printing Office.
Müller-Salzburg, L. (1987). The Vajont catastrophe— A personal review. Engineering Geology, 24(1–4), 423–444. doi:10.1016/0013-7952(87)90078-0

Wave Forces on Coastal Bridges

Wave Forces on Coastal Bridges

This article was contributed by Jun Jin, Assistant Professor in the Maritime Systems Engineering Department at Texas A&M University at Galveston.


최근 몇 년 동안 허리케인은 멕시코만 연안의 4 개 주에서 여러 해안 고속도로 교량에 구조적 피해를 입혔습니다. 허리케인 피해를 방지하기 위해 연안 교량에 가해지는 파도 하중의 크기는 합리적인 정확성을 가지고 결정되어야 합니다. 일반적으로 구조에 대한 파도 하중의 계산은 구조 상호작용의 여러 특성으로 인해 복잡해집니다. 이 본문은 이러한 복잡한 문제들 중 해결할 수 있는 몇 가지를 보여줍니다.

Validation of Stokes Nonlinear Wave Solution in FLOW-3D

FLOW-3D는 해안 교량의 파도 하중을 계산하고 구조물 고도 및 녹색갑판 위의 물 하중에 대한 영향을 조사하기 위해 사용되었습니다.  FLOW-3D에서 StokesWave의 정확도를 평가하기 위해 계산 도메인의 세개 지점을 선택했습니다(그림 1). 시뮬레이션을 하는 동안, 각 입자 소스는 초당 10개의 입자를 방출했습니다. 입자 궤적은 그림 1에 표시되어 있습니다. 한 지점의 입자 속도를 이론적 결과와 비교했습니다(그림 2a 및 2b). FLOW-3D에 의해 계산된 입자의 역학은 Stokes비선형 파동이론과 잘 일치한다고 결론내렸습니다.

Figure 1. Particle trajectories and pressure variation during a wave simulation

Figure 2a. Comparison of computed particle velocities of a point with theoretical results

Figure 2b. Comparison of computed particle velocities of a point with theoretical results


Wave Loads vs. Superstructure Elevations

다리 갑판을 다른 높이로 설정하고 2m파형 높이와 6초 주기의 파형으로 시뮬레이션을 수행했습니다. 그림 3은 파형력이 최대치에 있을 때의 파동 단면과 압력 등고선을 보여 줍니다.

Figure 3. Wave profile and pressure contours at different moments (Pressure unit: Pa).

Flow Field under Bridge Deck

시뮬레이션은 다른 파도 높이로 실행되었습니다. 그림 4에서 볼 수 있듯이 교량 바닥판 밑의 유동장은 복잡합니다. 대들보와 상부 구조물에 의해 형성된 개방된 공간내에서, 물의 흐름은 경계를 따라 원형패턴으로 있었습니다. 또한 유동의 복잡성은 웨이브 높이가 증가함에 따라 증가하는 것으로 관찰되었다.

Observations

시뮬레이션 결과에서 다음과 같은 결론을 도출할 수 있습니다.

  1. 상부 구조물의 높이가 증가함에 따라 교량 상부 구조물의 수직 방향 파동력이 감소하는 반면, 수평 방향 파형력은 교량의 상부 구조물의 상부 표면이 웨이브 높이의 아래에 있을 때 큰 영향을 미치지 않습니다.
  2. 교량 상층부의 물 하중은 파고와 함께 증가합니다. 파손이 거의 발생하는 경우 최대 물 하중이 최대 수직 파력의 50 %를 초과했습니다. 그러나 그린 워터 하중과 상향 파력 사이의 위상차로 인해 수직 파력의 최대 값은 물의 부하에 의해 현저히 감소하지는 않았습니다.
  3. 교량 상부 구조물 주위의 유동장은 평행한 대들보에 의해 차단됩니다. 그러므로 웨이브 힘에 대한 순전히 기반한 방법은 웨이브 힘을 계산하는데 사용할 수 없습니다.

Figure 4. Vectors of water particle velocity at the moment of maximum wave force (Velocity unit: m/s)

Learn more about the power and versatility of modeling coastal and maritime applications with FLOW-3D>


CFD Predicts Air Gap and Wave Impact Loads of Offshore Structures

CFD Predicts Air Gap and Wave Impact Loads of Offshore Structures


This article was contributed by Anup Paul & Chris Matice of Stress Engineering Services1.


연안 플랫폼 갑판 아래의 간격은 중요한 설계 매개변수이며 극한 설계 조건에서 요구되는 최소 공극 격차에 의해 결정된다. 반잠수재 및 다리구조물과 같은 구조의 경우 최소 공극과 갑판에 대한 충격영향을 예측하는 것은 어렵다.

Dynamic response of a spar with a 12 m wave

파도는 공극 설계에서 설명되어야 하는 플랫폼 다리와 상호작용으로 인해 상당한 비선형적 행동과 파장의 증폭을 보여준다. 극한의 환경에서 음의 공기 격차가 발생하는 경우 갑판 충격하중에 대한 예측이 중요해집니다. 석유 및 가스 생산이 더 깊은 물로 이동함에 따라 부양 장치가 필요하며 갑판 높이는 중량 및 안정성 요구사항에 따라 제한됩니다. 극한의 환경에서 이러한 구조물의 성능을 예측하는 데 있어 자유 표면 및 갑판 충격하중에 대한 구조물의 성능을 정확하게 예측하는 것이 중요합니다.

Computational Fluid Dynamics

CFD(전산 유체 역학)방법은 다양한 산업 분야에 광범위하게 적용되어 유체 흐름과 열 전달 특성을 나타냅니다. CFD는 VOF(Volume of Fluid) 모델과 함께 연안 플랫폼의 공극 차이와 파장 영향 부하를 예측하는데 효과적으로 사용할 수 있습니다.  VOF방법은 자유 표면 형상과 비선형 파형 동작을 정확하게 예측하는 데 사용할 수 있습니다. 부유식 시스템의 경우 CFD를 FEA와 결합하여 파형 충격 시 플랫폼의 동적 및 구조적 반응을 예측할 수 있습니다.

Wave Interaction of a SPAR Platform

Figure 1: Dynamic response of SPAR

그림 1은 10m및 20m파에 대한 SPAR의 동적 응답을 보여 줍니다. 두 파 모두 20초의 주기를 가지며 선형 파형 경계 조건을 사용하여 생성됩니다. SPAR은 질량 중심에 6도의 자유도를 가진 강체로 모형화 됩니다. 그림 2는 질량의 SPAR중심의 수직 변위를 보여 줍니다. 그림 3은 파형 상호 작용으로 인한 SPAR의 수평 방향 힘을 보여 줍니다.

Wave Impact on a Gravity Based Structure (GBS)

그림 4는 중력 기반 구조 (GBS)의 갑판에 대한 파동의 영향을 보여줍니다. 평균 수심은 151.1 미터이고 초기 공극은 21.7 미터입니다. 이 파도는 40 미터의 높이와 17 초의 주기를 가집니다. 그림 5는 상단부분의 웨이브 충격으로 인한 GBS의 수평 및 수직력을 보여줍니다. 힘의 급상승은 그림 4에서와 같이 GBS 전면의 파동과 갑판 상단의 2 차 충격에 대한 초기 충격과 일치합니다.

Figure 2: Vertical displacement of SPAR

Figure 3: Horizontal forces on SPAR   

Figure 4: Wave impact on GBS      .

Figure 5: Force history of GBS due to wave impact on deck


Anup Paul is an Associate with SES, specializing in fluid dynamic analysis of structures, products and processes

Chris Matice, Ph.D., P.E. is a Principal with SES and heads their Process Technology Group, specializing in fluid dynamic and structural evaluation of plant and equipment.

Learn more about the power and versatility of modeling coastal and maritime applications with FLOW-3D>

Interaction Between Waves and Breakwaters

Interaction Between Waves and Breakwaters

This article is an adapted version of an article  published in the journal of the Engineering Association for Offshore and Marine in Italy by Fabio Dentale, E. Pugliese Carratelli, S.D. Russo, and Stefano Mascetti. The first three authors are users at the University of Salerno; Mr. Mascetti is an engineer at XC Engineering, Flow Science’s associate for Italy and France.


방파제의 설계는 복잡한 자연 시스템 (바다와 해안)과 인공 구조물 (방파제)의 상호 작용에 대한 완전한 이해가 필요합니다. 일반적으로 설계 작업은 광범위한 물리적 모델링을 수반하므로 비용이 많이 들고 시간이 오래 걸릴 수 있습니다. 최근까지 방파제의 복잡한 측면은 상세한 수치 시뮬레이션에 너무 어려웠습니다. 이것은 물이 비정상적인 동작으로 복잡한 경로를 통해 흐르는 콘크리트 또는 암석 블록으로 구성된 방파제의 경우 특히 그렇습니다.

컴퓨팅 기술의 진보로 수치, 물리적 조사 간의 격차가 좁혀졌습니다. 상호 작용하는 개별 블록으로 구성된 견고한 구조를 정확하게 표현할 수 있으므로 블록 사이의 빈 공간 내에 수치적으로 유동 영역을 생성 할 수 있습니다. 이것은 방류수가 균일한 다공성 매질로 근사되는 Classical Darcy 주제에 고려될 수 없는 대류항 및 난류의 영향을 포함한 전체 유체 역학적 거동의 영향을 평가할 수 있게 합니다

Modeling Rubble Mound Breakwaters

The following examples describe cases where rubble mound breakwaters are modelled on the basis of their real geometry, taking into account the hydrodynamic interactions with the wave motion.

잔재물 분쇄기 모델링

다음의 사례는 잔해 분쇄물이 파도 운동과의 유체 역학적 상호 작용을 고려하여 실제 형상을 기반으로 모델링된 경우를 설명합니다.

Figure 1: Artificial blocks

Figure 2a: Submerged Breakwaters

Figures 2b and 2c: Emerged Breakwater – Accropode regular & Accropode irregular


방파제의 개략적인 표현을 고려하여 구체 세트로 재현한 것으로 the cube, the modified cube, the antifer, the tetrapod, the accropode, the accropode II, the coreloc, the xbloc,and the xbloc base 등과 같은 일반적으로 사용되는 인공 블록을 고려하기 위해 개발되었습니다. (그림 1).

방파제는 물에 잠기거나 잠긴 경우에는 문헌에 나와 있는 표준 실험식을 사용하여 크기를 결정하고 실제 기하학적 패턴을 따르는 전체 크기, 구조 및 물리적 모델링과 같이 수치적으로 구성했습니다 (그림. 2).

제안된 절차의 품질을 검증하기 위해 침수된 방파제에 대해 세 가지 기하학적 구조를 고려했다. 즉, 부유, 다공성, 고형물과 부유물(그림 2a)이 출현한 방파제의 경우, 두 가지 다른 기하학적 구조를 사용했다(Fig. 2b – 2c).

방파제가 결정되면 기하학적 구조을 FLOW-3D로 가져 와서 유체 역학적 작용을 평가 및 Wave propagation의 연구를 위해 테스트했습니다. 시뮬레이션은 RNG 난류 모델과 coarse격자 안쪽에 중첩된 미세한 격자가 있는 전산메쉬를 사용하여 Navier-Stokes 방정식을 3 차원으로 통합하여 수행되었습니다.

수중 장벽 (계산 영역: 90 × 1.9 × 6.5m)의 경우, 포함된 메쉬 블록은 동일한 크기 (0.30 × 0.27 × 0.30m)의 46,200 개의 요소로 구성되며 중첩된 블록은 2,353,412 개의 요소로 구성하였습니다(0.061 × 0.055 × 0.061m).

방파제에도 동일한 기준이 적용되었습니다. 포함된 격자 블록은 150,000개의 요소(0.50×0.20×0.30m)로 구성되며, 중첩된 블록은 2,025,000개의 요소(0.10× 0.10×0.10m)로 생성되었습니다.

Figures 3a and 3b: Mesh views of submerged breakwater (3a above) & emerged breakwater (3b below)

Figures 4b: Emerged Breakwater – Accropode regular

Figures 4a: Submerged breakwater

결과 중 일부는 다음 이미지에 요약되어 있습니다. 그림 4에서 3 차원 영역의 2 차원 단면을 따른 압력 및 난류 에너지가 나타납니다. 그림 5에는 서로 다른 순간에 잡힌 자유 표면의 3 차원 형상이 나타나있습니다.

유동경로를 따라 개별 솔리드 요소의 윤곽의 유체 역학에 의한 유동 변화는 쉽게 검출 가능합니다. 이것은 자유 표면의 3 차원 재구성에서 가장 잘 드러나며 (그림 5) 방파제에 대한 파동 작용의 효과가보다 자세하게 표현됩니다.

Figures 5a: Submerged breakwater.

Figures 5b: Emerged Breakwater – Accropode regular.

Figures 5c: Emerged Breakwater – Accropode irregular  

Conclusions

잠수함이나 해상 구조물 간의 상호 작용을 정확히 표현하기 위한 Navier-Stoke기반 수치 시뮬레이션을 활용한 방법, 그리고 유체 움직임이 입증되었습니다. 시뮬레이션은 난류 시뮬레이션을 위한 RANS와 자유 표면 계산을 포함하는 첨단 컴퓨터 유체 동적 소프트웨어 시스템(FLOW-3D)을 사용하여 수행되었습니다.

이 결과는 블록 사이의 경로 내에서 유체 운동의 상세한 그림을 제공함으로써 기존의 흐름 방법보다 더 정확한 시뮬레이션을 제공함을 보여줍니다. 블록을 사용하여 기존의 누설 흐름 방법보다 더 정확한 시뮬레이션을 제공합니다. 원칙적으로 모든 관련 부품(필터, 코어 및 토우)에서 구조물이 물에 잠기거나 나타나는 경우 시뮬레이션이 가능하며 제한은 없습니다.

Further studies will be aimed at assessing the stability of individual blocks through the use of the Moving Object model in FLOW-3D.


조선/해양 분야

Coastal & Maritime

FLOW-3D 는 선박설계, 슬로싱 동역학, 파도에 미치는 영향 및 환기를 포함하여 해안 및 해양 관련 분야에 사용할 수 있는 이상적인 소프트웨어입니다.

자유 표면 유체 역학, 파동 생성, 움직이는 물체, 계선 및 용접 공정과 관련한 FLOW-3D 의 기능은 해양 및 해양 산업에서 CFD 공정을 모델링하는 데 매우 적합한 도구입니다. 해안 응용 분야의 경우  FLOW-3D  해안 응용 분야의 경우 FLOW-3D  는 해안 구조물에 대한 심한 폭풍 및 쓰나미 파동의 세부 사항을 정확하게 예측하고 돌발 홍수 및 중요 구조물 홍수 및 피해 분석에 사용됩니다. 기능은 다음과 같습니다.

  • 자유 표면 – 파동 유체 역학 및 오버 토핑 : 규칙 및 불규칙파 및 파동 스펙트럼 (Pierson Moskowitz, JONSWAP)
  • Seakeeping – slamming, planing, porpoising 및 선체 선체 변위 : 완전히 결합된 선박 및 수중 차량 유체 역학
  • 선체 – Resistance, stability and dynamics: surging, heaving, pitching and rolling motion (response amplitude operators or RAOs)
  • 슬로싱 – LNG / 밸러스트 탱크
  • 해양 공학 – 파동 에너지 변환기
 

해안 응용 분야의 경우, FLOW-3D 는 강력한 폭풍과 쓰나미 현상에 의한 해안 구조물이 받는 영향에 대한 세부 사항 예측, 돌발 홍수에 의한 중요한 시설물에 대한 정확한 피해 분석 등을 위해 사용됩니다.

Mooring Lines, Springs and Ropes

FLOW-3D (계류선 및 스프링 등)의 특수 물체를 다른 움직이는 물체에 부착하면 엔지니어가 선박 런칭, 부유 장애물 역학, 부표, 파도에너지 변환기 등을 정확하게 포착할 수 있습니다.

Welding

FLOW-3D 용접 모듈이 추가되면서 조선업계의 용접분야에서는 다공성 등 용접 결함을 최소화할 수 있어 선체의 품질을 크게 높이는 동시에 생산 시간을 최적화할 수 있습니다.

Coastal & Maritime Case Studies

FLOW-3D 사용자들은 연약한 해안선 보호, 구조물에 대한 파장 시뮬레이션, 선체 설계 최적화, 선박 내 환기 연구 등 해안 및 해양 애플리케이션에 FLOW-3D를 사용합니다.

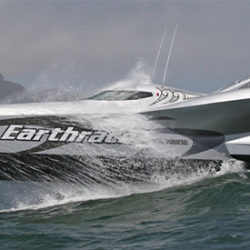
우리는 보트가 세계 항해를 하면서 마주칠 것 같은 다양한 조건에서 항해를 할 수 있는지를 볼 수 있었습니다. 그리고 속도뿐만 아니라 연료 효율과 안전도 고려하도록 설계를 수정할 수 있었습니다.
– Pete Bethune, skipper of Earthrace

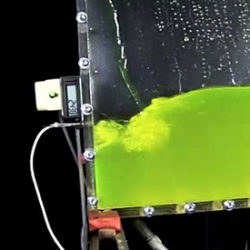
Lateral wave impact in waterWave resultsEarthrace vessel
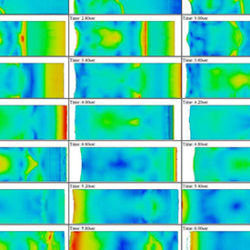
Validation of Sloshing Simulations in Narrow Tanks / Aerial Landslide Generated Wave Simulations / Earthrace: Speed, Fuel Efficiency and Safety
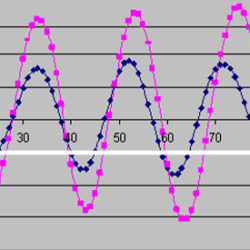
Wave impact vertical displacementEmerged breakwater accropodeStokes theory horizontal velocity
Wave Impact on Offshore StructuresInteraction Between Waves and BreakwatersWave Forces on Coastal Bridges

기타

Bibliography

Models

  • Hybrid Shallow Water/3D Flow
  • Moving Objects
  • Sediment Scour
  • More Modeling Capabilities

관련 기술자료

파도 / Waves

파도 / Waves FLOW-3D 는 비정형 파뿐만 아니라 일반 선형 및 비선형파 표면을 시뮬레이션 할 수 있는 기능이 있습니다. 선형파는 ...
The Fastest Laptops for 2024

FLOW-3D 수치해석용 노트북 선택 가이드

2024년 가장 빠른 노트북 PCMag이 테스트하는 방법 소개 : 기사 원본 출처: https://www.pcmag.com/picks/the-fastest-laptops CFD를 수행하기 위한 노트북 선정 기준은 별도로 ...

Propagation Velocity of Excitation Waves Caused by Turbidity Currents

혼탁류에 의한 자극파의 전파 속도 Guohui Xu, Shiqing Sun, Yupeng Ren, Meng Li, Zhiyuan Chen Abstract Turbidity currents are important ...
Nozzle Scour

Study on the Sand-Scouring Characteristics of Pulsed Submerged Jets Based on Experiments and Numerical Methods

실험과 수치 해석을 기반으로 한 펄스 잠수 제트의 모래 침식 특성 연구 Hongliang Wang, Xuanwen Jia,Chuan Wang, Bo Hu, Weidong ...
river depth

Ecological inferences on invasive carp survival using hydrodynamics and egg drift models

수리역학 및 알 이동 모델을 활용한 외래종 잉어 생존에 대한 생태적 추론 Ruichen Xu, Duane C. Chapman, Caroline M. Elliott, ...
Velocity of pipe

Dynamic Performance of Suspended Pipelines with Permeable Wrappers under Solitary Waves

단일 파동 하에서 투과성 포장지가 있는 현수 파이프라인의 동적 성능 Youkou Dong, Enjin Zhao, Lan Cui, Yizhe Li, Yang Wang ...
Scouring

Non-Equilibrium Scour Evolution around an Emerged Structure Exposed to a Transient Wave

일시적인 파도에 노출된 구조에서의 비평형 세굴 결과 Deniz Velioglu Sogut ,Erdinc Sogut ,Ali Farhadzadeh,Tian-Jian Hsu Abstract The present study evaluates ...
Omega-Liutex Method

Prediction of the Vortex Evolution and Influence Analysis of Rough Bed in a Hydraulic Jump with the Omega-Liutex Method

Omega-Luitex법을 이용한 수력점프 발생시 러프 베드의 와류 진화 예측 및 영향 분석 Cong Trieu Tran, Cong Ty Trinh Abstract The ...
Computational Fluid Dynamics Study of Perforated Monopiles

Computational Fluid Dynamics Study of Perforated Monopiles

Mary Kathryn WalkerFlorida Institute of Technology, mwalker2022@my.fit.edu Robert J. Weaver, Ph.D.Associate ProfessorOcean Engineering and Marine SciencesMajor Advisor Chungkuk Jin, Ph.D.Assistant ...
Numerical Investigation of the Local Scour for Tripod Pile Foundation

Numerical Investigation of the Local Scour for Tripod Pile Foundation

Waqed H. Hassan | Zahraa Mohammad Fadhe* | Rifqa F. Thiab | Karrar MahdiCivil Engineering Department, Faculty of Engineering, University of Warith Al-Anbiyaa, Kerbala 56001, IraqCivil ...

계류 라인 / Mooring Lines

계류 라인 Mooring Lines

현재 버전의 FLOW-3D 는 여러 움직이는 물체를 탄성 로프를 통해 다른 움직이는 물체 또는 고정 된 장소에 연결할 수 있습니다.

로프는 무겁고 늘릴 때 항상 직선으로 간주됩니다. 로프 장력은 로프를 따라 균일하며 단순히 로프 연장 및 스프링 상수와 관련됩니다. 로프 동역학과 로프로 묶인 물건의 움직임에 미치는 영향은 무시됩니다. 이러한 가정은 탄성 로프 모델에 제한을 부과했습니다.

예를 들어, 계류 된 유조선의 움직임을 시뮬레이션 할 때, 모델은 taut mooring lines에 대해서는 작동하지만 catenary mooring lines 에서는 실패합니다. 이는 taut mooring lines이 선의 장력에 비해 가벼우며 모양이 거의 직선 인 반면 catenary lines 은 중량이 커서 선의 모양과 동력에 큰 영향을주기 때문입니다.

모델 설명

이러한 제한을 극복하기 위해 FLOW-3D 버전 11.1에서 호환 계류 라인 모델이 개발 및 구현되었습니다. 모델은 계선에 중력, 부력, 유체 항력 및 인장력을 고려합니다. 계류 선의 전체 3D 동역학뿐만 아니라 계류 물체와의 동적 상호 작용이 계산됩니다. 선은 긴장되거나 느슨해 질 수 있으며, 그 순간 모양이 계산됩니다.

이 모델은 유한 계단 접근법을 사용하여 3D 계량 라인 역학을 수치적으로 해결합니다. 각 라인은 일정 수의 개별 세그먼트로 균등하게 분할됩니다. 하위 시간 단계 알고리즘을 사용하여 각 세그먼트에 대한 질량 중심의 위치 및 속도가 동적 운동 방정식을 계산하여 계산됩니다.

세그먼트의 법선 방향과 접선 방향의 유체 항력은 2 차 항력 항법에 따라 계산됩니다. 이웃 한 두 세그먼트의 조인트에서 인장력은 세그먼트의 스프링 상수와 두 개의 매스 센터 간의 라인 확장을 사용하여 Hooke의 법칙에 의해 계산됩니다. 계류 라인의 모양은 모든 세그먼트의 질량 중심의 공간 분포에 의해 결정됩니다. 계류 라인과 움직이는 물체의 동적 연결은 물체가 라인의 밧줄 끝 위치를 제공하는 동안 라인 역학이 물체에 장력을 제공하는 방식으로 구현됩니다.


시뮬레이션 결과

애니메이션은 해저에 고정되어 진행형 파도에 표류하는 직사각형의 떠다니는 물체에 묶인 4 개의 느슨한 계류 라인의 시뮬레이션 결과를 보여줍니다.

물체의 크기는 64m x 72m x 30m이고 밀도는 500kg/m3 입니다. 들어오는 비선형 파는 높이가 10m이고주기는 8 초입니다. 수심은 70m입니다. 각 계류 라인의 방해받지 않은 길이는 85m입니다. 합성 계류 라인의 길이 밀도는 5 kg/m이고 스프링 상수는 2.4 x 10⁵ N/m입니다. 선들에 대한 법선과 접선 방향의 항력 계수는 각각 1.0과 0.3입니다.

초기에, 계류 선은 전선 모양과 정적 평형을 이룹니다. 파도에 힘입어 물체가 움직이고 파동 전파 방향으로 계류 선이 그려집니다. 시간이 지남에 따라 두 개의 업스트림 라인은 슬랙에서 긴장으로 바뀌며 상당한 길이의 확장을 경험하는 반면 두 개의 다운 스트림 라인은 슬랙 상태를 유지하고 웨이브 모션과 함께 변동합니다. 시뮬레이션이 끝나면 두 개의 긴장 계류 선에 의해 물체의 평균 위치가 유지됩니다.

애니메이션 1. 물결 운동으로 움직이는 떠 다니는 물체는 계선 라인에 의해 구속됩니다.


모델 응용 프로그램

mooring lines 모델은 많은 엔지니어링 응용 분야를 가지고 있습니다. 가장 중요한 응용 분야 중 하나는 해상 석유 및 가스 산업에서 FPSO (Floating Production Storage and Offloading vessels)를 위한 계류 시스템입니다. 또한 Floating Wave Energy Converters (WEC), floating wave breakers, anchored ship 및 기타 여러 계류 구조물, 장비 및 장치에 대한 계류 라인을 시뮬레이션하는 데 사용할 수 있습니다. 계 류 라인 모델을 통합함으로써 FLOW-3D 는 사용자가 실제 문제를 더 잘 시뮬레이션 할 수 있도록 도와줍니다.

Implicit Vs. Explicit Numerical Methods

본 자료는 국내 사용자들의 편의를 위해 원문 번역을 해서 제공하기 때문에 일부 오역이 있을 수 있어서 원문과 함께 수록합니다. 자료를 이용하실 때 참고하시기 바랍니다.

Implicit Vs. Explicit Numerical Methods

Numerical solution schemes are often referred to as being explicit or implicit. When a direct computation of the dependent variables can be made in terms of known quantities, the computation is said to be explicit. When the dependent variables are defined by coupled sets of equations, and either a matrix or iterative technique is needed to obtain the solution, the numerical method is said to be implicit.

수치 해법은 종종 외연적이거나 내재적이라고합니다. 종속 변수의 직접 계산이 알려진 양과 관련하여 이루어질 수있는 경우, 계산은 외연적이라고합니다. 종속 변수가 연결된 방정식 세트에 의해 정의되고 솔루션을 얻기 위해 행렬 또는 반복 기술이 필요하면 수치 방법은 내재적이라고합니다.

In computational fluid dynamics, the governing equations are nonlinear, and the number of unknown variables is typically very large. Under these conditions implicitly formulated equations are almost always solved using iterative techniques.

전산 유체 역학에서 지배 방정식은 비선형이며 미지 변수의 수는 대개 매우 큽니다. 이러한 조건에서 내재적으로 공식화 된 방정식은 거의 모든 경우 반복 기법을 사용하여 해결됩니다

Iterations are used to advance a solution through a sequence of steps from a starting state to a final, converged state. This is true whether the solution sought is either one step in a transient problem or a final steady-state result. In either case, the iteration steps resemble a time-like process. Of course, the iteration steps usually do not correspond to a realistic time-dependent behavior. In fact, it is this aspect of an implicit method that makes it attractive for steady-state computations, because the number of iterations required for a solution is often much smaller than the number of time steps needed for an accurate transient that asymptotically approaches steady conditions.

반복은 시작 상태에서 최종 수렴 상태로 일련의 단계를 통해 솔루션을 향상시키는 데 사용됩니다. 추구하는 솔루션이 일시적인 문제의 한 단계이거나 최종 정상 상태 결과 중 하나인지 여부에 상관없이 사실입니다. 두 경우 모두 반복 단계는 시간과 비슷한 프로세스와 유사합니다. 물론 반복 단계는 대개 실제 시간 의존적 인 동작과 일치하지 않습니다. 실제로, 솔루션에 필요한 반복 횟수가 점진적으로 정상 조건에 접근하는 정확한 과도 상태에 필요한 시간 단계 수보다 훨씬 적기 때문에 정상 상태 계산에 매력을주는 것은 암시 적 방법의이 측면입니다 .

On the other hand, it is also this “distorted transient” feature that leads to the question, “What are the consequences of using an implicit versus an explicit solution method for a time-dependent problem?” The answer to this question has two parts. The first part has to do with numerical stability and the second part with numerical accuracy.

반면에 “시간 의존적 문제에 대해 내재적 솔루션 대 외연적인 솔루션 방법을 사용했을 때의 결과는 무엇입니까?”라는 질문에 이르는 “왜곡 된 일시적인”기능이기도합니다.이 질문에 대한 대답은 두 부분으로 나뉩니다 . 첫 번째 부분은 수치 안정성과 관련이 있으며 두 번째 부분은 수치 정확도와 관련이 있습니다.

The Stability Issue

The principal reason for using implicit solution methods, which are more complex to program and require more computational effort in each solution step, is to allow for large time-step sizes. A simple qualitative model will help to illustrate how this works. Let Q be a quantity whose value Qn+1 we want to compute at time t=(n+1)dt, in terms of its value at time t=ndt, i.e., Qn+1=Qn+dtS, where S is the rate of change in Q.

implicit 해법은 더 복잡한 프로그래밍을 요하고 각 계산 단계에서 더 많은 계산량이 필요하지만이를 사용하는 가장 큰 이유는 큰 크기의 시간 단계를 설정 할 수 있다는 점에 있습니다. 여기에서는 간단한 정성 모델을 이용하여 그 구조를 설명합니다. Q를있는 양으로, 시간 t = ndt의 Q 값에 대해 시간 t = (n + 1) dt의 값 Qn + 1을 계산합니다. 즉 Qn + 1 = Qn + dtS로 S를 Q의 변화율합니다.

In an explicit numerical method S would be evaluated in terms of known quantities at the previous time step n. An implicit method, in contrast, would evaluate some or all of the terms in S in terms of unknown quantities at the new time step n+1. Since new quantities appear on both the left and right side of the Q-equation, it is said to be an implicit definition of the new n+1 values. Usually a matrix or iterative solution must be used to compute the new quantities.

explicit 수치 법에서는 S는 이전 시간 단계 n에서 알려진 양에 대해 평가됩니다. 이에 대해 implicit 해법은 S의 일부 또는 모든 항목이 새로운 시간 단계 n + 1에서 알 수없는 양에 대해 평가됩니다. Q 식의 우변과 좌변 모두에 새로운 양이 출현하는 새로운 n + 1 값의 implicit 정의라고 할 수 있습니다. 일반적으로 이러한 새로운 양을 계산하기 위해 행렬 분해 또는 반복 계산 솔루션이 필요합니다.

Numerical stability has to do with the behavior of the solution as the time-step dt is increased. If the solution remains well behaved for arbitrarily large values of the time step, the method is said to be unconditionally stable. This situation never occurs with explicit methods, which are always conditionally stable. It is easy to see this by dividing the Q-equation by dt and then letting dt approach infinity. In this limit there are no n+1 terms remaining in the equation so no solution exists for Qn+1, indicating that there must be some limit on the size of the time step for there to be a solution.

수치 안정성은 시간 단계 dt를 증가 시켰을 때의 솔루션의 행동에 관련합니다. 어떤 큰 값을 설정 한 시간 단계에 대해서도 해석이 양호한 거동을 나타내는 것이라면, 그 해법은 무조건 안정되어 있다고 말할 수 있습니다. 이 상황은 explicit 해법은 볼 수없고, 항상 조건으로 안정적입니다. Q 식을 dt로 나눈하여 dt가 무한대에 가까워 지도록 하면이를 쉽게 확인할 수 있습니다. 이 제한 내에서 식에 남아있는 n + 1 항은 일절없고, Qn + 1에 존재하는 솔루션도 없습니다. 즉, 솔루션을 얻으려면 시간 단계의 크기에 어떤 제한을 줄 필요가있는 것으로 나타납니다.

In an implicit formulation, a solution for the unknowns at new time step n+1 may be obtained for any size time step. Of course, the solution for very large times may not be realistic unless the implicit formulation has been carefully constructed.

implicit 공식화는 새로운 시간 단계 n + 1에서 알 수없는 수량에 대한 해답은 어떤 시간 단계도 요청할 수 있습니다. 당연히 큰 시간 단계에서 얻어진 해는 implicit 공식화을 신중하게 한 경우를 제외하고 현실적이지 않을 수 있습니다.

A typical iterative solution for Qn+1 is constructed by computing the k+1 iterate in terms of the kth iterate value, where the first iterate is taken to be equal to Qn. The equation for Qk+1 is often a Newton’s approximation (or similar approximation) having the form Qk+1=Qk+A(Qn-Qk+dtSk). In this expression A is a relaxation factor, and Sk is an approximation to S evaluated in terms of the kth iterate. If A is chosen properly, successive iterates will eventually converge to Qn+1.

Qn + 1을 요구하는 전형적인 반복 계산을 세우려면 k 번째 반복 값에서 k + 1 번째 반복을 계산합니다. 여기서 첫 번째 반복이 Qn와 동일한 것으로합니다. Qk + 1 식은 종종 Qk + 1 = Qk + A (Qn-Qk + dtSk) 형식의 뉴턴 근사 (또는 유사한 근사법)입니다. 이 식에서, A는 완화 계수, Sk는 k 번째 반복에 대해 평가 된 S의 근사치입니다. A를 적절하게 선택하면 이후의 반복으로 결국 Qn + 1에 수렴합니다.

The relaxation coefficient A must have the form A=1/(1+Cdt) in order to insure the proper limits at small and large values of dt. That is, at very small time-step sizes the explicit equation is recovered, while at very large time-step sizes the equation has a limiting value independent of dt. The quantity C must be a positive coefficient characterizing all the terms in the original equation (i.e., in S) that have been approximated implicitly. For example, if Q is a velocity component governed by a momentum equation with implicit viscous terms, then C would be proportional to the kinematic viscosity divided by the square of the grid size.

dt가 작은 값과 큰 값의 경우에 적절한 제한을 갖도록 완화 계수 A는 A = 1 / (1 + Cdt) 형식을 취할 필요가 있습니다. 즉, 매우 작은 크기의 시간 단계에서 explicit 방정식은 회복되지만 매우 큰 크기의 타임 단계에서는 식은 dt에 의존하지 않는 제한된 값이 주어집니다. 양 C는 원래 식에서 음으로 근사 된 모든 항목 (즉, S 내)의 특성을 정의하는 양의 계수입니다. 예를 들어, Q가 implicitly 인 점성 항을 따른 운동량 방정식에 의해 지배되는 속도 성분 일 때, C는 동점도를 격자 크기의 제곱으로 나눈 값에 비례합니다.

The Accuracy Issue

When dt is sufficiently small only one iteration is necessary for convergence, which leads to Qn+1=Qn+dt/(1+Cdt)Sn. This shows that the implicit formulation adds a smaller change to Q in one time step than would occur in an explicit method because of the under-relaxation factor A=1/(1+Cdt) that multiplies the time step.

dt가 충분히 작은 경우 수렴은 단일 반복 계산만을 요하고 Qn + 1 = Qn + dt / (1 + Cdt) Sn입니다. 이것은 시간 단계에 곱 부족 완화 계수 A = 1 / (1 + Cdt)에 의해 양으로 해법보다 implicit 공식화 것이 하나의 타임 단계 기준 Q에 의해 작은 변화가 적용 표시됩니다.

As a general rule, it can be shown that the condition Cdt≤1 is very nearly equivalent to the stability condition for an explicit approximation. Another general rule is that the time-step sizes for explicit stability and accuracy are usually equivalent. Thus, when Cdt>1, an explicit method would be unstable, but implicit methods simply under-relax more to maintain the stability of the iterative solution. It is this increased damping, with the increase in time-step size, which produces inaccuracies in transient behavior.

원칙적으로 조건 Cdt≤1은 explicit 근사에 대한 안정 조건과 거의 동일하다는 것을 알 수 있습니다. 또한 또 다른 원칙적으로 양으로 해법의 안정성과 정확도를 얻기위한 시간 단계 크기는 일반적으로 동일합니다. 따라서 Cdt> 1 일 때, explicit 해법은 불안정 해지고 있지만, implicit 해법은 반복 계산에 의한 해석의 안정성을 유지하기 위해 단순히 부족 완화 계수가 작고 조정됩니다. 이 시간 단계 크기의 증가에 따라 증가하는 감쇠가 비정상 행동의 부정확성을 제공합니다.

For an implicit method to have minimal under-relaxation (i.e., little damping), a time-step size much smaller than the stable, explicit value would have to be used. In fact, according to the above analysis, at the explicit stability limit Cdt=1 the implicit approximation still has a significant under-relaxation factor of A=1/2. To reduce this under-relaxation damping the time-step size would have to be much smaller than the explicit stability limit, but this makes little sense since an implicit method is not required.

implicit 해법 최소의 부족 완화 (즉, 작은 감쇠)가 주어진다는 안정된 explicit 해법 값보다 크기가 훨씬 작은 시간 단계를 사용해야합니다. 사실, 위의 분석을 통해 explicit 해법의 안정성 한계 Cdt = 1에서 implicit 근사 아직 A = 1 / 2라는 큰 부족 완화 계수를 가지고 있습니다. 이 부족 완화 감쇠를 줄이려는 explicit 해법의 안정성 한계보다 훨씬 작은 크기의 시간 단계가 필요하지만 implicit 해법은 요구되지 않기 때문에 거의 의미가 없습니다.

A Physical Example

An elementary physical problem involving the propagation of a pressure wave can be used to illustrate the differences between implicit and explicit methods. Imagine an increase in pressure is applied to one end of an organ pipe that is closed at the opposite end. We know that a pressure wave will move down the pipe and be reflected at the closed end. Given enough time, pressure waves will travel back and forth in the pipe many times before the pressure distribution settles down to the constant value applied at the open end.

압력 파의 전파를 수반하는 간단한 물리 현상 문제를 사용하여 implicit 해법과 explicit 해법의 차이를 보여줍니다. 개방 단부에서 압력이 가해지고 반대쪽은 함구쪽에 있기 오르간 파이프를 예로 들어 있습니다. 압력 파가 파이프를 통과하여 함구 단에서 반사하는 것을 알 수 있습니다. 충분한 시간이 주어지면 압력 파가 파이프 내를 여러 번 왕복하고 결국 압력 분포는 개구부에 가해지는 정치에 안정됩니다.

If only steady-state results are wanted, then an implicit solution scheme with lots of damping of the pressure waves should be used so that steady conditions will be reached as quickly as possible. In this case the damping incorporated in the implicit iteration method (i.e., the under-relaxation) is highly desirable.

정상 상태의 결과만을 요구하는 경우는 압력 파의 감쇠가 많은 implicit 해법 구성표를 사용하여 가능한 한 빨리 정상 상태에 도달하게합니다. 이 경우, implicit 반복 계산법에 내장 된 감쇠 (즉, 부족 완화)은 강하게 요구하는 것입니다.

If, instead, the transient pressure waves are to be investigated, then we want the least amount of numerical damping so that many wave reflections can be accurately followed. This situation is best treated with an explicit solution method.

반면 비정상 압력 파를 조사하는 경우는 많은 파도 반사를 정확하게 추적 할 수 있도록 수치적 감쇠를 최소화하는 것이 바람직합니다. 이 상황은 explicit 해법으로 푸는 것이 최선입니다.

Explicit methods require a time-step size that limits the advance of the pressure step to less than one computational cell per time step. However, this restriction is related to accuracy because most difference equations involve quantities from neighboring cells only. A pressure wave that propagates further than one cell in one time step would then be moving into regions that have no defined influence on the pressure. Not only is this physically unrealistic, it also leads to numerical instability.

Explicit 해법은 압력 단계의 진행을 시간 단계 당 1 계산 셀 미만으로 제한하는 크기의 시간 단계를 필요로합니다. 그러나 대부분의 차분 방정식은 인접 셀에서만 양을 고려하기 위해이 제한 정도에 관련합니다. 하나의 시간 단계에서 1 셀 이상을 전파하는 압력 파 압력에 정의 된 영향이 전혀없는 영역에 유입합니다. 이것은 물리적으로 비현실적 일뿐만 아니라 숫자 불안정으로 이어집니다.

Implicit methods, on the other hand, couple all the cells together through an iterative solution that allows pressure signals to be transmitted through a grid. The price for this communication between distantly located cells is a damping or smoothing of the pressure waves introduced by the under-relaxation needed to solve the coupled equations.

반면 Implicit 해법은 반복 계산법을 통해 모든 셀이 결합 된 것으로, 압력 신호가 격자 내를 전파합니다. 이렇게 떨어진 거리에있는 셀 사이의 상호 작용의 대가는 결합 방정식을 푸는 데 필요한 부족 해져서 발생하는 압력 파의 감쇠 또는 평활화(smoothing )입니다.

The choice of whether an implicit versus explicit method should be used ultimately depends on the goal of the computation. When time accuracy is important, explicit methods produce greater accuracy with less computational effort than implicit methods. For this reason, FLOW-3D uses explicit techniques whenever possible, but implicit options are available when they are needed.

implicit 해법과 explicit 해법 중 어느 것을 사용할 것인지 여부는 결국 계산의 목표에 따릅니다. 시간 정확도를 중시하는 경우는 explicit 해법이, implicit 해법에 비해 적은 계산량으로보다 정확한 답을 얻을 수 있습니다. 이러한 이유로 FLOW-3D는 적용 가능한 문제는 가능한 explicit 해법을 사용하지만 필요에 따라 implicit 해법 옵션을 사용할 수 있습니다.

수렴 조건

본 자료는 국내 사용자들의 편의를 위해 원문 번역을 해서 제공하기 때문에 일부 오역이 있을 수 있어서 원문과 함께 수록합니다. 자료를 이용하실 때 참고하시기 바랍니다.

Convergence Criteria/수렴 조건

No material is truly incompressible, but this assumption is often a good approximation. When using this assumption in connection with a numerical solution scheme it is necessary to devise some way to impose the physical mechanism that is responsible for the incompressible behavior.

완전히 비압축성인 물질은 존재하지 않지만 종종 비압축성이라는 가정은 좋은 근사치입니다.  이 가정을 수치 해법 방식으로 사용하는 경우에는 비압축성 거동에 대한 물리적 메커니즘을 주는 어떤 방법을 생각해야합니다.

(1)     \displaystyle \frac{d\rho }{dt}+\rho \nabla \cdot \vec{U}=0

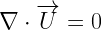
The measure of incompressibility is the divergence of the velocity, Ñ ·U, which is equal to the time rate-of-change of fluid volume per unit volume. The divergence appears in the mathematical statement of mass conservation, where dr/dt is the change in density of a fluid element as it moves with the fluid. If the fluid is incompressible then its density should remain constant and, according to Eq.(1), this implies the velocity divergence should be zero:

비압축성 속도의 발산은 Ñ · U로 계산합니다.  이것은 단위 부피당 유체 체적의 시간 변화율과 같습니다.  발산은 질량 보존식의 항으로 나타납니다.  여기서, dr / dt는 유체와 함께 이동하는 유체 요소의 밀도 변화입니다.  유체가 비압축성 일 때, 그 밀도는 항상 일정 식 1에서 속도의 발산은 0으로 표시됩니다.

\displaystyle \nabla \cdot \overrightarrow{U}=0

The physical mechanism that leads to incompressible behavior is the rapid propagation of pressure waves, which must move through a fluid much faster than the material speed of the fluid. Most often, the numerical propagation of pressure waves is accomplished by some sort of iteration scheme that couples pressures to velocities. The goal of the iteration is to reduce the magnitude of the velocity divergence below some absolute numerical value, e, called the convergence criteria.

비압축성의 거동을주는 물리적 메커니즘은 압력파의 급속한 전파이며, 유체의 물질 속도보다 훨씬 빠르게 유체 내를 이동해야합니다.  대부분의 경우, 압력파의 수치적인 전파는 압력과 속도를 연속하게 된 어떤 반복 계산 체계에서 구할 수 있습니다.  수렴 조건이라 불리는  속도의 발산의 크기가 몇몇 절대값 e 이하까지 계산을 반복하는 것이 목표입니다.

Selecting a Convergence Criteria

A question frequently asked is how should be be chosen? The answer to this is simple, and yet subtle, and depends on the numerical method that is selected for computing a solution.

“어떻게 수렴 기준을 선택해야합니까”는 자주 묻는 질문입니다.  그 대답은 간단하면서도 파악하기 어려운 것으로, 해를 구하기 위해 선택한 수치법에 따라 다릅니다.

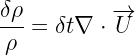
A discretized version of Eq.(1) indicates the change in density occurring in one time step, dt, is given by:

식 1을 이산화 된 식으로 하나의 타임 단계 dt로 인한 밀도 변화가 나타납니다.

(2)     \displaystyle \frac{\delta \rho }{\rho }=\delta t\nabla \cdot \overrightarrow{U}

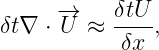
There are a couple of things to observe about this result. First, the right side has the general order of magnitude of:

이 결과는 확인해야 할 몇 가지가 있습니다.  먼저 우변은 기본적으로 자릿수입니다.

\displaystyle \delta t\nabla \cdot \overrightarrow{U}\approx \frac{\delta tU}{\delta x},

where d x is the length or size of the discrete elements used in the numerical solution. This quantity is often referred to as the flow Courant number. It is well known that the Courant number should be less than one for accurate results. It must also be less than one for numerical stability when using explicit computational methods.

여기에서 dx는 수치 해법에서 사용하는 이산화 된 요소의 길이 또는 크기입니다.  이 양은 종종 흐름 “쿨랑 수”라고합니다.  정확한 결과를 얻기 위해서는 쿨랑 수를 1 이하로 해야한다고 알려져 있습니다.  또한 explicit 계산 법을 사용하는 경우도 수치 안정성을 위해 1 미만이어야합니다.

We see from relation (2) that if the Courant limit of one is exceeded, the change in density could be greater than the density itself! This observation is the reason why the Courant limit is so closely tied to issues of accuracy and stability. It also explains why stability conditions become more restrictive as the number of spatial dimensions increases from one to two or three. For stability, the accumulated change resulting from fluxes in all directions must not be allowed to change the density (or other quantity) by more than its current value. Thus, with more dimensions there are more fluxes and a smaller time-step size is needed to ensure that elements are not over emptied.

관계식 2에서 쿨랑 수가 1을 초과하면 밀도 변화의 값이 밀도 자체보다 커질 가능성이 있음을 알 수 있습니다.  이 점에서도 쿨랑 수가 정확성이나 안정성 등의 문제에 밀접하게 관계하고 있는 이유를 알 수 있습니다.  또한 공간적 차원이 1에서 2 또는 3으로 올라 갈수록 안정 조건이 더 어려워지는 이유도 설명됩니다.  안정성을 위해 모든 방향에서의 플럭스에서 발생하는 변화의 누적에 의해 밀도 (또는 다른 양)을 현재의 값보다 크게 변화시켜도 되지 않습니다.  따라서 보다 다차원에서 더 많은 플럭스가 발생하므로 요소가 필요 이상으로 비워지는 것을 피하기 위해 더 작은 시간 단계가 필요합니다.

Returning to relation (2), we see how much change in density to expect from a given convergence criteria e. For example, if e = 0.001 the expected change in density in one unit of time would be one tenth of one percent, certainly small enough to be considered “incompressible” for most applications.

관계식 2로 돌아 가면 주어진 수렴기준 e에서 예상 밀도 변화량을 알 수 있습니다.  예를 들어, e = 0.001하면 한 시간 단위로 예상 밀도 변화는 1 %의 1/10이며,  대부분의 응용프로그램은  “비압축성”으로 간주될 만큼 충분히 작습니다.

A value of e = 0.001 is the nominal value that is often suggested for incompressible flow calculations. In the case of natural convection or other problems where very small density variations are important, the value of e may have to be smaller, depending on how the governing equations are formulated.

e = 0.001은 비압축성 흐름 계산의 많은 경우에 적합하다고 일컬어지는 값입니다.  자연 대류의 경우와 매우 작은 밀도 변화가 중요한 문제에서는 지배 방정식을 어떻게 수립하는지에 따라 더 작은 값을 e로 지정해야 할 수도 있습니다.

If the value of e is too large, and the pressure solution method employs some amount of over-relaxation, the fluid may behave as though it is compressible. In this case numerical pressure waves might be observed to travel across the computational region. Reducing the value of e, or the amount of over-relaxation, reduces the amplitude of these artificial waves.

e 값이 너무 크면 압력의 솔루션 방법은 약간의 오버 완화를 포함하는 경우 유체가 압축성 거동을 나타낼 수 있습니다.  이 경우, 수치적인 압력파의 계산 영역에 걸친 이동을 볼 수 있습니다.  e의 값을 작게하거나 지나치게 완화를 줄이면 이러한 인공적인 파도의 진폭이 작아집니다.

One question that needs to be answered is whether or not errors in density generated in one time step might accumulate to something more significant over a large number of time steps. The answer to this question is no, if the proper numerical method is employed.

대답해야 할 하나의 질문 문제는 하나의 시간 단계에서 생성되는 밀도의 오차가 여러 시간 단계에 걸쳐 큰 영향을 미칠 정도로 누적 될 가능성이 있는지 여부입니다.  이에 대해 적절한 수치 법을 채용하면, 그러한 가능성은 없습니다.

Selecting a Self-Correcting Numerical Method

When numerical iteration methods are employed, it is generally thought that very fine convergence criteria are required to produce accurate results. This in not true, however, if the equations being solved can be formulated in a “self correcting” way. The general idea can be illustrated in connection with the equations for an incompressible fluid, where the incompressibility condition is a zero velocity divergence, D:

수치 반복 계산법을 사용하는 경우, 일반적으로는 정확한 결과를 얻기 위해 매우 정밀한 수렴 기준이 필요하다고 생각합니다.  계산식이 “자기 보정” 형으로 수식화되는 경우, 그것은 반드시 제대로 되지 않습니다.  기본적인 생각은 비압축성 유체에 대한 식을 이용하여 설명 할 수 있습니다.  여기에서는 비압축성 조건으로 속도 발산 D를 제로로 합니다.

(3)     \displaystyle D=\nabla \cdot \overrightarrow{U}=0.

The fluid pressure, p, must satisfy an equation that is derived by taking the divergence of the momentum equation (e.g., the Navier-Stokes equation). Retaining all terms, the pressure equation is:

유체의 압력 p는 운동량 방정식 (나비에 – 스토크 스 방정식 등)의 발산로부터 유도되는 식을 만족해야 합니다.  모든 항목을 유지하고 다음 압력식이 성립됩니다.

(4)     \displaystyle \frac{\partial D}{\partial t}={{\nabla }^{2}}\left( {p}/{\rho }\; \right)+\upsilon {{\nabla }^{2}}D-Q.

where:

\displaystyle Q=\nabla \cdot \left[ \nabla \cdot \left( \overline{UU} \right) \right].

Here r is the fluid density and u its kinematic viscosity. This is a Poisson equation for pressure that is most efficiently solved each time step by an iteration process, for which there must be a convergence criteria.

여기서, r은 유체 밀도, u는 동점도입니다.  이것은 압력의 푸 아송 방정식으로 수렴 기준을 반드시 설정되는 반복 계산 과정을 통해 각 시간 단계가 가장 효율적으로 계산됩니다.

To minimize the accumulation of iteration convergence errors over many time steps one can employ a high level of convergence at each time step, or use a self-correcting treatment that was first used in connection with the Marker-and-Cell (MAC) method (F.H. Harlow and J.E. Welch, Phys. Fluids 8, 2182 (1965)). In many numerical methods devised to solve Eq.(4) the temptation is to set the left hand side to zero because of Eq.(3). In the self-corrective procedure, however, the left side is replaced by:

많은 시간 단계에 걸쳐 누적되는 반복 계산의 수렴 오차를 최소화하기 위해 각 시간 단계에서 높은 수준의 수렴을 설정하거나 MAC (Marker-and-Cell) 법 (FH Harlow, JE Welch , Physics of Fluids Volume 8, p.2182 (1965))과 함께 처음 사용 된 자기 보정형 처리를 사용합니다.  식 4를 풀기 위해 고안된 많은 수치 법에서는 식 3에서 왼쪽을 제로로하고 싶다고 생각 될지도 모릅니다.  그러나 자기 보정형 처리는 왼쪽 아래로 바뀝니다.

\displaystyle \frac{\partial D}{\partial t}\approx \frac{{{D}^{n+1}}-{{D}^{n}}}{\delta t}\to \frac{-{{D}^{n}}}{\delta t},

where n indicates the n-th time step.

여기서 n은 n 번째 시간 단계를 나타냅니다.

Retaining the \displaystyle {{D}^{n}} term is a corrective procedure that tends to remove any error in velocity divergence left from the previous cycle. For instance, if D had a small positive residual in some element at the end of the n-th step, corresponding to a small expansion, then during step n+1 there is a source term added to the equation (i.e., -Dn/d t) to produce a corrective compression by the same amount.

Dn 항을 유지하는 수정 작업은 이전주기에서 남은 속도 발산의 오차가 제거되는 경향이 있습니다.  예를 들어, n 번째 시간 단계의 마지막에 하나의 요소에 약간의 팽창에 해당하는 소량의 양의 오차가 D에 존재하는 경우 단계 n + 1는 그것을 해결하기 위해 같은 양의 압축이 생성 된 소스 항 (-D n / dt)가 식에 추가됩니다.

Using this procedure cuts down the accumulation of incompressibility errors, even when a relatively coarse convergence criteria is used for the pressure equation. More details about self-corrective procedures can be found in the paper: C.W. Hirt and F.H. Harlow, J. Comp. Phys. 2, 114 (1967).

이 프로세스는 압력 방정식에 비교적 거친 수렴 기준을 설정 한 경우에도 비압축성의 누적 오차는 줄어 듭니다.  자기 수정 형 처리에 대한 자세한 내용은 다음 리소스를 참조하십시오.  CW Hirt, FH Harlow, Journal of Computational Physics Volume 2, p.114 (1967).

One distinct advantage of the self-corrective feature, which is not always appreciated, is its insensitivity to initial conditions. Some incompressible flow solvers require initial conditions that satisfy the incompressibility condition. Because of this, these methods sometimes require the solution of a separate problem to get usable initial conditions. In the MAC method, and other methods that use the self-correcting feature, any non-zero velocity divergence in initial conditions is automatically removed after the first cycle of calculation. The convenience of this feature for users cannot be over emphasized.

자기 보정형 기능의 가장 큰 특징으로는 반드시 평가되는 것은 아니지만 초기 조건을 덜 엄격하게 처리 할 점이 있습니다.  일부 비압축성 흐름 해결사는 비압축성 조건을 만족하는 초기 조건이 요구됩니다.  따라서이 방법은 사용 가능한 초기 조건을 얻기 위해 다른 문제에 대한 해결책이 필요할 수 있습니다.  MAC 법이나 자기 수정 형 기능을 사용하는 다른 방법으로는 초기 조건의 비 제로의 속도 발산 계산의 첫 번째 사이클에서 자동으로 제거됩니다.  사용자들에게는 매우 편리한 기능이라는 것은 말할 필요도 없습니다.

FLOW-3D uses the self-corrective procedure as well as an automatic setting of the convergence criteria that adjusts e to whatever is happening during the course of a solution. The latter is another user convenience that can be extremely useful for problems having a variety of flow stages.

FLOW-3D 프로그램은 자기 보정형 처리뿐만 아니라 솔루션을 계산하는 동안 발생하는 상태에 따라 e가 조정되는 수렴기준 자동 설정 기능을 제공합니다.  후자 또한 다양한 흐름의 단계를 갖는 문제에 사용자에게 매우 유용한 사용하기 쉬운 기능입니다.

휴리스틱 분석

Heuristic Analysis

Finite-difference equations may have rapidly growing and oscillating solutions that in no way resemble the solutions expected from the partial differential equations they are meant to approximate. Such solutions are said to exhibit computational instability. Clearly, it is desirable to avoid these numerical disasters. For linear difference equations with constant coefficients, computational stability can be determined using a Fourier method pioneered by von Neumann (see the article in this series “Computational Stability.” Unfortunately, most equations of physical interest are either nonlinear, or have non-constant coefficients, or both.

유한 차분 방정식의 계산 결과에서 본래 근사하는 편미분 방정식에서 예상되는 것과 크게 다르게 급속하게 증가하고 부호가 자주 반전하는 솔루션을 얻을 수 있습니다.  이러한 솔루션이 나타내는 행동을 “계산 불안정성”라고합니다.  물론 이러한 해석은 바람직하지 않습니다.  상수 계수를 따른 선형 차분 방정식의 계산 안정성을 확인하는 방법으로는 von Neumann 의한 푸리에 방법을 사용할 수 있습니다 (본 시리즈 “계산 안정성” 참조).  불행히도, 물리 현상을 나타내는 대부분의 방정식은 비선형이거나 비 상수 계수를 수반하거나 또는 둘 다입니다.

Heuristic Analysis Methods

In this article a simple heuristic analysis method is described for investigating the computational stability of such finite-difference equations. An important by-product of this type of analysis is that it often suggests simple ways to eliminate the instabilities and at the same time increase the accuracy of the approximations.

이 책에서는 위의 유한 차분 방정식의 계산 안정성을 조사하기위한 간단한 휴리스틱 분석 방법에 대해 설명합니다.  이 유형의 분석은 많은 경우에 불안정을 제거하는 방법을 보여뿐만 아니라 근사치의 정확도를 높이는 방법도 보여주는 뛰어난 특징이 있습니다.

The approach described here is called “heuristic” because it is not rigorous or complete, but it often works and can provide a great deal of useful information. Reference [1] is the original publication describing the heuristic stability method from which much of this article has been taken.

여기서 설명하는 방법은 엄격하지도 완전하지도 않은 것으로부터 “추론”이라고되어 있지만, 많은 경우에 유효하고 유용한 정보를 많이 제공합니다.  안정성을 분석하기위한 휴리스틱 기법에 대해 작성된 참고 문헌 [1]은이 책에서 다루고 많은 정보 출처 소스입니다.

Heuristic analysis is based on the rather simple idea of reducing a finite-difference equation back to a partial differential equation by expanding each of its terms in a Taylor series and keeping only terms to a certain order in the expansion. This expansion is in powers of the space and time increments, which are assumed to be small to begin with.

휴리스틱 분석은 유한 차분 방정식을 전개하고 각항을 테일러 급수로 나타내 특정 차수까지의 항만을 남김으로 편미분 방정식에 귀착시키는 비교적 간단한 개념을 기반으로합니다.  이 확장은 처음에는 작은 것으로 예상되는 공간 증가 및 시간 증분의 거듭 제곱으로 표시됩니다.

Certainly such an expansion must, to lowest order, reproduce the original partial differential equation, otherwise, it would not be a good approximation. Oftentimes this requirement is referred to as the “consistency” of the approximation. Terms beyond the lowest order in the expansion are referred to as truncation errors.

이러한 확장은 원래의 미분 방정식을 최소 차수까지 재현하는 것이 필수적입니다.  그렇지 않으면 좋은 근사치를 얻을 수 없습니다.  이 요구 사항은 종종 근사치의 ‘일치 성’이라고 합니다.  전개 된 최소 차수 다음은 절단 오류라고합니다.

The basic concept of a heuristic analysis is that the Taylor-expanded equation is a more accurate representation of the difference equation than the original partial differential equation. Even keeping only a few truncation error terms should result in a partial differential equation that is more closely related to the difference equation. With this in mind, the following discussion will show that an examination of the truncated equation can sometimes reveal properties shared with the difference equation such as stability problems, necessary initial conditions and/or serious inaccuracies.

휴리스틱 분석은 테일러 전개 방정식 쪽이 원래 편미분 방정식보다 차분 방정식을보다 정밀하게 나타내고 있다는 기본 개념을 기반으로합니다.  절단 오차 부분을 일부 남긴 경우에도 항은 차분 방정식에 가까운 편미분 방정식입니다.  이 점을 염두에 두면서 여기에서 계산을 중단 한 식을 조사함으로써 안정성 문제 필요한 초기 조건 심각한 부정확성 등 차등 방정식과 일반적인 특성이 밝혀 질 것을 보여 있습니다.

To begin, we consider the same linear partial differential equation that was discussed in the first article on stability: Computational Stability.

첫째, 안정성에 쓰여진 ” 계산 안정성”에서 사용한 것과 동일한 선형 편미분 방정식 생각합니다.

Linear Equation Example

The equation for one-dimensional advection-diffusion of a variable u(x,t) is

여기에서는 변수 u (x, t)의 1 차의 이류 확산 방정식을 이용합니다.

(1)     \displaystyle \frac{\partial u}{\partial t}+c\frac{\partial u}{\partial x}=\nu \frac{{{\partial }^{2}}u}{\partial {{x}^{2}}}.

The convection velocity c and the diffusion coefficient ν are assumed to be constants. Solutions of this equation are known to be bounded and otherwise well-behaved.

대류 속도 c와 확산 계수 ν은 상수로 간주합니다.  이 방정식의 해는 경계이며, 양호한 거동을 나타내는 것을 알 수 있습니다.

What will be shown here is that the stability of a simple finite-difference approximation to Eq. 1 can be determined from an examination of the truncations errors resulting from a Taylor series expansion of a the difference equation. Not only does this process reveal that there are two basic types of instability, but we shall be able to make a direct comparison between the heuristic method and the von Neumann type of Fourier analysis carried out in Computational Stability. This comparison provides a useful rule-of-thumb for which truncation error terms to keep and which to eliminate from the Taylor expansion in order to evaluate the difference equation’s stability.

여기에서는 차분 방정식의 테일러 급수 전개로 인한 절단 오차를 조사하는 것으로, 식 1에 대한 간단한 유한 차분 근사의 안정성을 판단 할 수있는 것을 나타냅니다.  이 프로세스는 불안정성은 기본적으로 두 가지 유형이 있다는 것을 밝혀 질뿐만 아니라 휴리스틱 기법과 “계산 안정성”에서 이용한 von Neumann 유형의 푸리에 분석을 직접 비교할 수 있게 되는 것 있습니다.  이러한 비교를 통해 차이 방정식의 안정성을 평가하는데 테일러 전개로 인한 절단 오차 중 유지해야 할 항목과 배제 할 부분을 결정하는 데 유용한 경험규칙을 얻을 수 있습니다.

The simple, explicit finite-difference equation approximating Eq. 1 discussed in Computational Stability is

다음 수식은 “계산 안정성”에서 설명한 식 1을 근사하는 간결하고 양적인 유한 차분 방정식입니다.

(2)     \displaystyle \frac{u_{j}^{n+1}-u_{j}^{n}}{\delta t}=-\frac{c}{2\delta x}\left( u_{j+1}^{n}-u_{j-1}^{n} \right)+\frac{\nu }{\delta {{x}^{2}}}\left( u_{j+1}^{n}-2u_{j}^{n}+u_{j-1}^{n} \right)

where, e.g., ujn denotes u(jδx,nδt). This is called a forward-in-time approximation that allows all j location values to be computed at time step n+1, provided all the j values at step n are known. In other words, the difference equation requires one initial condition to start things off, just as the original partial differential equation also requires a single initial condition because it only involves a single time derivative.

여기서, u j n은 u (jδx, nδt)을 나타냅니다.  이것은 시간의 전진 차분 근사라는 것으로, 시간 단계 n의 공간 내의 위치 j 값이 모두 알려진이면 단계 n + 1의 모든 j 값을 계산할 수 있습니다.  즉, 원래의 미분 방정식에서 1 개의 초기 조건이 필요할뿐만 아니라 하나의 시간 미분만을 포함하기 때문에 차분 방정식에서 계산을 시작함에있어서 초기 조건이 하나 필요합니다.

It may be observed that difference equation, Eq. 2, has the property that each space and time location (jδx,nδt) will affect points at time step n+1 at locations j-1, j and j+1. That is, point (jδx,nδt) has a region of influence at later time bounded by lines having slopes ±δx/δt in x-t space. These are similar to characteristic lines along which signals can propagate. For example, the original equation, Eq. 1, has a characteristic line with slope c along which a disturbance advects. In the discrete equation, however, the characteristic lines are not physical characteristics but computational ones defining the region where the difference equation changes data values resulting from a change in value at a particular point.

차분 방정식 2는 공간 위치 및 시간 위치 (jδx, nδt)마다 타임 단계 n + 1의 위치 j-1, j, j + 1의 각 점에 영향을주는 특성을 볼 수 있습니다.  즉, 점 (jδx, nδt)는 현재보다 먼저있는 시간에서, xt 공간에서 기울기 ± δx / δt를 가진 선이 경계가되는 영향 영역을 가지고 있습니다.  이것은 신호의 전달을 나타내는 특성 곡선과 비슷합니다.  예를 들어, 원래 식 1은 교란의 이류를 나타내는 기울기 c의 특성 선을 가지고 있습니다.  그러나 이산 방정식의 특성 선은 물리적 특성을 나타내는 것이 아니라 특정 시점의 값의 변화에 따라 차이 방정식의 데이터 값이 변화하는 영역을 정의하는 계산의 특성을 나타냅니다.

We saw in the Computational Stability article that a Fourier series technique could be used to determine a set of three stability conditions for the difference equation, Eq.2. Here we shall see what can be learned from looking at the truncation errors associated with the approximating equation, Eq. 2.

” 계산 안정성”에서는 푸리에 급수에 의한 방법을 이용하여 차등 방정식 2에 대한 3 개의 안정 조건을 이끌어 낼 것을 알 수있었습니다.  이 책에서는 근사 식 2에 관련된 중단 오차를 조사함으로써 얻은 정보에 대해 설명합니다.

Truncation Error Evaluation

Assume that each term in Eq. 2 is a continuous and differentiable function of x and t. Then, for example, “uj+1,n would be u(xj+δx,tn) and can be expanded about the point (xj,tn) in a Taylor series in powers of δx. Carrying out the expansion in δx and δt for all the terms in Eq.2 yields,

식 2 절은 x 및 t의 연속 미분 가능한 함수로 간주합니다.  그러면 예를 들어, u j + 1, n, n은 u (x j + δx, t n)이되고, 점 (x j, t n)의 주위에 δx의 거듭 제곱에서 테일러 급수 전개를 할 수 있습니다.  식 2의 모든 사항에 대해 δx 및 δt로 확장하면 다음 식을 얻습니다.

(3)     \displaystyle \frac{\partial u}{\partial t}+c\frac{\partial u}{\partial x}-\nu \frac{{{\partial }^{2}}u}{\partial {{x}^{2}}}=-\frac{1}{2}\delta t\frac{{{\partial }^{2}}u}{\partial {{t}^{2}}}+O\left( \delta {{x}^{2}},\delta {{t}^{2}} \right).

All second and higher order terms in δx and δt have been lumped into the order symbol O(δx2 ,δt2). This is a consistent approximation because it reduces to the original partial differential equation, Eq. 1, when δx and δt tend to zero.

2 차 이상의 δx 및 δt 절은 주문 기호를 사용하여 O (δx 2, δt 2)라고 기술되어 있습니다.  δx 및 δt가 제로에 접근 할 때, 원래의 편미분 방정식 1로 귀착하기 때문에 이것은 일관성 있는 근사치라고 할 수 있습니다.

Comparison of Fourier and Truncation Error Analysis

In the article Computational Stability a typical Fourier mode of the form

“계산 안정성”에서는 다음과 같은 형식의 전형적인 푸리에 모드

\displaystyle P_{j}^{n}\propto {{r}^{n}}{{e}^{{ikxj}}}

was substituted into the difference equation, Eq.2, to obtain an equation for r,

이를 차등 방정식 2에 대입하면 r을 구하는 식을 얻었습니다.

(4)     \displaystyle r=1-\left( \frac{ic\delta t}{\delta x} \right)\sin \left( k\delta x \right)-\left( \frac{2\nu \delta t}{\delta {{x}^{2}}} \right)\left[ 1-\cos \left( k\delta x \right) \right].

Computational stability of the difference equation requires that the magnitude of r remain less than or equal to 1.0.

차분 방정식의 계산 안정성을 실현하려면 r의 절대 값을 1.0 이하로하는 것이 필요합니다.

If we insert a Fourier mode of the form exp(i(kx+wt)) into the truncated Eq. 3, it will be seen that the result is the same as Eq. 4 with r=exp(iwδt) and then expanded in powers of wδt, plus the sine and cosine expanded in powers of kδx. This confirms that the two results are the same, as they should be to O(δx2,δt2) retained in Eq. 3.

exp (i (kx + wt)) 형식의 푸리에 모드를 계산을 중단 한 식 3에 대입하면 r = exp (iwδt)되고, wδt의 거듭 제곱에서 전개되고 더 sin과 cos는 kδx의 거듭 제곱 전개되고 식 4와 같은 결과를 얻을 수 있는 것을 알 수 있습니다.  식 3에서 개최 된 O (δx 2, δt 2)와 같이 두 결과는 동일하다고 확정됩니다.

However, the comparison also indicates that to keep the basic form of r in Eq. 4, with its real and imaginary parts, we must keep at least the first non-zero terms from the sine and cosine when they are expanded in powers of kδx. The first non-zero term in the imaginary contribution to r comes from sin(kδx) and is proportion to kδx, which corresponds to the first derivative with respect to x in Eq.3. The first non-zero term in the real part of r (other than 1) comes from cos(kδx) and is proportional to (kδx)2, which corresponds to the second derivative with respect to x in Eq. 3.

그러나 이 비교에서는 식 4의 실수 부와 허수 부로 구성된 r의 기본 형식을 유지하려면 kδx의 제곱으로 전개 된 때 적어도 sin과 cos의 첫 번째 non-zero 항을 유지 해야한다고 표시됩니다.  r의 허수 부분의 첫 번째 non-zero 항은 sin (kδx)로부터 유도 된 것으로, kδx에 비례합니다.  이것은 식 3의 x에 대한 1 차 도함수에 대응합니다.  r의 실수 부 최초의 non-zero 항 (1 제외)은 cos (kδx)로부터 유도 된 것으로, (kδx) 2에 비례합니다.  이것은 식 3의 x에 관한 2 차 도함수에 대응합니다.

These observations lead to the rule-of-thumb that for the truncated equation to reproduce the lowest order real and imaginary parts of the amplification factor r, it is necessary to retain the lowest order even and odd derivatives with respect to each independent variable in the truncation error. In Eq. 3 there is only one first order term proportional to δt and it is a second derivative with respect to t. There are no first order terms proportional to δx.

이러한 점에서 계산을 끊은 식으로 진폭 계수 r의 최소 차수의 실수 부와 허수 부를 재현하려면 중단 오차에서 각 독립 변수에 대해 최소 차수의 짝수와 홀수 함수 (도함수) 을 유지해야한다는 경험식을 지도합니다.  식 3에서 δt에 비례하는 1 차 항은 하나만에서 t에 대한 2 차 도함수입니다.  δx에 비례하는 1 차 항은 없습니다.

Examining the Truncated Equation for Stability

Using the above rule-of-thumb, the truncated equation is,

위의 경험식을 사용하면 계산을 중단 한 식은 다음과 같이됩니다.

(5)     \displaystyle \frac{\delta t}{2}\frac{{{\partial }^{2}}u}{\partial {{t}^{2}}}+\frac{\partial u}{\partial t}+c\frac{\partial u}{\partial x}-\nu \frac{{{\partial }^{2}}u}{\partial {{x}^{2}}}=0

The first important thing to note is that this is not identical to the original partial differential equation, Eq. 1. The claim made here is that Eq. 5 is a better approximation of the finite-difference equation than Eq. 1 and because of this we can obtain information about the stability properties of the difference equation. This, in fact, is the case.

여기에서 먼저주의해야 할 점은이 표현은 원래 편미분 방정식 1과 동일하지 않다는 것입니다.  여기에서 증명하고 싶은 것은, 식 5 식 1보다 유한 차분 방정식을 양호하게 근사 할 식이며, 따라서 차이 방정식의 안정성을 나타내는 특성에 대한 정보를 얻을 수 있다는 점입니다.  바로 이것이 증명됩니다.

Recall that the difference equation propagated information into a region of influence bounded by lines whose slopes are dx/dt=±δx/δt. Similarly, the truncated Eq. 5 has a hyperbolic (i.e., wave) character because of the second space and second time derivatives, and the effective wave speeds are ±(2ν/δt)½. If the difference equation is to have any hope of approximating the truncated equation then its region of influence must at least encompass the region of influence of the truncated equation, which leads to the condition

전술 한 바와 같이 차등 방정식은 기울기 dx / dt = ± δx / δt를 가진 선이 경계가되는 영향 영역에 정보가 전달됩니다.  마찬가지로 계산을 중단 한 식 5는 공간에 대한 2 차 도함수 및 시간에 대한 2 차 도함수에 의해 쌍곡선 (즉, 파동)의 특성을 가지고 유효한 파동 속도는 ± (2ν / δt ) ½입니다.  차분 방정식으로 계산을 중단 한 식을 근사하려면 그 영향 영역이 적어도 계산을 끊은 식의 영향 영역을 포함하고 있어야합니다.  그러면 다음의 조건이 도출됩니다.

(6)     \displaystyle \frac{2\nu }{\delta t}\le {{\left( \frac{\delta x}{\delta t} \right)}^{2}}   or   \displaystyle \frac{2\nu \delta t}{\delta {{x}^{2}}}\le 1.

Courant, Friedrichs and Lewy [2] used a similar region of influence condition, now called the Courant condition, which restricts the distance a wave travels in one time increment to less than one space increment. A violation of the Courant condition leads to an oscillating and exponentially growing instability. Condition Eq. 6 is precisely one of the stability conditions found from Fourier analysis in Computational Stability.

Courant, Friedrichs 및 Lewy [2]는 유사한 영향 영역에 관한 조건을 사용했습니다.  현재 이것은 “쿨랑 조건”이라고 불리며 하나의 시간 증분 사이에 파도가 전파하는 거리가 하나의 공간 증분 미만으로 제한된다는 것입니다.  쿨랑 조건이 충족되지 않은 경우, 부호의 빈번한 반전이나 기하 급수적 인 증가를 수반 불안정성이 생깁니다.  조건식 6은 바로 ‘ 계산 안정성 “푸리에 분석에서 도출 한 안정 조건의 하나입니다.

A similar Courant-type condition can be inferred from the two first order derivative terms (the advective terms) in the truncated Eq. 5, which propagate information with speed c,

계산을 중단 한 식 5의 2 개의 1 차 도함수 항 (이류 항)에서 다음과 같은 유사한 쿨랑 유형 조건을 추측 할 수 있습니다.  여기에서 정보는 속도 c로 전달합니다.

(7)     \displaystyle \frac{c\delta t}{\delta x}\le 1.

This stability condition, also identified in Computational Stability, likewise leads to an oscillating and growing instability when violated.

이 안정 조건도 “계산 안정성”로 표시 한 것으로, 충족되지 않을 때뿐만 아니라 부호의 반전이나 증가를 수반 불안정성이 생깁니다.

To uncover a third stability condition we must first rewrite the truncated equation by converting the δt term to have space instead of time derivatives, but in a way that still maintains the first order of the expansion. This is done by differentiating Eq. 3 by t and neglecting all first and higher order terms,

세 번째 안정 조건을 도출 먼저, δt 항을 변환하여 계산을 중단 한 식을 다시 작성합니다.  이 때 배포 1 차 항이 유지되도록 시간 도함수 대신 공간 도함수를 갖도록 변환합니다.  이것은 식 3을 t로 미분 1 차 이상의 항을 무시합니다.

(8)     \displaystyle \frac{{{\partial }^{2}}u}{\partial {{t}^{2}}}+c\frac{\partial }{\partial x}\frac{\partial u}{\partial t}-\nu \frac{{{\partial }^{2}}}{\partial {{x}^{2}}}\frac{\partial u}{\partial t}=O\left( \delta t \right)

Next replace the first time derivative of u by t in this equation using Eq. 1 to obtain

그런 식 1을 이용하여이 식 u / t 시간의 1 차 도함수를 대체하여 다음의 식을 얻는다.

(9)     \displaystyle \frac{{{\partial }^{2}}u}{\partial {{t}^{2}}}={{c}^{2}}\frac{{{\partial }^{2}}u}{\partial {{x}^{2}}}-2c\nu \frac{{{\partial }^{3}}u}{\partial {{x}^{3}}}+{{\nu }^{2}}\frac{{{\partial }^{4}}u}{\partial {{x}^{4}}}+O\left( \delta t \right)

Finally, rewrite the truncated Eq.5 using this result for the δt term

마지막으로,이 결과를 이용하여 δt 사항에 대해 계산을 중단 한 식 5를 다시 작성합니다.

(10)     \displaystyle \frac{\partial u}{\partial t}+c\frac{\partial u}{\partial x}=\left( \nu -\frac{{{c}^{2}}\delta t}{2} \right)\frac{{{\partial }^{2}}u}{\partial {{x}^{2}}}+c\nu \delta t\frac{{{\partial }^{3}}u}{\partial {{x}^{3}}}-\frac{{{\nu }^{2}}\delta t}{2}\frac{{{\partial }^{4}}u}{\partial {{x}^{4}}}.

This result is identical to what would have been obtained by Taylor expanding the original finite-difference equation about the point x=jδx and t=(n+½)δt (and would probably have been easier).

마지막으로 얻어진 수식은 원래 유한 차분 방정식을 점 x = jδx 및 t = (n + ½) δt의 주위에 테일러 전개하고 (아마도 더 쉽게) 제공하는 것과 같은 식입니다.

According to our rule-of-thumb the last two terms on the right side proportional to δt can be dropped because they involve higher order derivatives than what is in the first δt term on the right side, which leaves,

위의 경험칙에서 δt에 비례 우변의 마지막 두 절은 우변의 첫 번째 δt 항에 포함 된 것보다 고차 도함수를 포함하기 때문에 폐기합니다.

(11)     \displaystyle \frac{\partial u}{\partial t}+c\frac{\partial u}{\partial x}=\left( \nu -\frac{{{c}^{2}}\delta t}{2} \right)\frac{{{\partial }^{2}}u}{\partial {{x}^{2}}}.

This is an alternative form for the truncated equation that retains only the lowest order (first) truncation errors and only those that contain the lowest even and odd derivatives with respect to each independent variable.

이것은 계산을 끊은 식의 대체 형식으로 최소 차수 (1 차)의 중단 오차와 각 독립 변수에 대해 최소의 짝수와 홀수 함수 (도함수)을 포함 것만을 보유하고 있습니다.

Equation 11 is nearly the same as the original Eq. 1, except for a modified diffusion coefficient. The significant thing here is that the diffusion coefficient can be negative. As long as the diffusion coefficient is positive solutions of Eq. 11 exhibit exponentially damped behavior, but with a negative coefficient solutions have an exponentially growing character, i.e., a computational instability! Thus, a further condition for computational stability is that the diffusion coefficient remains positive,

식 11는 변형 된 확산 계수를 제외하고는 원래의 식 1과 거의 동일합니다.  여기서 중요한 것은, 확산 계수는 마이너스가 될 가능성이있는 것입니다.  확산 계수가 양수로 한 식 11의 해는 기하 급수적으로 감쇠 거동을 나타내지 만 계수가 음수 솔루션은 기하 급수적으로 증가하는 특성을 보인다, 즉 계산의 불안정성이 생깁니다 .  따라서 계산 안정성을 구현하기위한 또 하나의 조건으로 확산 계수가 정의되는 것을 결정합니다.

(12)     \displaystyle \frac{{{c}^{2}}\delta t}{2}\le \nu

In this case the instability is a pure growing one without the oscillations in sign associated with the two earlier region-of-influence conditions. If instability is encountered, knowing whether it is exhibiting an oscillation in sign or not will identify it as either a region-of-influence violation or a negative diffusion coefficient. Having this knowledge makes it easier to find a remedy for the instability.

이 케이스의 불안정성은 전술의 영향 영역에 관한 두 가지 조건에 관련한 부호 반전을 수반하는 것이 아니라 단순히 증가하는 특성입니다.  불안정성이 보여진다 부호의 빈번한 반전을 수반 여부를 파악하여 영향 영역에 관한 조건 또는 음의 확산 계수에 관한 조건 중이 충족되지 않았는지 확인 할 수 있습니다.  이러한 정보를 파악할 수 있으면 불안정을 해소하는 방법을 쉽게 찾을 수 있습니다.

Application to Two-Dimensional Fluid Flow

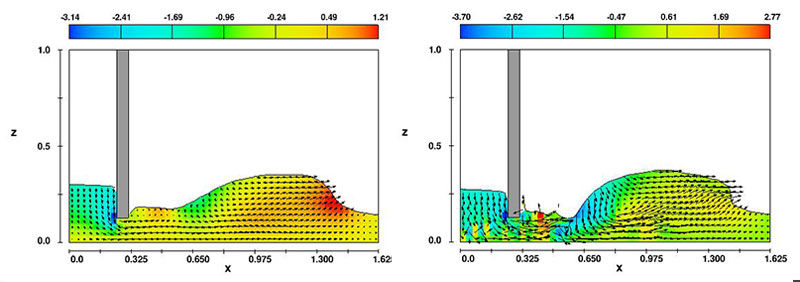
A two-dimensional example (x,z) of water flowing under a laboratory scale sluice gate offers a test for examining a computational instability arising from non-linearity in the governing equations. The physical problem consists of water held behind a gate with an elevation of 0.9ft. Downstream (right) of the gate there is a water pool of depth 0.14 ft. Gravity is 32.2 ft/s2 in the negative z direction (down). At time t=0 the gate is raised up a distance of 0.125ft and water surges out into the pool. Figure 1 shows the resulting flow obtained with a Navier-Stokes solver [3] at t=0.35s. The solver used for this example has been optimized to automatically eliminate instabilities so none are apparent in this case, but it is possible to force the program to use non-optimum settings.

실험실 규모의 수문 아래를 통과하는 2 차원 (x, z)의 흐름의 예는 지배 방정식의 비선형 성으로 인한 계산 불안정성을 조사 테스트합니다.  이 물리 현상 문제는 0.9 피트 높이까지 물을 막아서있는 수문이 있습니다.  수문 하류 측 (오른쪽)의 수심은 0.14 피트입니다.  중력이 -z 방향 (아래쪽)에 32.2 피트 / s 2입니다.  시간 t = 0에 수문은 0.125 피트 상승하고 물이 하류로 흘러갑니다.  그림 1은 나비에 스톡스 솔버[3]을 이용하여 얻은 t = 0.35s의 흐름을 나타냅니다.  이 예에서 사용 된 솔버는 불안정성을 자동으로 제거하도록 최적화되어 있기 때문에이 경우에는 불안정성은 볼 수 없습니다.  그러나 프로그램에 최적화되지 않은 설정을 강제로 실행할 수 있습니다.
Computational stability issues

Figure 1 (left). Flow under a sluice gate. No unstable behavior is observed.
Figure 2 (right). Flow instability developing when computed with small time step and no viscosity.

To demonstrate some unstable behavior we first examine a heuristic analysis performed on the vertical velocity equation used in the simulation. Focus is on the effective diffusion coefficients for the z direction velocity w, while all other truncation errors are ignored,

불안정한 거동을 실례로 설명하기 위해 먼저 시뮬레이션에 사용 된 수직 속도 식에 대해 수행 한 휴리스틱 분석을 고찰합니다.  여기에서 z 방향 속도 w에 대한 효과적인 확산 계수에 초점을 맞추고 있으며, 다른 모든 중단 오차는 무시합니다.

(13)     \displaystyle \frac{\partial w}{\partial t}+u\frac{\partial w}{\partial x}+w\frac{\partial w}{\partial z}+\frac{\partial }{\partial z}\left( \frac{p}{\rho } \right)+g=\left( \nu +\frac{\alpha u\delta x}{2}-\frac{{{u}^{3}}\delta t}{2}-\frac{\delta {{x}^{2}}}{4}\frac{\partial u}{\partial x} \right)\frac{{{\partial }^{2}}w}{\partial {{x}^{2}}}+\left( \nu +\frac{\alpha w\delta z}{2}-\frac{{{w}^{2}}\delta t}{2}-\frac{\delta {{z}^{2}}}{2}\frac{\partial w}{\partial z} \right)\frac{{{\partial }^{2}}w}{\partial {{z}^{2}}}

The diffusion of w in the x and z directions are expressed by the two terms on the right side of Eq. 13, where ν is the fluid viscosity and α is a parameter that modifies the numerical approximation of the term describing the u advection of w, i.e., the second term on the left side of the above equation. When α=0 the finite-difference advection approximation is said to be centered about the location of w, but when α=1 an upstream or “donor cell” approximation is used.

x 및 z 방향의 w의 확산은 식 13의 우변의 두 항으로 표현되어 있습니다.  여기서, v는 유체 점성, α는 w의 u 이류를 나타내는 항 (식 13의 좌변의 제 2 항)의 수치 근사를 수정하는 매개 변수입니다.  α = 0 일 때, 이류의 유한 차분 근사 w의 위치를 중심으로 한 근사하지만, α = 1 일 때, 상류 측 또는 “도나세루」에 의한 근사를 사용합니다.

The first thing to notice is that if ν=0 and a centered difference approximation is also used (α=0) then the lowest order term in the two effective viscosity coefficients are proportional to δt and are negative. This clearly leads to unstable behavior, and is a well known property of the central difference approximation. Adding enough viscosity to keep the diffusion coefficient positive is also an established procedure to gain stability, but at the possible cost of introducing too much diffusion. The upstream difference option, α=1, is a reasonable compromise; provided the condition wδt<δx is maintained, the diffusion coefficients are positive (provided the δx2 and δz2 terms are small) and the simulation will be stable.

먼저 주의해야 할 점은 ν = 0이고 중심 차분 근사를 사용하는 경우 (α = 0), 2 개의 유효 점성 계수의 최소 차수의 항은 δt에 비례하고, 부가됩니다.  이것은 분명 불안정한 거동을 이끌 것으로, 중심 차분 근사의 잘 알려진 특성입니다.  확산 계수를 양수 유지하기 위해 충분한 점성을 추가 수법도 안정성을 얻는 데에서 확립 된 방법이지만, 확산이 커질 위험성도 있습니다.  상류 측에서 차분 옵션 α = 1은 합리적인 타협이다.  조건 wδt <δx이 충족되는 한, 확산 계수는 양이며 (δx 2 및 δz 2 항이 작은 경우) 시뮬레이션도 안정됩니다.

If the δx2 and δz2 terms in the diffusion coefficients are not small there is a possibility of unstable behavior. To demonstrate this we set the viscosity to zero and reduce the amount of upstream differencing by setting α=0.05. To keep the negative δt term less than the a term a very small time step δt=0.00025 is used. With these settings the resulting simulation is shown in Fig. 2. An instability in the z velocity has developed just upstream of the sluice gate, which is shown close up in Fig. 3 (where color indicates the z velocity magnitude).

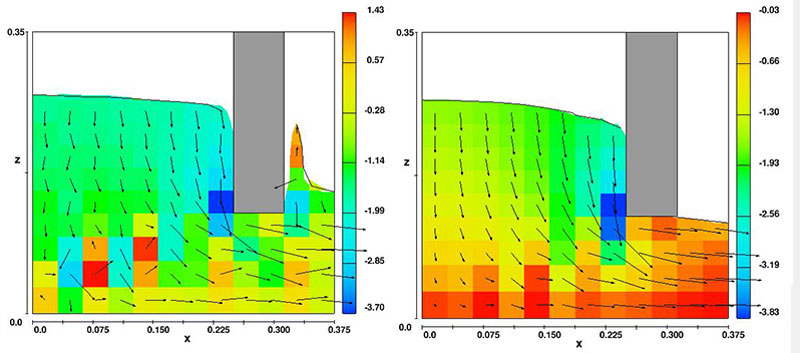
확산 계수의 δx 2 및 δz 2 항이 작지 않은 경우 불안정한 거동이 발생할 수 있습니다.  이를 설명하기 위해 점성을 0으로 설정하고 상류의 차이 량을 α = 0.05로 줄입니다.  부정적인 δt 항이 a 항보다 작아 지도록 매우 작은 시간 단계 δt = 0.00025을 사용합니다.  이러한 설정에서 실행 된 시뮬레이션을 그림 2에 나타냅니다.  수문 상류 측에서 z 속도의 불안정성이 발생하고 있습니다.  그림 3은 그 확대도를 나타냅니다 (색상은 z 속도의 크기를 나타낸다).

This instability is a result of a negative x-direction diffusion coefficient, which is coming from the δx2 term. A negative value results from the fact that the flow upstream of the gate is compressing in the z direction, but expanding in the x direction, which means that the x derivative of u in the δx2 term is positive in this region resulting in a net negative diffusion coefficient.

이 불안정은 δx 2 항에 의하여 부정되었다 x 방향의 확산 계수에 기인합니다.  수문 상류의 흐름은 z 방향으로 압축하고 있습니다 만, x 방향으로 팽창하고 있기 때문에 음수입니다.  즉,이 영역에서는 δx 2 항의 u의 x 방향 도함수는 긍정적이고 순으로 부정적인 확산 계수입니다.

A check on this conclusion can be made by adding in a little viscosity ν=0.0093 to compensate for the negative δx2 term. Figure 4 shows that this change does, indeed, stabilize the flow.

이 결론을 확인하려면 부정적인 δx 2 항을 보정하기 위해 약간 점성을 추가합니다 (ν = 0.0093).  그림 4는이 작은 변화에 의해 흐름이 확실히 안정된 것을 알 수 있습니다.

This example demonstrates that truncation error terms arising from non-linear terms in the original equation influence the computational stability of the difference equation. This type of instability cannot be found by a von Neumann type Fourier analysis. Perhaps most important of all is that when troublesome truncation errors are found to exist this knowledge can be used to alter the finite difference equations to eliminate those errors.

이 예에서는 원래의 방정식의 비선형 항으로 인해 중단 오차 항은 차분 방정식의 계산 안정성에 영향을 미치는 것으로 나타했습니다.  이 유형의 불안정은 von Neumann 유형의 푸리에 분석에서 찾을 수 없습니다.  가장 중요한 것은 문제가 될 수있는 중단 오차가 존재하는 것으로 판명 될 때이 지식을 이용하여 유한 차분 방정식을 수정하여 이러한 오차를 제거 할 수 있습니다.
Totally unstable flow versus stable flow

Figure 3 (left). Close up of locally unstable flow caused by negative δx2 term. Color indicates z velocity.
Figure 4 (right). Same as Fig. 3 with a small amount of viscosity added to compensate for negative δx2 term.

Summary

To summarize, it has been shown that all the stability conditions associated with a linear finite-difference equation, Eq.2, can be identified using a heuristic truncation error approach. This approach not only identifies the instabilities, it also indicates what can be done to eliminate them. For instance, for a region-of-influence violation only a reduction in the time-step increment will solve the problem, but if there is a negative diffusion coefficient then adding more diffusion to compensate for the errors is one way to regain stability. Knowing the origin of a negative diffusion error may also suggest how the original finite-difference equation might be modified to avoid this problem.

이 책에서는 선형 유한 차분 방정식Eq.2에 관련된 모든 안정 조건을 중단 오차에 대한 경험적 접근에 의해 특정 할 수 있는지를 보여주었습니다.  이 방법은 불안정성을 특정 할 수있을 뿐만 아니라 그것을 제거하는 방법을 보여줍니다.  예를 들어, 영향 영역에 대한 조건이 충족되지 않을 경우 시간 단계를 줄일 수 밖에 없어 문제를 해결할 수 없지만, 음의 확산 계수가 존재하는 경우는 확산을 확대하고 오차를 보정하여 안정성을 되찾는 방법 도 있습니다.  음의 확산 오차의 원인을 아는 것은이 문제를 해결 할 수 있도록 원래의 유한 차분 방정식을 어떻게 해결 하는가하는 방법을 알려 줄 수 있습니다.

The most significant aspect of the heuristic approach is that it is not limited to linear equations with constant coefficients, as was shown in connection with the example of flow under a sluice gate. No special assumptions were necessary to form the approximating truncated equation. The goal was simply to reverse the procedure of writing a difference equation to approximate a partial differential equation, and instead to write a partial differential equation that approximates the difference equation. A simple rule-of-thumb was described for constructing the truncated equation. This approximating equation was then used to check for region-of-influence violations and for possible negative diffusion coefficients both features that lead to unstable solutions.

휴리스틱 접근법의 가장 중요한 특징은 상수 계수를 따른 선형 방정식에 한정되지 않는다는 점입니다.  이것은 수문 아래를 통과하는 흐름의 예에서 나타났습니다.  계산을 끊은 식의 근사 식을 세우는 데 특별한 가정이 필요하지 않았습니다.  편미분 방정식을 근사하는 차분 방정식을 설명하는 것이 아니라 차분 방정식을 근사하는 편미분 방정식을 기술한다는 단순히 역순를 할 목적이었습니다.  계산을 중단 한 식을 세우기위한 간단한 경험칙에 대해서도 설명했습니다.  이 근사 식을 사용하여 솔루션의 불안정으로 이어질 영향 영역에 대한 조건이 충족되어 있는지, 또한 음의 확산 계수가 존재하는지의 두 관점을 확인했습니다.

Several additional examples involving compressible and incompressible fluid dynamics simulations can be found in the original heuristic stability paper [1], which further show how the heuristic approach can be applied to real, practical, non-linear problems.

안정성에 관한 경험적 분석에 대해 기술 된 참고 문헌 [1]에는 압축 흐름 및 비 압축 흐름을 따른 몇 가지 유체 역학 시뮬레이션 예가 나와 있습니다.  또 경험적 접근을 실제 비선형 문제에 적용하는 방법에 대해 자세히 나와 있습니다.

References

  1. C.W. Hirt, Heuristic Stability Theory for Finite-Difference Equations, J. Comp. Phys., 2, 339 (1968).
  2. R. Courant, K.O. Friedricks and H. Lewy, Math. Ann. 100, 32 (1928).
  3. The commercial software package FLOW-3D from Flow Science, Inc., Santa Fe, NM, USA.

경계 조건 – 유출

Boundary Conditions – Outflow

In many simulations, fluid must flow out one or more boundaries of the computational region. But what constitutes a good boundary condition at such “outflow” boundaries?

경계 조건 – 유출

많은 시뮬레이션에서 유체는 계산 영역의 하나 이상의 경계에서 유출해야 합니다.  그러나 그러한  ‘유출’ 경계에서 좋은 경계 조건은 어떤 것이 있을까요?

In compressible flows, when the flow speed at the outflow boundary is supersonic, it makes little difference how the boundary conditions are specified since flow disturbances can’t propagate upstream. However, in low speed and incompressible flows disturbances introduced at an outflow boundary can affect the entire computational region.

압축성 흐름은 유출 경계에서 유속이 초음속일때 흐름의 교란이 상류로 전파 될 수 없기 때문에 경계 조건의 지정 방법에 따라 차이가 생기는 경우는 거의 없습니다.  그러나 느린 비압축성 흐름의 경우는 유출 경계에서 발생하는 동요는 계산 영역 전체에 영향을 미칠 수 있습니다.

Continuative Approximation

The simplest and most commonly used outflow condition is that of a “continuative” boundary. Continuative boundary conditions consist of zero normal derivatives at the boundary for all quantities. The zero-derivative condition is intended to represent a smooth continuation of the flow through the boundary.

연속 근사

가장 간단하고 가장 일반적으로 사용되는 유출 조건은 “연속”경계 조건입니다.  연속 경계 조건은 모든 유량의 경계에서 제로 법선 미분으로 구성되어 있습니다.  제로 미분 조건은 경계를 통과하고 매끄럽게 연속 흐름을 표현하는 것을 목적으로 하고 있습니다.

It must be stressed that the continuative boundary condition has no physical basis; it is a mathematical statement that may or may not provide the desired flow behavior. In particular, if flow enters the computational region across such a boundary, then the computations may be wrong because nothing has been specified about flow conditions existing outside the boundary.

여기에서 연속 경계 조건은 물리적 근거가 없는 것을 강조해야합니다.  이것은 수학적 이론이며 실제로 바람직한 흐름을 얻을 수 있을지 여부는 확실하지 않습니다.  특히 흐름이 이러한 경계를 통과하여 계산 영역에 들어갔을 경우 경계의 외부에 존재하는 흐름 조건에 관해서는 아무것도 지정되어 있지 않기 때문에 잘못된 계산이 될 수 있습니다.

Improved Continuative Approximation

FLOW-3D uses a special enhancement to continuative boundaries to improve their behavior. If flow attempts to enter the computational region across this type of boundary it must do so by starting from a condition of rest. This practice helps to reduce inflow and often results in a reasonable approximation of a smooth outflow condition. Nevertheless, a continuative boundary condition must always be viewed with suspicion.

연속 근사 개선

FLOW-3D는 특수 강화 방법을 사용하여 연속 경계의 거동을 개선하고 있습니다.  이 유형의 경계를 통과하여 계산 영역에 들어 가려고하는 흐름은 먼저 정지 조건에서 시작해야합니다.  이에 따라 유입이 감소하고 부드러운 유출의 조건을 합리적으로 근사 할 수있는 경우가 많습니다.  그럼에도 불구하고, 연속 경계 조건은 항상 의심의 눈으로 볼 필요가 있습니다.

Other Approximations

For limited classes of problems, better outflow boundary conditions do exist. For example, special boundary treatments have been devised for wave propagation problems that try to determine the speed and direction of waves approaching the boundary and then set boundary conditions so that they continue through the boundary with a minimum of reflection. A useful example of this type of treatment, sometimes called a radiation boundary condition, is described by I. Orlanski, Jour. Comp. Phys. 21, 251 (1976).

기타 근사

문제의 종류는 한정되지만 좀 더 나은 유출 경계 조건도 존재합니다.  예를 들어, 파동 전파 문제에 대해 특별한 경계 처리가 고안되어 있습니다.  이것은 경계에 접근하는 파도의 속도와 방향을 확인하고 최소한의 반사 경계를 통과하여 연속적이도록 경계 조건을 설정하려고하는 것입니다.  이 유형의 처리가 유익한 예는 방사 경계 조건이라는 것도 있지만, I. Orlanski 씨의 Jour. Comp. Phys. 21,251 (1976)에 설명되어 있습니다.

As a general rule, a physically meaningful boundary condition, such as a specified pressure condition, should be used at outflow boundaries whenever possible. When a continuative condition must be used it should be placed as far from the main flow region as is practical so that any adverse influence on the main flow will be minimal.

원칙적으로 유출 경계는 가능한 한 지정된 압력 조건과 같은 물리적으로 유의 한 경계 조건을 사용하십시오.  연속 조건을 사용할 필요가 있는 경우, 실용성이 손상되지 않을 정도로 흐름의 주요 영역에서 최대한 멀리 배치하고, 주류에 대한 악영향을 최소화 할 수 있도록 해야합니다.

난류 모델링

본 자료는 국내 사용자들의 편의를 위해 원문 번역을 해서 제공하기 때문에 일부 오역이 있을 수 있어서 원문과 함께 수록합니다. 자료를 이용하실 때 참고하시기 바랍니다.

Turbulence Modeling

The majority of flows in nature are turbulent. This raises the question, is it necessary to represent turbulence in computational models of flow processes? Unfortunately, there is no simple answer to this question, and the modeler must exercise some engineering judgment. The following remarks cover some things to consider when faced with this question.

난류 모델링

자연에서의 흐름은 대부분은 난류입니다. 이것은 유동의 수치해석 모델에서 난류를 표현할 필요가 있는가? 에 대한 의문이 생깁니다.  불행히도이 질문에 대한 답은 모델링을 할 경우 엔지니어가 공학적인 판단을 내려야합니다.  다음에 이 질문에 직면했을 때 고려해야 할  몇 가지를 설명합니다.

Definitions and Orders of Magnitude

The possibility that turbulence may occur is generally measured by the flow Reynolds number:

난류가 발생할 가능성은 일반적으로 흐름의 레이놀즈 수에 의해 측정됩니다.

where ρ is fluid density and μ is the dynamic viscosity of the fluid. The parameters L and U are a characteristic length and speed for the flow. Obviously, the choice of L and U are somewhat arbitrary, and there may not be single values that characterize all the important features of an entire flow field. The important point to remember is that Re is meant to measure the relative importance of fluid inertia to viscous forces. When viscous forces are negligible the Reynolds number is large.

여기서 ρ는 유체 밀도이고 μ는 유체의 동적 점도입니다. 매개 변수 L과 U는 흐름의 특성 길이와 속도입니다. 분명히 L과 U의 선택은 다소 임의적이며, 전체 유동장의 모든 중요한 특징을 특징 짓는 단일 값이 없을 수도 있습니다. 기억해야 할 중요한 점은 Re가 점성력에 대한 유체 관성의 상대적 중요성을 측정한다는 것입니다. 점성력을 무시할 수있는 경우 레이놀즈 수가 큽니다.

A good choice for L and U is usually one that characterizes the region showing the strongest shear flow, that is, where viscous forces would be expected to have the most influence.

L과 U에 대한 좋은 선택은 일반적으로 가장 강한 전단 흐름을 나타내는 영역, 즉 점성 힘이 가장 큰 영향을 미칠 것으로 예상되는 영역을 특징 짓는 것입니다.

Roughly speaking, a Reynolds number well above 1000 is probably turbulent, while a Reynolds number below 100 is not. The actual value of a critical Reynolds number that separates laminar and turbulent flow can vary widely depending on the nature of the surfaces bounding the flow and the magnitude of perturbations in the flow.

대략적으로 말하면, 1000을 훨씬 넘는 레이놀즈 수는 아마도 난류 일 수 있지만 100 미만의 레이놀즈 수는 그렇지 않습니다. 층류와 난류를 분리하는 임계 레이놀즈 수의 실제 값은 유동을 경계하는 표면의 특성과 유동의 섭동의 크기에 따라 크게 달라질 수 있습니다.

In a fully turbulent flow a range of scales exist for fluctuating velocities that are often characterized as collections of different eddy structures. If L is a characteristic macroscopic length scale and l is the diameter of the smallest turbulent eddies, defined as the scale on which viscous effects are dominant, then the ratio of these scales can be shown to be of order L/l≈Re3/4. This relation follows from the assumption that, in steady-state, the smallest eddies must dissipate turbulent energy by converting it into heat.

완전 난류 흐름에서는 다양한 와류 구조의 집합으로 특징 지어지는 변동 속도에 대해 다양한 스케일이 존재합니다. L이 거시적 길이 특성 척도이고, l을 점성 효과가 우세한 척도로 정의되는 가장 작은 난류 소용돌이의 직경인 경우, 이러한 척도의 비율은L/l≈Re3/4 정도인 것으로 표시 될 수 있습니다.  이 관계는 정상 상태에서 가장 작은 소용돌이가 난류 에너지를 열로 변환하여 발산해야한다는 가정에서 비롯됩니다.

Turbulence Models

From the above relation for the range of scales it is easy to see that even for a modest Reynolds number, say Re=104, the range spans three orders of magnitude, L/l=103. In this case, the number of control volumes needed to resolve all the eddies in a three-dimensional computation would be greater than 109. Numbers of this size are well beyond current computational capabilities. For this reason, considerable effort has been devoted to the construction of approximate models for turbulence.

난류 모델

스케일의 범위에 대한 위의 관계를 보면 적당한 레이놀즈 수 (예 : Re = 10 4 )에서도 범위가 세 자릿수인 L/l=103에 걸쳐 있음을 쉽게 알 수 있습니다. 이 경우 3 차원 계산에서 모든 소용돌이를 해결하는데 필요한 제어 볼륨의 수는 109보다 커집니다.이 크기의 수는 현재 계산 능력을 훨씬 뛰어 넘습니다. 이러한 이유로 난류에 대한 대략적인 모델을 구성하는 데 상당한 노력을 기울였습니다.

We cannot describe turbulence modeling in any detail in this short article. Instead, we will simply make some basic observations about the types of models available. Be forewarned, however, that no models exist for general use. Every model must be employed with discretion and its results cautiously treated.

이 짧은 기사에서는 난류 모델링에 대해 구체적으로 설명 할 수 없습니다.  대신 사용 가능한 모델의 유형에 대한 몇 가지 기본적인 설명만 합니다.  그러므로 일반 모델은 존재하지 않는 것을 미리 양해 바랍니다.  어떤 모델도 신중하게 선택하고 결과를 주의 깊게 처리해야 합니다.

The original turbulence modeler was Osborne Reynolds. Anyone interested in this subject should read his groundbreaking work (Phil. Trans. Royal Soc. London, Series A, Vol.186, p.123, 1895). Reynolds’s insights and approach were both fundamental and practical.

난류를 처음으로 모델링 한 인물은 Osborne Reynolds 입니다.  이 건에 관심이있는 분은 Reynolds 의 획기적인 저서 (Phil. Trans. Royal Soc. London, Series A, Vol.186, p.123,1895)를 참조하십시오.  Reynolds 의 통찰력과 접근 방식은 기본이며 동시에 실용적인 것입니다.

The Pseudo-Fluid Approximation

In a fully turbulent flow it is sometimes possible to define an effective turbulent viscosity, μeff, that roughly approximates the turbulent mixing processes contributing to a diffusion of momentum (and other properties). Thinking of a turbulent flow as a pseudo-fluid having increased viscosity leads to the observation that the effective Reynolds number for a turbulent flow is generally less than 100:

의사 유체 근사

완전 난류 흐름에서는 운동량 (및 기타 특성)의 확산에 기여하는 난류 혼합 공정에 대략적으로 근접하는 효과적인 난류 점도 μ eff를 정의 할 수 있습니다. 난류 흐름을 점도가 증가 된 유사 유체로 생각하면 난류 흐름에 대한 유효 레이놀즈 수가 일반적으로 100 미만이라는 관찰이 가능합니다.

This observation is particularly useful because it suggests a simple way to approximate some turbulent flows. In particular, when the details of the turbulence are not important, but the general mixing behavior associated with the turbulence is, it is often possible to use an effective turbulent (eddy) viscosity in place of the molecular viscosity. The effective viscosity can often be expressed as

이 관찰 결과는 몇 가지 난류를 근사하는 간단한 방법을 제시하고 있기 때문에 특히 유용합니다.  특히 난류 대한 자세한 내용은 중요하지 난류와 관련된 일반적인 혼합 거동이 중요한 경우에는 분자 점성 대신 사용 난류 (소용돌이) 점성을 사용할 수있는 경우가 있습니다.  유효 점성은 다음의 식으로 나타낼 수 있습니다.

where α is a number between 0.02 and 0.04. This expression works well for the turbulence associated with plane and cylindrical jets entering a stagnant fluid. The effective Reynolds number associated with this model is Re=1/α, a number between 25 and 50.

α는 0.02에서 0.04 사이의 숫자입니다.  이 수식은 정체 유체에 들어가는 평면 제트 및 원통형 분류 관련 난류에 대하여 효과가 있습니다.  이 모델에 대한 사용 레이놀즈 수는 Re = 1 / α 25에서 50 사이의 숫자입니다.

While this model is often adequate for predicting the gross features of a turbulent flow, it may not be suitable for predicting local details. For example, it would predict a parabolic flow (i.e., laminar) profile in a pipe instead of the measured logarithmic profile.

이 모델은 종종 난류의 전반적인 특징을 예측하는데는 적합하지만, 로컬 세부 사항을 예측하는 데는 적합하지 않을 수 있습니다.  예를 들어, 측정된 대수 프로필 대신 파이프의 포물선 흐름 (층류 등)의 프로파일을 예측합니다.

Local Viscosity Model

The next level of complexity beyond a constant eddy viscosity is to compute an effective viscosity that is a function of local conditions. This is the basis of Prandtl’s mixing-length hypothesis where it is assumed that the viscosity is proportional to the local rate of shear. The proportionality constant has the dimensions of a length squared. The square root of this constant is referred to as the “mixing length.”

This model offers an improvement over a simple constant viscosity. For example, it predicts the logarithmic velocity profile in a pipe. However, it is not used much because it doesn’t account for important transport effects.

국소 점성 모델

일정한 소용돌이 점성보다 복잡한 것은 국소적 조건의 함수인 유효 점성을 계산하는 것입니다.  이것은 점성이 국소적 전단 속도에 비례한다고 가정된다는 프란틀 혼합 길이 가설(Prandtl’s mixing-length hypothesis )의 기초가됩니다.  비례 상수의 차원은 길이의 제곱입니다.  이 상수의 제곱근은 “혼합 장”이라고합니다.

이 모델은 간단한 일정한 점성 개선을 제공합니다.  예를 들어, 파이프의 대수 속도 프로파일을 예측할 수 있습니다.  그러나 중요한 수송 효과를 지원하지 않기 때문에 그다지 많이 사용되지 않습니다.

Turbulence Transport Models

For practical engineering purposes the most successful computational models have two or more transport equations. A minimum of two equations is desirable because it takes two quantities to characterize the length and time scales of turbulent processes. The use of transport equations to describe these variables allows turbulence creation and destruction processes to have localized rates. For instance, a region of strong shear at the corners of a building may generate strong eddies, while little turbulence is generated in the building’s wake region. The strong mixing observed in the wakes of buildings (or automobiles and airplanes) is caused by the advection of upstream generated eddies into the wake. Without transport mechanisms, turbulence would have to instantly adjust to local conditions, implying unrealistically large creation and destruction rates.

난류 수송 모델

실용 공학의 목적인 가장 뛰어난 수치 모델에는 2 개 이상의 수송 방정식이 있습니다.  난류 과정의 길이와 시간의 스케일을 특징으로는 2 개 분량이 필요하므로 최소한 2 개의 방정식이있는 것이 바람직 할 것입니다.  수송 방정식을 사용하여 이러한 변수를 표현하면 난류의 생성 속도와 파괴율을 국소적으로 할 수 있습니다.  예를 들어, 건물의 모서리의 전단력이 강한 영역에서 강력한 소용돌이가 생성 된 건축물의 후류 영역에서 난류는 거의 생성되지 않습니다.  건축물 (또는 자동차 나 비행기)의 후류에서 관찰되는 강력한 혼합은 상류에서 생성된 소용돌이 후류의 이류에 의해 발생합니다.  수송 메커니즘이 없는 경우, 난류는 국소적 조건에 즉시 적응해야하므로 생성 속도와 파괴율이 비현실적인 크기입니다.

Nearly all transport models invoke one or more gradient assumptions in which a correlation between two fluctuating quantities is approximated by an expression proportional to the gradient of one of the terms. This captures the diffusion-like character of turbulent mixing associated with many small eddy structures, but such approximations can lead to errors when there is significant transport by large eddy structures.

거의 모든 수송 모델에서 하나 이상의 경사 가정을 이루어 두 변동하는 양의 상관 관계가 하나의 항 기울기에 비례하는 식으로 근사됩니다.  이를 통해 다수의 작은 소용돌이 구조와 관련된 난류 혼합 확산적인 특징을 파악할 수 있지만, 큰 소용돌이 구조에 의해 상당한 전송이 존재하는 경우, 이러한 근사 오류가 발생할 수 있습니다.

Large Eddy Simulation

Most models of turbulence are designed to approximate a smoothed out or time-averaged effect of turbulence. An exception is the Large Eddy Simulation model (or Subgrid Scale model). The idea behind this model is that computations should be directly capable of modeling all the fluctuating details of a turbulent flow except for those too small to be resolved by the grid. The unresolved eddies are then treated by approximating their effect using a local eddy viscosity. Generally, this eddy viscosity is made proportional to the local grid size and some measure of the local flow velocity, such as the magnitude of the rate of strain.

Large Eddy 시뮬레이션

난류의 대부분의 모델은 매끄럽게 또는 시간 평균된 난류의 효과를 근사하도록 설계되어 있습니다.  예외는 큰 에디 시뮬레이션 모델 (또는 서브 그리드 스케일 모델)입니다.  이 모델의 배경에는 너무 작은 격자에 의해 해결할 수 없는 것을 제외하고는 난류의 모든 변동 내용은 계산에 의해 직접 모델링 할 수 있어야 한다는 생각이 있습니다.  미해결 소용돌이는 로컬 점성을 사용하여 효과를 근사하여 처리됩니다.  일반적으로이 소용돌이 점성은 국소적인 격자 크기 및 어떤 국소적인 흐름의 속도 측정 (변형 속도의 크기 등)에 비례합니다.

대부분의 난류 모델은 난류의 평활화 또는 시간 평균 효과에 근접하도록 설계되었습니다. 예외는 Large Eddy Simulation 모델 (또는 Subgrid Scale 모델)입니다. 이 모델의 이면에있는 아이디어는 계산이 격자에 의해 해결 되기에는 너무 작은 것을 제외하고, 난류 흐름의 모든 변동 세부 사항을 직접 모델링 할 수 있어야 한다는 것입니다. 해결되지 않은 소용돌이는 로컬 소용돌이 점도를 사용하여 효과를 근사화하여 처리됩니다. 일반적으로, 이 와류 점도는 로컬 격자 크기와 변형률의 크기와 같은 로컬 유속 측정치에 비례하여 만들어집니다.

Such an approach might be expected to give good results if the unresolved scales are small enough, for example, in the viscous sub-range. Unfortunately, this is still an uncomfortably small size. When these models are used with a minimum scale size that is above the viscous sub-range, they are then referred to as Coherent Structure Capturing models.

이러한 접근 방식은 미해결 스케일이 충분히 작은 경우, 예를 들어 점성이 작은 영역에 있는 경우에 좋은 결과를 얻을 수 있을 것으로 기대됩니다.  불행히도 아직은 여전히 불편한 작은 크기 입니다.  이러한 모델을 점성 작은 영역보다 높은 최소 스케일 사이즈로 사용하는 경우는 CSC (Coherent Structure Capturing) 모델이라고합니다.

The advantage of these more realistic models is that they provide information not only about the average effects of turbulence but also about the magnitude of fluctuations. But, this advantage is also a disadvantage, because averages must actually be computed over many fluctuations, and some means must be provided to introduce meaningful fluctuations at the start of a computation and at boundaries where flow enters the computational region.

이보다 현실적인 모델의 장점은 난류의 평균 효과에 대한 정보뿐만 아니라 변동의 크기에 대한 정보도 제공 될 것입니다.  그러나 이와같은 장점은 단점도 있습니다.  평균적으로 실제로 다수의 변동에 대해 계산해야 하며, 계산의 시작 및 흐름이 계산 영역에 들어가는 경계에서 상당한 변화를 도입하기위한 수단을 제공 할 필요가 있기 때문입니다.

Turbulence from an Engineering Perspective

We have seen that it is probably not reasonable to attempt to compute all the details of a turbulent flow. Furthermore, from the perspective of most applications, it’s not likely that we would be interested in the local details of individual fluctuations. The question then is how should we deal with turbulence, when should we employ a turbulence model, and how complex should that model be?

공학적 관점에서의 난류

지금까지 난류의 모든 세부 사항을 계산하려고하는 것은 아마도 합리적이지 않다는 것을 확인했습니다.  또한 많은 적용례의 관점에서 개별 변동의 국소적인 세부 사항이 관심의 대상이 될 수는 없을 것입니다.  거기서 생기는 의문은 난류를 어떻게 처리해야 할지 난류 모델을 언제 선택할지 그 모델이 얼마나 복잡할지에 있다는 것입니다.

Experimental observations suggest that many flows become independent of Reynolds number once a certain minimum value is exceeded. If this were not so, wind tunnels, wave tanks, and other experimental tools would not be as useful as they are. One of the principal effects of a Reynolds number change is to relocate flow separation points. In laboratory experiments this fact sometimes requires the use of trip wires or other devices to induce separation at desired locations. A similar treatment may be used in a numerical simulation.

실험적 관찰에 따르면 특정 최소값이 초과되면 많은 흐름이 레이놀즈 수와 무관하게됩니다. 그렇지 않다면 풍동, 파도 탱크 및 기타 실험 도구는 그다지 유용하지 않을 것입니다. 레이놀즈 수 변경의 주요 효과 중 하나는 흐름 분리 지점을 재배치하는 것입니다. 실험실 실험에서이 사실은 때때로 원하는 위치에서 분리를 유도하기 위해 트립 와이어 또는 기타 장치를 사용해야합니다. 유사한 처리가 수치 시뮬레이션에서 사용될 수 있습니다.

Most often a simulation is done to determine the dominant flow patterns that develop in some specified situation. These patterns consist of the mean flow and the largest eddy structures containing the majority of the kinetic energy of the flow. The details of how this energy is removed from the larger eddies and dissipated into heat by the smallest eddies may not be important. In such cases the dissipation mechanisms inherent in numerical methods may alone be sufficient to produce reasonable results. In other cases it is possible to supply additional dissipation with a simple turbulence model such as a constant eddy viscosity or a mixing length assumption.

대부분의 경우 특정 상황에서 발생하는 지배적 인 흐름 패턴을 결정하기 위해 시뮬레이션이 수행됩니다. 이러한 패턴은 평균 흐름과 흐름의 대부분의 운동 에너지를 포함하는 가장 큰 소용돌이 구조로 구성됩니다. 이 에너지가 더 큰 소용돌이에서 제거되고 가장 작은 소용돌이에 의해 열로 소산되는 방법에 대한 세부 사항은 중요하지 않을 수 있습니다. 그러한 경우 수치 적 방법에 내재 된 소산 메커니즘만으로도 합리적인 결과를 얻을 수 있습니다. 다른 경우에는 일정한 소용돌이 점도 또는 혼합 길이 가정과 같은 간단한 난류 모델을 사용하여 추가 소산을 제공 할 수 있습니다.

Turbulence transport equations require more CPU resources and should only be used when there are strong, localized sources of turbulence and when that turbulence is likely to be advected into other important regions of the flow.  When there is reason to seriously question the results of a computation, it is always desirable to seek experimental confirmation.

An excellent introduction to fluid turbulence can be found in the book Elementary Mechanics of Fluids by Hunter Rouse, Dover Publications, Inc., New York (1978).

난류 전송 방정식은 더 많은 CPU 리소스를 필요로하며 강력하고 국부 화 된 난기류 소스가 있고 그 난류가 흐름의 다른 중요한 영역으로 전파 될 가능성이있는 경우에만 사용해야합니다. 계산 결과에 매우 의문이 생길 경우는 실험에 의해 확인하는 것이 좋습니다.

유체 난류에 대한 훌륭한 소개는 Hunter Rouse, Dover Publications, Inc., New York (1978)의 책 Elementary Mechanics of Fluids에서 찾을 수 있습니다.

Wave Energy Devices

Modeling Wave Energy Devices

최근에, 웨이브 에너지와 같은 재생 자원을 사용하여 낮은 환경 부하로 에너지를 생성하는 새로운 기술 개발에 대한 관심이 전 세계적으로 기하 급수적으로 증가하고 있다. 바다에서 (조류, 파도 등) 전기를 생성할 수 있는 파력 에너지 장치는 특히 중요한데 FLOW-3D 를 이용하여 정확하게 모델링 할 수 있습니다.

Multi-Flap, Bottom-Hinged Wave Energy Converter

Oscillating flap은 바다의 파도에서 에너지를 추출하고 기계적 에너지로 변환합니다. Arm oscillates는 피봇 조인트에 장착되어 물결에 진자처럼 동요합니다.  Flaps은 멀티 Flap 파력 에너지 변환기를 생성하는 배열로 구성될 수 있습니다. 아래 왼쪽은 3개의 flap 배열로 구성된 CFD 시뮬레이션 입니다. 모든 flap은 15m(폭) x 10m(높이) x 2m(두께)로 하단부가 경첩형태로 고정되어 있습니다.

Array는 30m 깊이에서 10초의 주파수와 4m 진폭파에서 동작합니다. 시뮬레이션은 하나의 flap이 다른 flap에 중요한 영향을 주는 복잡한 유속 iso-surface를 보여줍니다. 3개의 flap이  비슷한 동적 움직임을 시작하는 동안   flap의 상호 작용 효과 단계에서 그들의 모션을 렌더링 합니다. 유사한 flap 에너지 변환기는 오른쪽에 표시 됩니다.

이 시뮬레이션에서, 플랩은 가장 낮은 지점에서 물에 완전히 잠깁니다. 이러한 에너지 변환기는 Surface Piercing flap energy converters 라고 합니다. 이러한 시뮬레이션의 예제 모두는 Minerva Dynamics에 의해 제공되었습니다.

Oscillating Water Column

Oscillating water column은 부분적으로 물이 차고, 빠지는 것이 반복되는 구조를 가집니다. 이것은 수면(water line) 아래 바다쪽으로 열리고, 파열의 꼭대기의 공기 column에 닫혀진 구조입니다. 파도가 순차적으로 air column을 압축과 해제를 하는 중 상승 및 하강하는 water column을 발생합니다. 이 갇혀진 공기는 일반적으로 공기 흐름 방향에 상관없이 회전 할 수 있는 터빈을 경유해 대기로부터 유동을 만들게 됩니다. 이러한 터빈의 회전은 전기를 생성하는 데 사용됩니다.

상단의 CFD simulation은 진동하는 water column을 보여줍니다. water column 의 상승과 하강구조가 발생하는hollow구조가 물리적인 부분을 강조하기 위하여 FLOW-3D로 모델링 되었습니다. 이 시뮬레이션은 파형 생성에 대한 다른 선택을 제외하고는 유사한 결과를 보여줍니다. 왼쪽의 시뮬레이션은 wave type 경계 조건을 사용하는 반면, 오른쪽 경계조건은 순차적인 파형을 생산하기 위해 Moving Objects model을 이용하였습니다. Hollow 구조에서의 압력 그래프는 각각의 시뮬레이션에서 보여집니다. 결국 터빈은 회전 운동으로 설정되는 압력에 기초하기 때문에, 챔버 내에 생성되는 압력 얼마나 아는 것이 중요합니다.

Wave Energy Animations

Wave Run-up

Wave Run-up

중요한 해양 구조물 근처에서의 쓰나미 파도의 충격이나 강한 폭풍 해일의 경우에, 다가오는 파의 패턴의 특성을 정확하게 이해하기 위해서는 파형 런업(run-up)의 상세한 3D 해석이 필요합니다. FLOW-3D는 높은 정밀도의 홍수 및 최대 수심 맵을 얻기 위해 사용되어져 왔습니다.

Visualization of wave patterns and run-ups on a GBS using FLOW-3D. The wave was a regular wave of 5.5 m wave height and 8.4 sec period. The scale was 1:40. Courtesy Oceanic Consulting.

Modeling Wave Generation

FLOW-3D의 표면파 생성 모델은 모든 주기성 비선형 파를 생성할 수 있는 푸리에 급수을 기반으로 만들어 집니다. 쓰나미 파도는 단독파(solitary wave) 모델을 사용하여 시뮬레이션 할 수 있습니다. 넓은 바다에서 실제적인 파도 조건은 임의 무작위 파형 발생기(random wave generator)를 통해 생성 가능 합니다. 그리고 주기적 파형(periodic wave profile)은 정상 파형 패턴 접근 속도를 유체의 초기 조건을 정의하는데 사용될 수 있습니다.

Planing Hulls – Ship Motion

Planing Hulls – Ship Motion

선박의 선체 주위 유동 흐름은 선박 설계자들의 중요한 관심사입니다. 선체 후류의 여러 부분 – 저항 (드래그), 선미 경계층, 유선 와류 및 프로펠러 면의 속도장 등은 정확한 검사가 필요합니다. FLOW-3D내의 GMO(Moving Objects Model) 선박 설계자로 하여금 수면위의 가속되는 선체, 선박의 변위 거동, semi planing의 거동을 모델링 하게 해줍니다. 자유수면에 강한 FLOW-3D의 강점은 엔지니어로 하여금 고진폭파 영향에 있는 선체에 작용하는 압력장, 고속영역의 lamming force 등을 정확하게 예측을 할 수 있게 해 줍니다.

물 위를 달리는 선체의 수상 동적 응답(hydro-dynamic response)은 시뮬레이션 시계열상 나타나는세가지 영역으로 분석된다. 첫 번째 시뮬레이션 단계는 ‘수면에서의 상승’ 단계입니다. 이는 모터 요트가 수력학적 힘( hydrodynamic forcing )이 충분해져 효과적으로 물위의 요트를 들어올릴때 까지의 단계입니다. 두 번째 시뮬레이션 단계는 40 노트로 평면 수면위로 운행하는 것을 보여주고, 세 번째 시뮬레이션은 밀려오는 파도 필드로 고속의 요트의 응답을 보여줍니다.

Breakwater Structures

Breakwater Structures

복잡한 지형과 해안 구조를 통해 큰 진폭의 비선형 파를 모델링 할 수 있는 FLOW-3D의 능력은 간단한 선형 파에서 복잡한 바다 상태에 이르기까지 파도의 강제 유체 역학적 방파제 구조물의 성능을 분석 할 수 있는 이상적인 도구입니다. 수신 파로부터 운동 에너지를 제거하여 구조물 의 강도를 측정하는 것 이외에도 FLOW-3D는 사용자로 하여금 퇴적물 전송의 상세한 분석을 수행 할 수 있게 하며 방파제 요소에 작용하는 힘의 평가도 가능합니다. 생태학적 요구로 인해 통합 연안 구조가 더 중요해 지는 상황에서 FLOW-3D는 엔지니어로 하여금 구조물의 주위에 흐름 패턴의 세부 사항을 평가할 수 있습니다.

Rubble-mound Breakwaters Simulation

Rubble-mound Breakwaters Simulation

테트라포드 방파제는 종종 극심한 파동 하중의 영향으로부터 해안선을 보호하고 긴 해안 표류를 막기 위해 사용됩니다. 엔지니어는 FLOW-3D를 사용하여 보호 레이어, 파동 반사 계수 및 이러한 구조와 관련된 볼륨 overtopping volumes 을 추정할 수 있습니다.

FLOW-3D Bibliography

FLOW-3D Bibliography

논문자료 | Bibliography

FLOW-3D 참고 문헌은 FLOW-3D를 사용하는 중에 도움이 될만한 기술적인 자료와 논문 들을 포함하고 있습니다. 본 자료는 FLOW-3D 소프트웨어를 사용하여 기술개발을 원활하게 할 수 있도록 지속적으로 보완하고 업데이트 되는 자료입니다.

제공데이터 목록에서 일부 다운로드 링크나 원문제공 서버의 서비스가 없어진 경우에는 해당 자료를 제공하는 측에서 변경하여 서비스가 더 이상 제공되지 않는 경우입니다. 안타깝지만 다른 검색방법이나 기관들을 통해 자료를 찾아보아야 합니다. 이 점 참고하여 주시기 바랍니다.

귀하께서 발표하거나 발행한 FLOW-3D 관련 논문이 목록에 없는 경우 발행물을 참조할 수 있도록 알려 주시기 바랍니다. 귀하의 연구가 많은 사람에게 도움이 될 것입니다.

주요 기술 자료

인공 박차 및 홈 암초 형성에서 자연 암초 유체 역학의 생체 모방

Emilee Wissmach, 플로리다 공과대학, 2023.

이 대학원 논문에서는 파도 감쇠 및 해안 보호에 있어 생체모방형 SAG(생체모방형 스퍼 앤 그루브) 수중 방파제 설계의 효율성을 탐구했습니다. FLOW-3D HYDRO는 파고 감소와 재료 비용을 위한 새로운 모듈 기반 설계를 분석하고 최적화하는 데 사용되었습니다. 인공 SAG 구조는 잠재적으로 고에너지 환경에서 해안선 보호 역할을 하는 동시에 취약한 산호초 생태계를 재건하는 데 도움이 될 수 있습니다.

FLOW-3D HYDRO는 FLOW-3D 학술 프로그램을 통해 제공되었습니다.

“전 세계 연안 해역에서 산호초 개체수가 급격히 감소하고 있습니다. 이러한 생태계를 잃으면 서식지와 생물 다양성이 손실될 뿐만 아니라 파도 감쇠 및 그에 따른 해안 보호도 손실됩니다. 진행 중인 프로젝트에서는 파괴된 산호초를 복구 및/또는 교체하려고 합니다. 암초 공 및 립 랩과 같은 인공 구조물을 사용하지만 건강한 자연 암초만큼 성능을 ​​발휘하는 것은 없습니다. 이 프로젝트는 자연 암초에서 흔히 발견되는 암초 능선 및 박차 및 홈(SAG) 구역을 모방한 규모 모듈을 만들어 사용했습니다. 이러한 모델은 인공 암초 설계에 대한 새로운 노력을 지원합니다. […] 암초 모듈의 3D 렌더링이 생성되어 유체 구조 상호 작용에 대한 정보를 계산하는 데 사용된 CFD 소프트웨어 패키지 FLOW-3D HYDRO 로 가져왔습니다.”

Biomimicry of natural reef hydrodynamics in an artificial spur and groove reef formation(Wissmach, 2023년에서 발췌 및 그림.)

일리노이 고속도로에서 눈 더미의 영향을 줄이기위한 생활 장벽 설계

John Petrie, et al. (2020) 일리노이 교통 센터 시리즈 번호 20-019, 연구 보고서 번호 FHWA-ICT-20-012.

  • Illinois Center for Transportation은 FLOW-3D를 사용하여 CFD 시뮬레이션을 수행하여 주 고속도로에서 눈 드리프트를 최소화하기 위해 구조적 눈 울타리의 대안 인 살아있는 눈 울타리 (LSF) 배치 지침을 개발했습니다.
  • 고속도로를 따라 제설 울타리를 설치하면 쟁기질, 화학 물질 및 도로 폐쇄의 필요성이 줄어들고 눈이 내리는 동안 도로 안전이 향상됩니다. LSF는 구조적 눈 울타리에 대한 저렴하고 오래 지속되는 대안입니다.
  • 구조적 눈 울타리의 설계 및 배치에 대한 고려 사항에는 울타리 높이, 다공성, 길이, 바닥 간격 및 우세한 풍향이 포함됩니다. 그러나 LSF의 자연스러운 발전은 높이 및 다공성과 같은 기능이 시간이 지남에 따라 변할 것임을 의미합니다.
Diagram. The fetch concept used to estimate snow transport/ Diagram. Schematic design of a living snow fence
다이어그램 : 울타리의 수치 시뮬레이션, 실제 모델 대 다공성 모델의 속도 크기 등고선

CFD 소프트웨어인 FLOW-3D를 사용하여 다공성 울타리 주변의 흐름에 대한 일련의 수치 시뮬레이션을 수행했습니다. 모델링 접근법은 불균일한 다공성을 가진 울타리 주변의 흐름에 대해 풍동에서 수집된 실험실 데이터를 사용하여 검증되었습니다. 검증 후, 수치 접근 방식을 사용하여 울타리 다공성에 대한 모델을 테스트하고 두 줄의 초목으로 구성된 울타리의 줄 간격 효과를 조사했습니다. 시뮬레이션은 평탄한 지형에 걸친 평균 풍속 및 울타리 다공성 범위에 초점을 맞추었고, 이러한 시뮬레이션의 결과는 임계 전단 속도를 사용하여 눈 퇴적 지역을 추정하는 데 사용되었습니다. 지형이 평평하다고 간주할 수 없는 사이트의 경우 울타리 구성이 다른 제방에 대해 시뮬레이션을 수행했습니다.

CFD 시뮬레이션은 울타리 특성의 함수로 눈 퇴적이 예상되는 지역의 길이에 대한 추정치를 제공합니다. 그 후 시뮬레이션 결과는 LSF에 대한 설계 지침을 개발하는 데 사용됩니다.”

연락처 : 02-2026-0455
이메일 : flow3d@stikorea.co.kr